| Param | Original file | Final file |
|---|---|---|
| Filename | modeM0/AS1A10_094T33_9000004664_31962cztM0_level2.evt | modeM0/AS1A10_094T33_9000004664_31962cztM0_level2_quad_clean.evt |
| Size (bytes) | 365,336,640 | 69,344,640 |
| Size | 348.4 MB | 66.1 MB |
| Events in quadrant A | 2,058,217 | 462,928 |
| Events in quadrant B | 3,317,155 | 457,231 |
| Events in quadrant C | 2,323,235 | 445,797 |
| Events in quadrant D | 3,082,749 | 440,638 |
| Mode SS | |||
|---|---|---|---|
| Quadrant | BADHDUFLAG | Total packets | Discarded packets |
| A | 0 | 84 | 0 |
| B | 0 | 84 | 0 |
| C | 0 | 84 | 0 |
| D | 0 | 84 | 0 |
| Mode M0 | |||
|---|---|---|---|
| Quadrant | BADHDUFLAG | Total packets | Discarded packets |
| A | 0 | 8492 | 0 |
| B | 0 | 12765 | 0 |
| C | 0 | 9398 | 0 |
| D | 0 | 12244 | 0 |
| Quadrant | Total seconds | Saturated seconds | Saturation percentage |
|---|---|---|---|
| A | 4159 | 3 | 0.072133% |
| B | 4159 | 36 | 0.865593% |
| C | 4159 | 55 | 1.322433% |
| D | 4159 | 57 | 1.370522% |
Noise dominated data is calculated using 1-second bins in cleaned event files. If a bin has >2000 counts, and if more than 50% of those come from <1% of pixels, then it is considered to be noise-dominated and hence unusable.
| Quadrant | # 1 sec bins | Bins with >0 counts | Bins with >2000 counts | High rate bins dominated by noise | Noise dominated (total time) | Noise dominated (detector-on time) | Marked lightcurve |
|---|---|---|---|---|---|---|---|
| A | 4159 | 4159 | 0 | 0 | 0.00% | 0.00% | 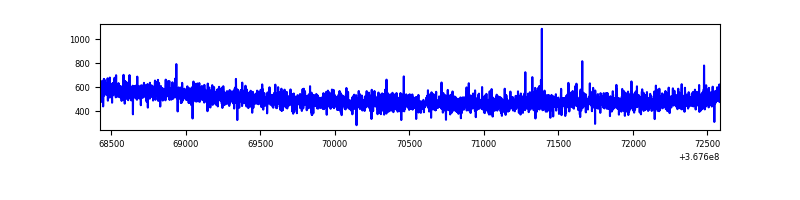 |
| B | 4159 | 4159 | 19 | 19 | 0.46% | 0.46% | 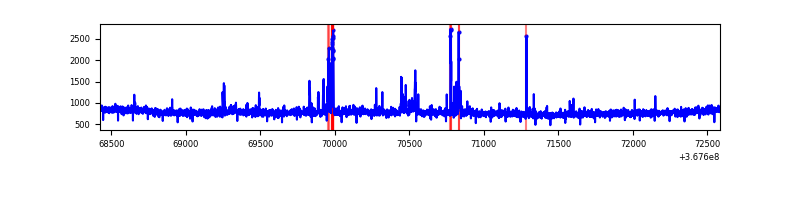 |
| C | 4159 | 4159 | 32 | 32 | 0.77% | 0.77% | 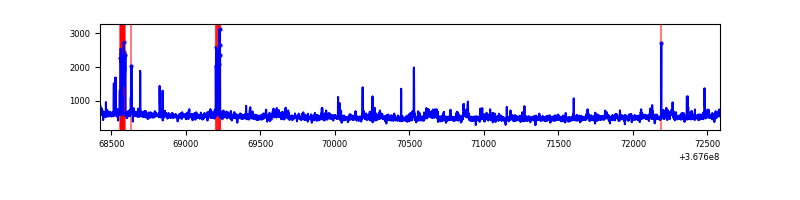 |
| D | 4159 | 4159 | 56 | 56 | 1.35% | 1.35% | 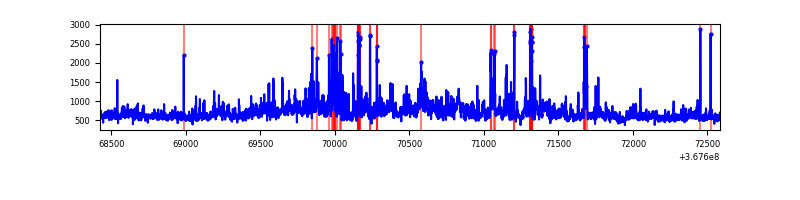 |
Top three noisy pixels from each quadrant. If the there are fewer than three noisy pixels in the level2.evt file, extra rows are filled as -1
| Pixel properties | Quadrant properties | ||||||
|---|---|---|---|---|---|---|---|
| Quadrant | DetID | PixID | Counts | Sigma | Mean | Median | Sigma |
| A | 13 | 254 | 8271 | 72.88 | 530 | 521 | 106.3 |
| A | 14 | 238 | 8246 | 72.64 | 530 | 521 | 106.3 |
| A | 13 | 6 | 5819 | 49.82 | 530 | 521 | 106.3 |
| B | 6 | 159 | 1145635 | 11862.15 | 517 | 505 | 96.5 |
| B | 5 | 172 | 69975 | 719.62 | 517 | 505 | 96.5 |
| B | 0 | 190 | 19660 | 198.42 | 517 | 505 | 96.5 |
| C | 0 | 10 | 153344 | 1319.83 | 503 | 507 | 115.8 |
| C | 3 | 233 | 112820 | 969.88 | 503 | 507 | 115.8 |
| C | 14 | 238 | 83026 | 712.59 | 503 | 507 | 115.8 |
| D | 8 | 195 | 788902 | 6436.83 | 512 | 500 | 122.5 |
| D | 13 | 249 | 253923 | 2069.05 | 512 | 500 | 122.5 |
| D | 12 | 233 | 36134 | 290.93 | 512 | 500 | 122.5 |
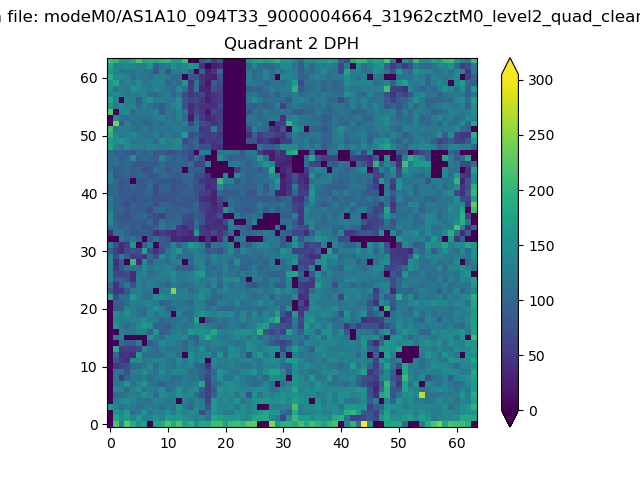
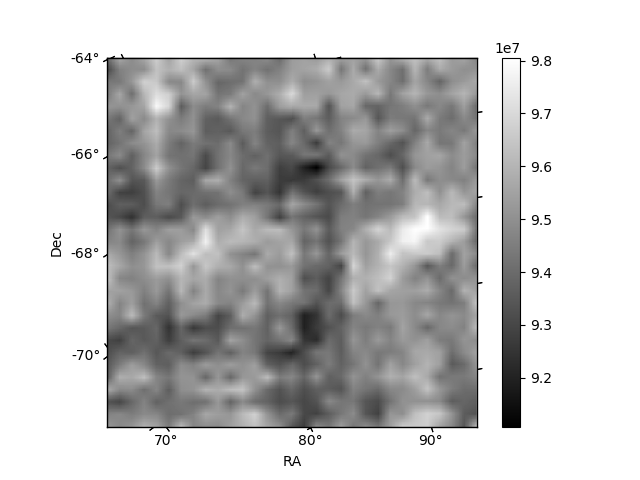
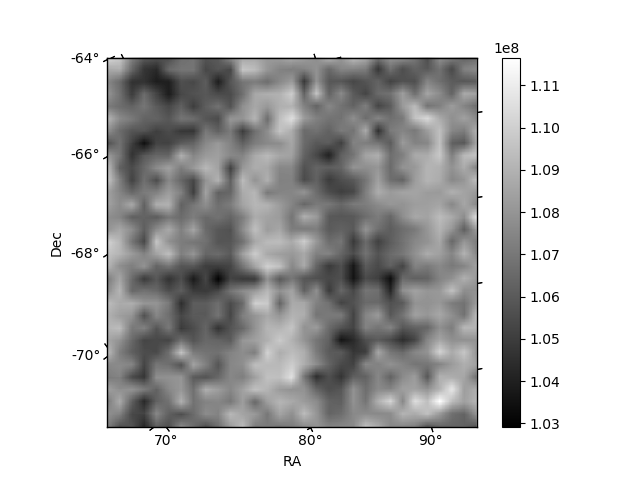
Histogram calculated using DETX and DETY for each event in the final _common_clean file
| Quadrant A | 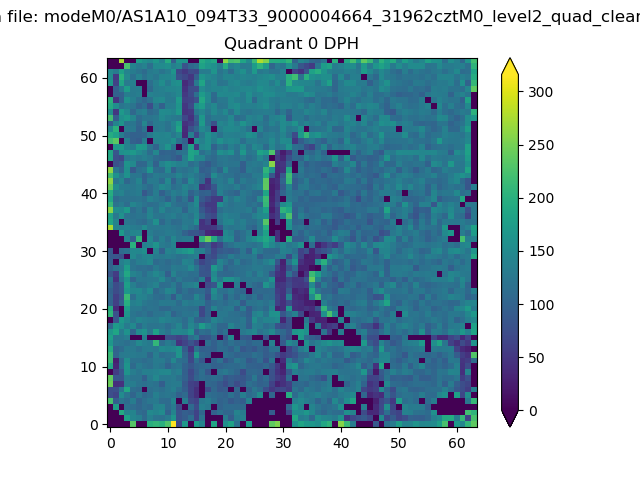 |
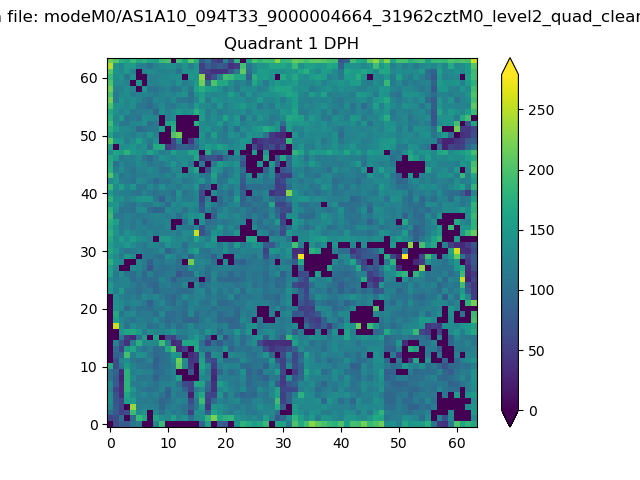 |
Quadrant B |
|---|---|---|---|
| Quadrant D | 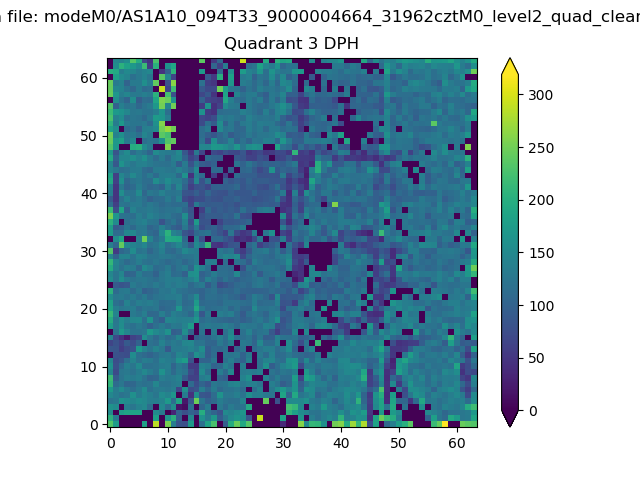 |
 |
Quadrant C |
| Plot type | Count rate plots | Images |
|---|---|---|
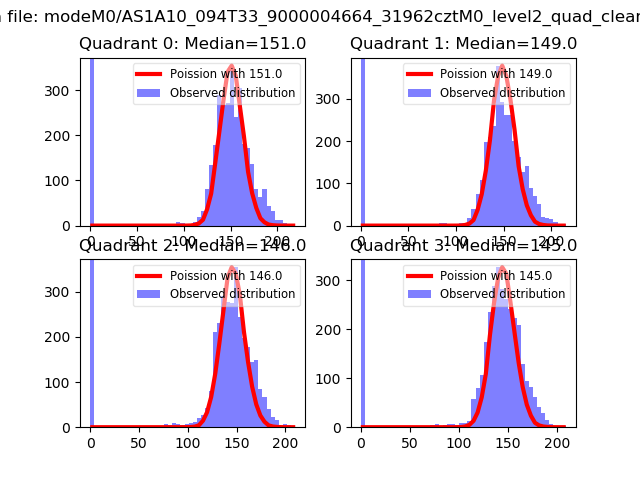
| Comparison with Poisson distribution Blue bars denote a histogram of data divided into 1 sec bins. Red curve is a Poisson curve with rate = median count rate of data. |
 |
 |
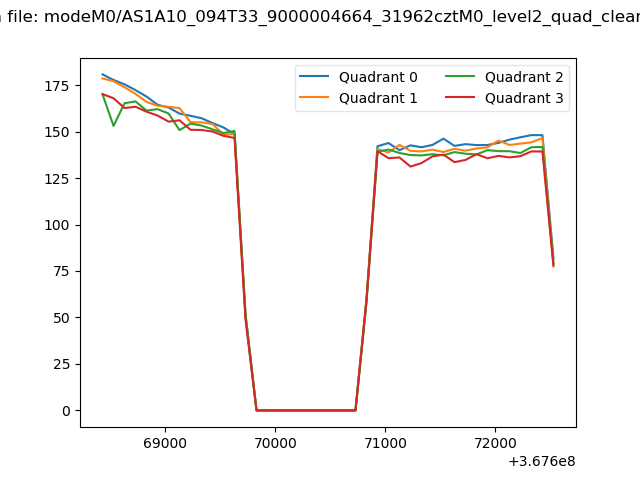
| Quadrant-wise count rates Data is divided into 100 sec bins |
 |
|
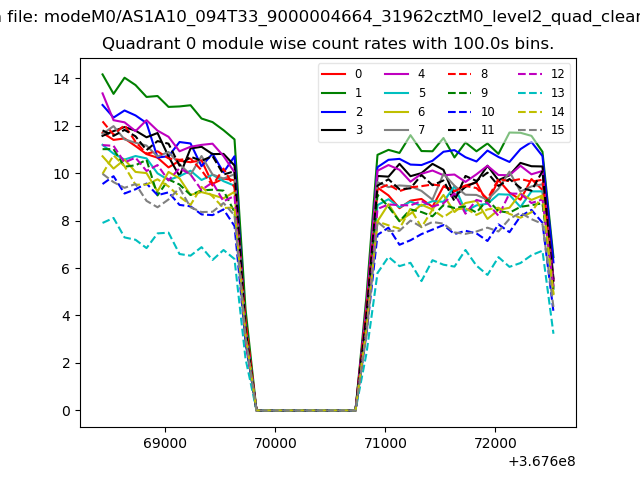
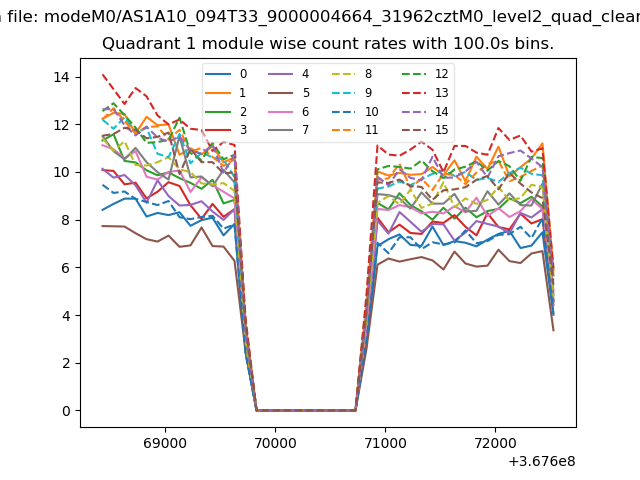
| Module-wise count rates for Quadrant A Data is divided into 100 sec bins |
 |
 |
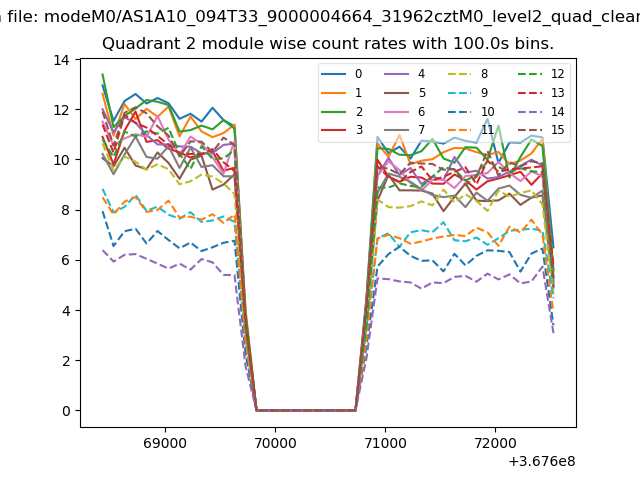
| Module-wise count rates for Quadrant B Data is divided into 100 sec bins |
 |
 |
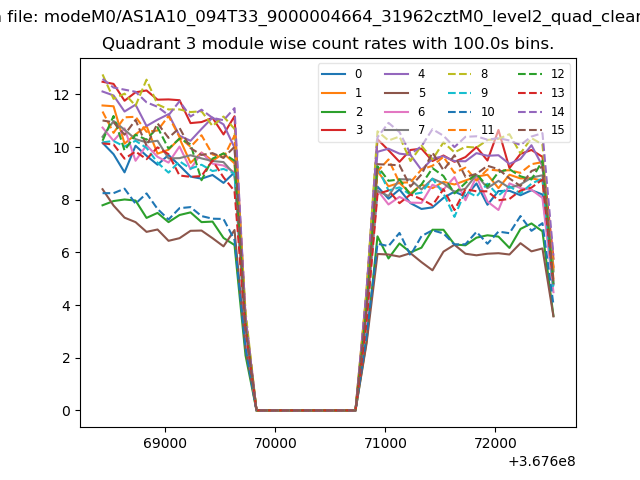
| Module-wise count rates for Quadrant C Data is divided into 100 sec bins |
 |
 |
| Module-wise count rates for Quadrant D Data is divided into 100 sec bins |
 |
 |
| Parameter | Plot |
|---|---|
| CZT HV Monitor | 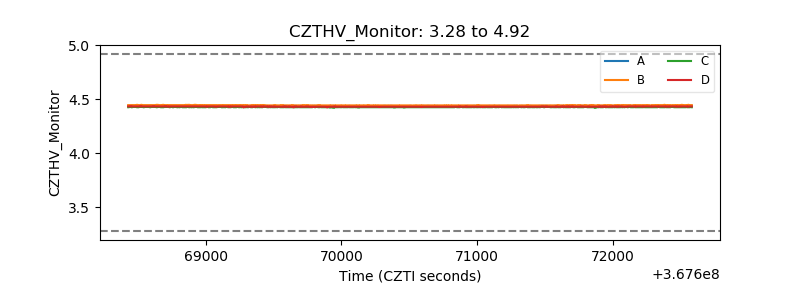 |
| D_VDD | 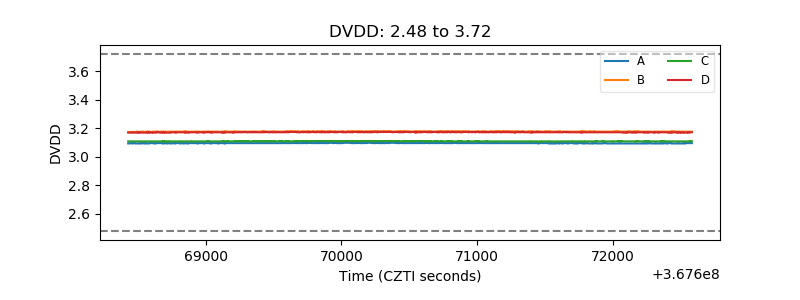 |
| Temperature 1 | 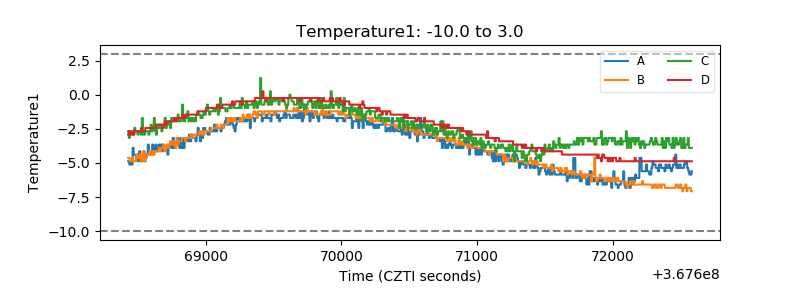 |
| Veto HV Monitor |  |
| Veto LLD | 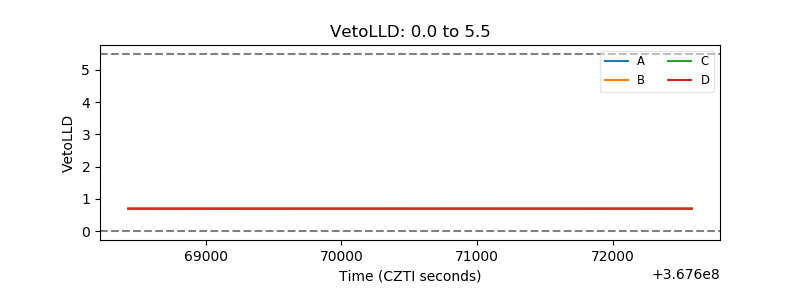 |
| Alpha Counter | 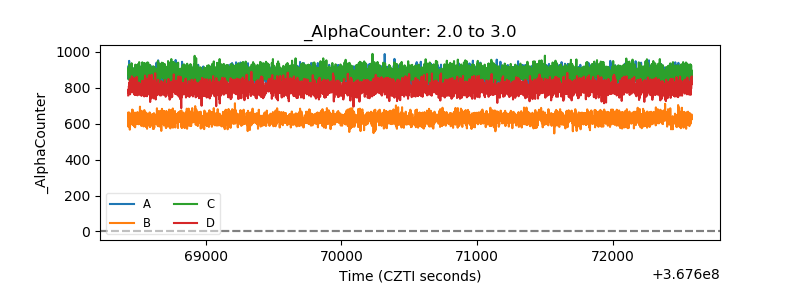 |
| _CPM_Rate |  |
| CZT Counter | 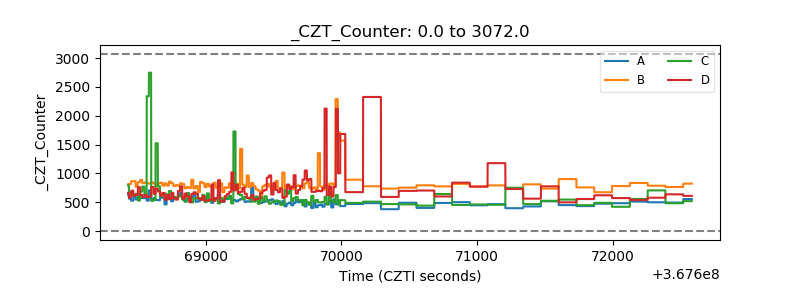 |
| +2.5 Volts monitor |  |
| +5 Volts monitor | 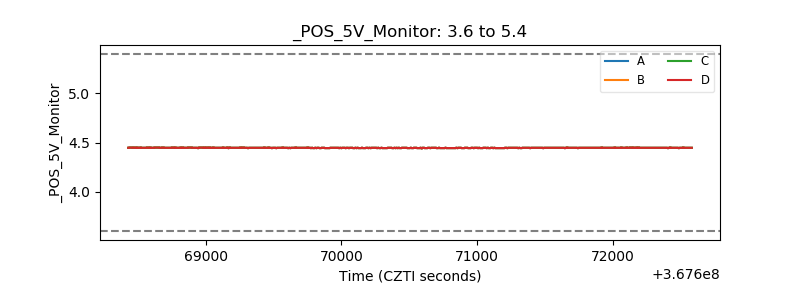 |
| _ROLL_ROT | 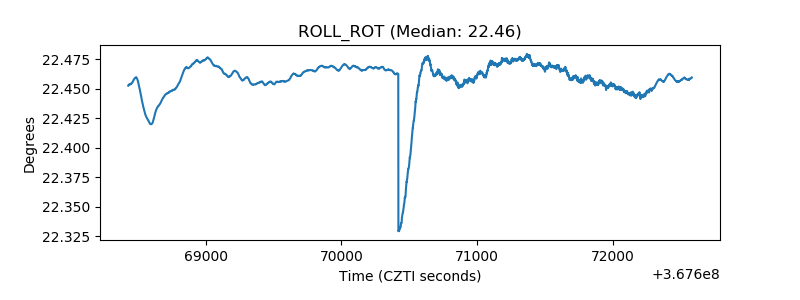 |
| _Roll_DEC | 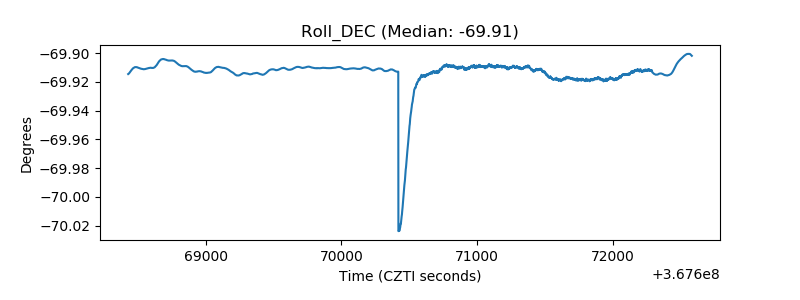 |
| _Roll_RA | 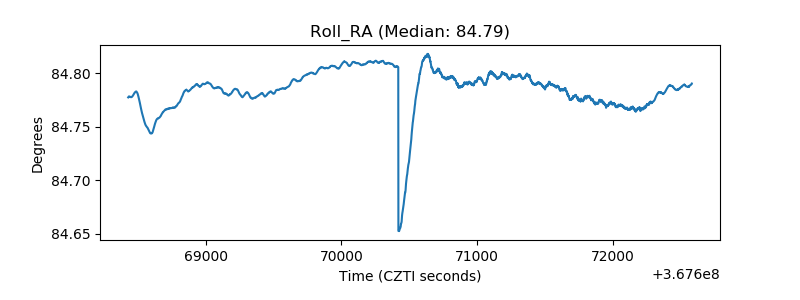 |
| Veto Counter | 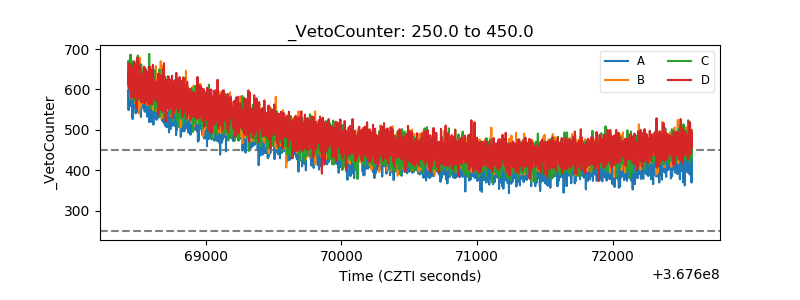 |