| Param | Original file | Final file |
|---|---|---|
| Filename | modeM0/AS1A10_094T34_9000004662cztM0_level2.fits | modeM0/AS1A10_094T34_9000004662cztM0_level2_quad_clean.evt |
| Size (bytes) | 175,832,640 | 79,807,680 |
| Size | 167.7 MB | 76.1 MB |
| Events in quadrant A | 1,135,682 | 345,406 |
| Events in quadrant B | 1,039,392 | 336,156 |
| Events in quadrant C | 1,065,660 | 325,748 |
| Events in quadrant D | 957,778 | 281,274 |
| Mode M0 | |||
|---|---|---|---|
| Quadrant | BADHDUFLAG | Total packets | Discarded packets |
| A | 0 | 34462 | 0 |
| B | 0 | 50908 | 0 |
| C | 0 | 47077 | 0 |
| D | 0 | 45839 | 0 |
| Mode M9 | |||
|---|---|---|---|
| Quadrant | BADHDUFLAG | Total packets | Discarded packets |
| A | 0 | 36 | 0 |
| B | 0 | 36 | 0 |
| C | 0 | 36 | 0 |
| D | 0 | 36 | 0 |
| Mode SS | |||
|---|---|---|---|
| Quadrant | BADHDUFLAG | Total packets | Discarded packets |
| A | 0 | 332 | 0 |
| B | 0 | 332 | 0 |
| C | 0 | 332 | 0 |
| D | 0 | 332 | 0 |
| Quadrant | Total seconds | Saturated seconds | Saturation percentage |
|---|---|---|---|
| A | 16333 | 127 | 0.777567% |
| B | 16333 | 385 | 2.357191% |
| C | 16333 | 1052 | 6.440948% |
| D | 16333 | 918 | 5.620523% |
Noise dominated data is calculated using 1-second bins in cleaned event files. If a bin has >2000 counts, and if more than 50% of those come from <1% of pixels, then it is considered to be noise-dominated and hence unusable.
| Quadrant | # 1 sec bins | Bins with >0 counts | Bins with >2000 counts | High rate bins dominated by noise | Noise dominated (total time) | Noise dominated (detector-on time) | Marked lightcurve |
|---|---|---|---|---|---|---|---|
| A | 19897 | 16329 | 0 | 0 | 0.00% | 0.00% |  |
| B | 19898 | 16327 | 0 | 0 | 0.00% | 0.00% |  |
| C | 19897 | 16327 | 0 | 0 | 0.00% | 0.00% | 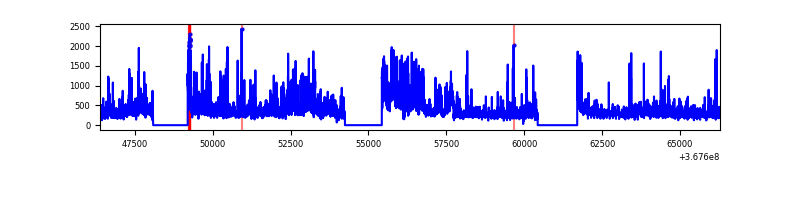 |
| D | 19898 | 16304 | 0 | 0 | 0.00% | 0.00% |  |
Top three noisy pixels from each quadrant. If the there are fewer than three noisy pixels in the level2.evt file, extra rows are filled as -1
| Pixel properties | Quadrant properties | ||||||
|---|---|---|---|---|---|---|---|
| Quadrant | DetID | PixID | Counts | Sigma | Mean | Median | Sigma |
| A | 0 | 29 | 1073 | 10.84 | 297 | 282 | 72.9 |
| A | 0 | 30 | 878 | 8.17 | 297 | 282 | 72.9 |
| A | 7 | 110 | 848 | 7.76 | 297 | 282 | 72.9 |
| B | 2 | 9 | 842 | 10.27 | 276 | 266 | 56.1 |
| B | 3 | 80 | 712 | 7.95 | 276 | 266 | 56.1 |
| B | 5 | 128 | 697 | 7.68 | 276 | 266 | 56.1 |
| C | 3 | 202 | 871 | 8.4 | 281 | 267 | 71.9 |
| C | 1 | 81 | 867 | 8.34 | 281 | 267 | 71.9 |
| C | 1 | 80 | 832 | 7.85 | 281 | 267 | 71.9 |
| D | 10 | 189 | 709 | 6.25 | 274 | 252 | 73.1 |
| D | 7 | 3 | 701 | 6.14 | 274 | 252 | 73.1 |
| D | 15 | 47 | 689 | 5.98 | 274 | 252 | 73.1 |
Histogram calculated using DETX and DETY for each event in the final _common_clean file
| Quadrant A |  |
 |
Quadrant B |
|---|---|---|---|
| Quadrant D |  |
 |
Quadrant C |
| Plot type | Count rate plots | Images |
|---|---|---|
| Comparison with Poisson distribution Blue bars denote a histogram of data divided into 1 sec bins. Red curve is a Poisson curve with rate = median count rate of data. |
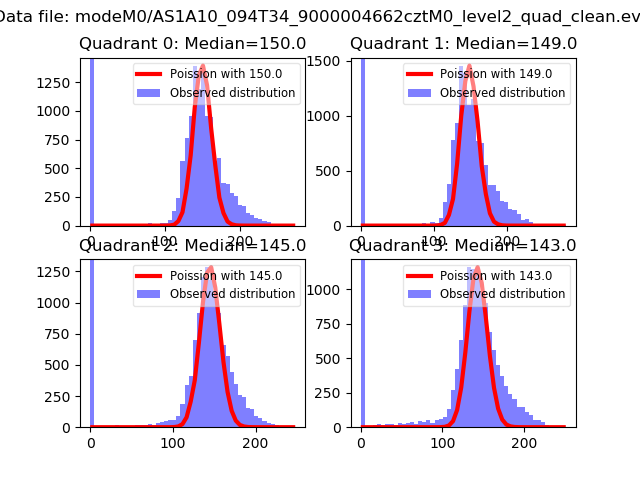 |
 |
| Quadrant-wise count rates Data is divided into 100 sec bins |
 |
|
| Module-wise count rates for Quadrant A Data is divided into 100 sec bins |
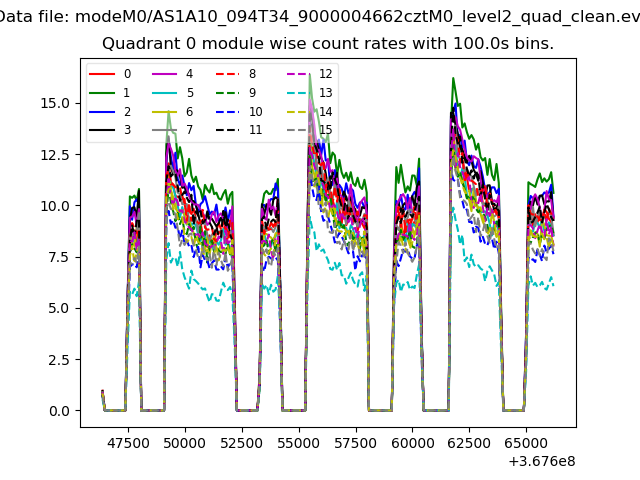 |
 |
| Module-wise count rates for Quadrant B Data is divided into 100 sec bins |
 |
 |
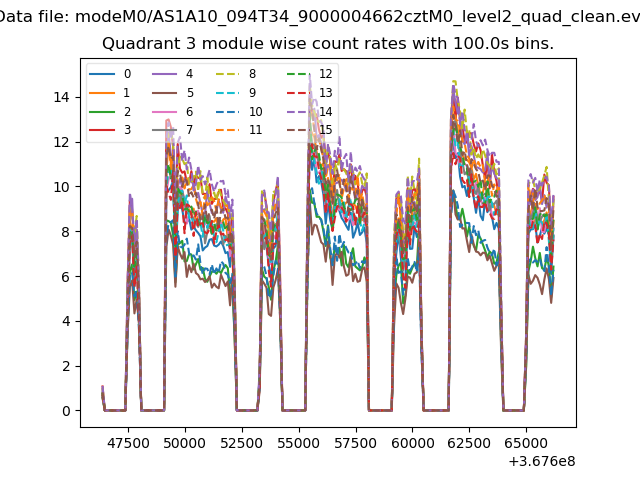
| Module-wise count rates for Quadrant C Data is divided into 100 sec bins |
 |
 |
| Module-wise count rates for Quadrant D Data is divided into 100 sec bins |
 |
 |
| Parameter | Plot |
|---|---|
| CZT HV Monitor |  |
| D_VDD |  |
| Temperature 1 |  |
| Veto HV Monitor |  |
| Veto LLD |  |
| Alpha Counter |  |
| _CPM_Rate |  |
| CZT Counter |  |
| +2.5 Volts monitor |  |
| +5 Volts monitor |  |
| _ROLL_ROT |  |
| _Roll_DEC |  |
| _Roll_RA |  |
| Veto Counter |  |