| Param | Original file | Final file |
|---|---|---|
| Filename | modeM0/AS1A10_094T34_9000004662_31958cztM0_level2.evt | modeM0/AS1A10_094T34_9000004662_31958cztM0_level2_quad_clean.evt |
| Size (bytes) | 305,778,240 | 46,569,600 |
| Size | 291.6 MB | 44.4 MB |
| Events in quadrant A | 1,616,082 | 307,583 |
| Events in quadrant B | 2,572,759 | 309,081 |
| Events in quadrant C | 2,444,400 | 289,582 |
| Events in quadrant D | 2,413,845 | 280,722 |
| Mode M0 | |||
|---|---|---|---|
| Quadrant | BADHDUFLAG | Total packets | Discarded packets |
| A | 0 | 6621 | 1 |
| B | 0 | 9679 | 1 |
| C | 0 | 9508 | 1 |
| D | 0 | 9157 | 1 |
| Mode M9 | |||
|---|---|---|---|
| Quadrant | BADHDUFLAG | Total packets | Discarded packets |
| A | 0 | 11 | 0 |
| B | 0 | 11 | 0 |
| C | 0 | 11 | 0 |
| D | 0 | 11 | 0 |
| Mode SS | |||
|---|---|---|---|
| Quadrant | BADHDUFLAG | Total packets | Discarded packets |
| A | 0 | 64 | 0 |
| B | 0 | 64 | 0 |
| C | 0 | 64 | 0 |
| D | 0 | 64 | 0 |
| Quadrant | Total seconds | Saturated seconds | Saturation percentage |
|---|---|---|---|
| A | 3133 | 33 | 1.053304% |
| B | 3133 | 80 | 2.553463% |
| C | 3133 | 219 | 6.990105% |
| D | 3133 | 243 | 7.756144% |
Noise dominated data is calculated using 1-second bins in cleaned event files. If a bin has >2000 counts, and if more than 50% of those come from <1% of pixels, then it is considered to be noise-dominated and hence unusable.
| Quadrant | # 1 sec bins | Bins with >0 counts | Bins with >2000 counts | High rate bins dominated by noise | Noise dominated (total time) | Noise dominated (detector-on time) | Marked lightcurve |
|---|---|---|---|---|---|---|---|
| A | 4243 | 3133 | 0 | 0 | 0.00% | 0.00% | 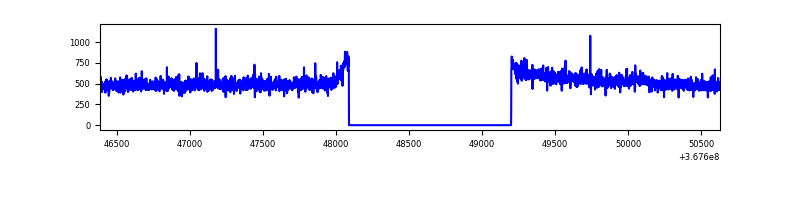 |
| B | 4243 | 3133 | 13 | 13 | 0.31% | 0.41% | 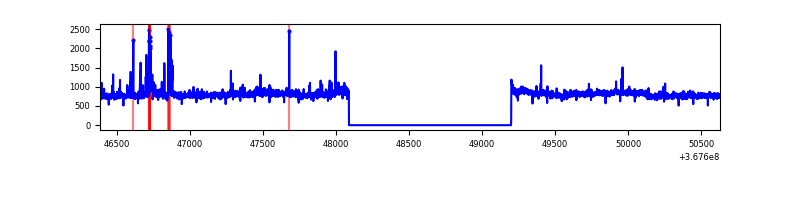 |
| C | 4243 | 3133 | 74 | 74 | 1.74% | 2.36% | 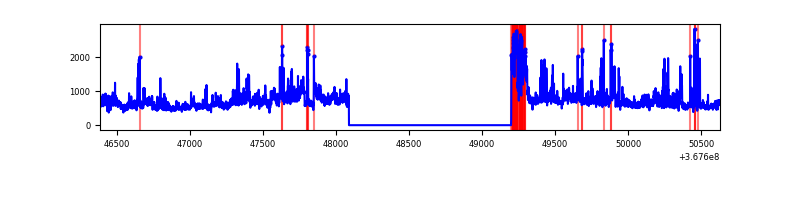 |
| D | 4243 | 3133 | 187 | 187 | 4.41% | 5.97% | 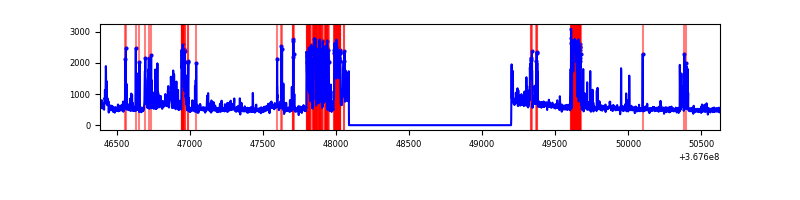 |
Top three noisy pixels from each quadrant. If the there are fewer than three noisy pixels in the level2.evt file, extra rows are filled as -1
| Pixel properties | Quadrant properties | ||||||
|---|---|---|---|---|---|---|---|
| Quadrant | DetID | PixID | Counts | Sigma | Mean | Median | Sigma |
| A | 15 | 174 | 5822 | 64.2 | 416 | 407 | 84.3 |
| A | 13 | 254 | 5525 | 60.68 | 416 | 407 | 84.3 |
| A | 13 | 6 | 4586 | 49.54 | 416 | 407 | 84.3 |
| B | 6 | 159 | 857321 | 10775.01 | 410 | 399 | 79.5 |
| B | 5 | 172 | 49447 | 616.73 | 410 | 399 | 79.5 |
| B | 0 | 229 | 18178 | 223.55 | 410 | 399 | 79.5 |
| C | 3 | 233 | 458956 | 4950.53 | 392 | 396 | 92.6 |
| C | 0 | 10 | 362691 | 3911.27 | 392 | 396 | 92.6 |
| C | 14 | 238 | 67346 | 722.78 | 392 | 396 | 92.6 |
| D | 13 | 249 | 472555 | 5036.58 | 392 | 381 | 93.7 |
| D | 12 | 218 | 182467 | 1942.27 | 392 | 381 | 93.7 |
| D | 8 | 195 | 125819 | 1338.02 | 392 | 381 | 93.7 |
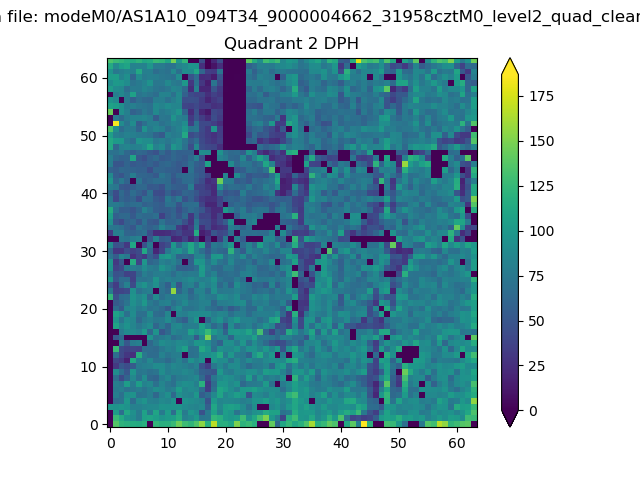
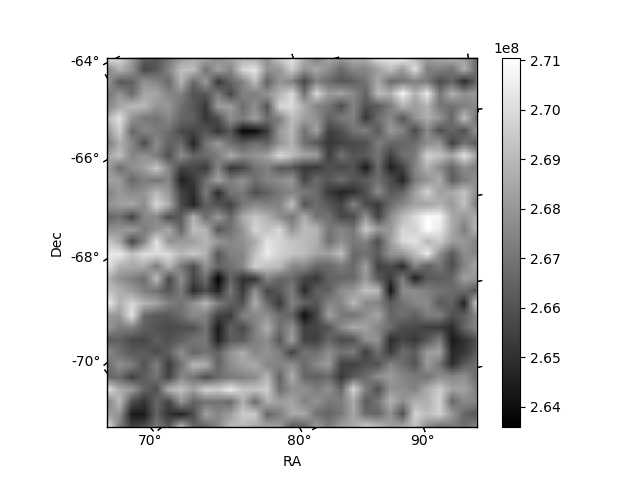
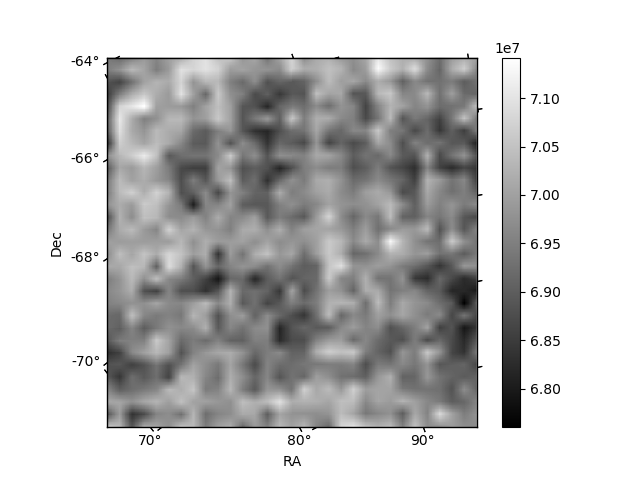
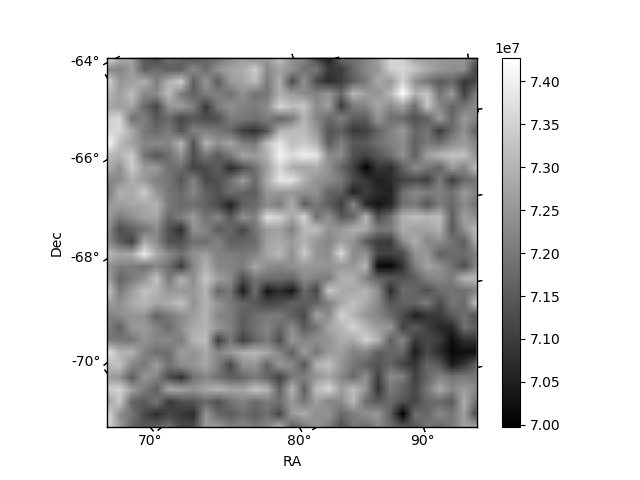
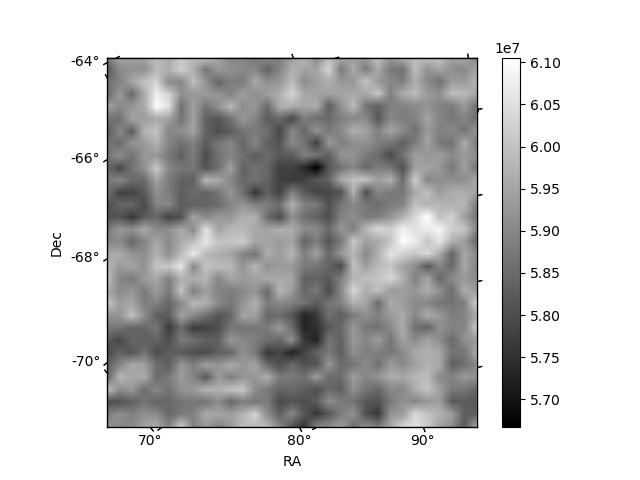
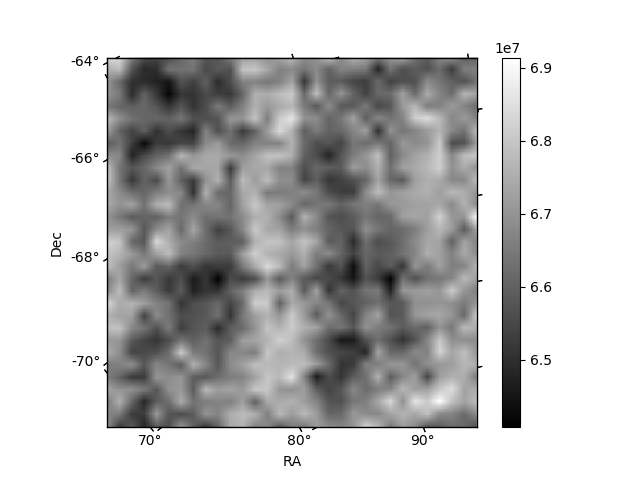
Histogram calculated using DETX and DETY for each event in the final _common_clean file
| Quadrant A | 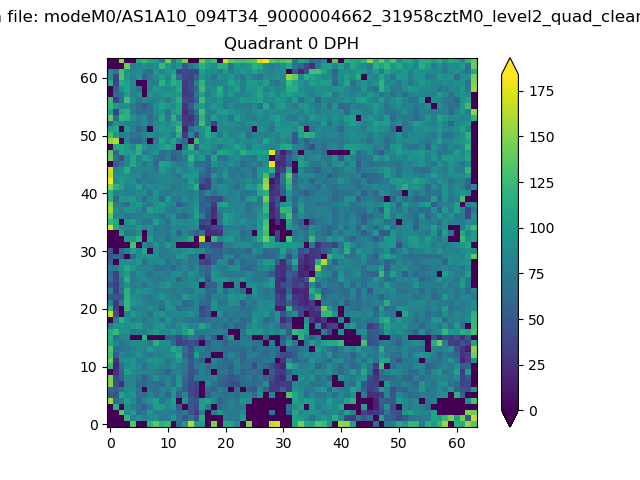 |
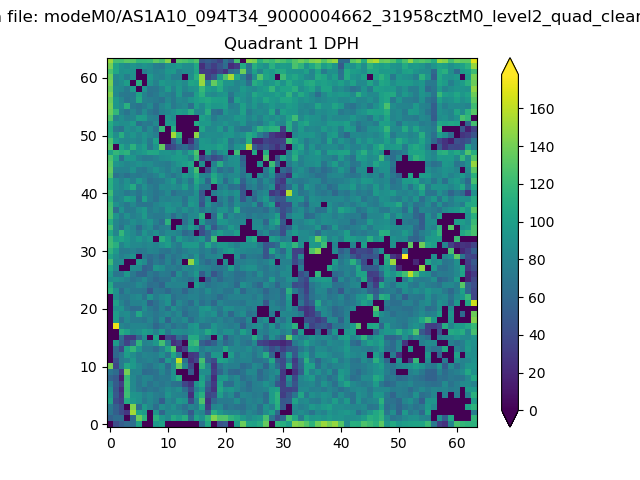 |
Quadrant B |
|---|---|---|---|
| Quadrant D | 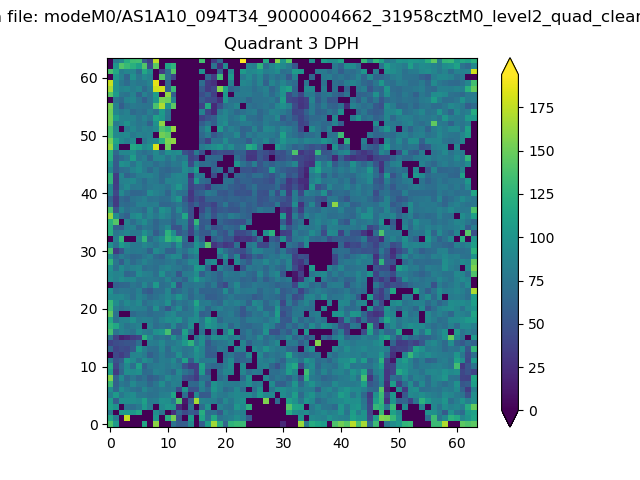 |
 |
Quadrant C |
| Plot type | Count rate plots | Images |
|---|---|---|
| Comparison with Poisson distribution Blue bars denote a histogram of data divided into 1 sec bins. Red curve is a Poisson curve with rate = median count rate of data. |
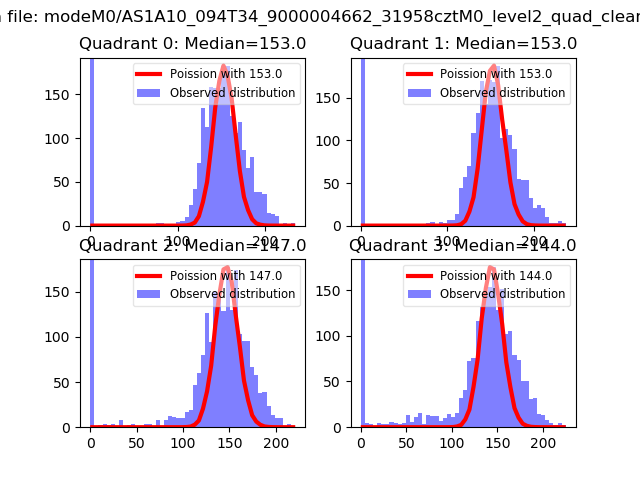 |
 |
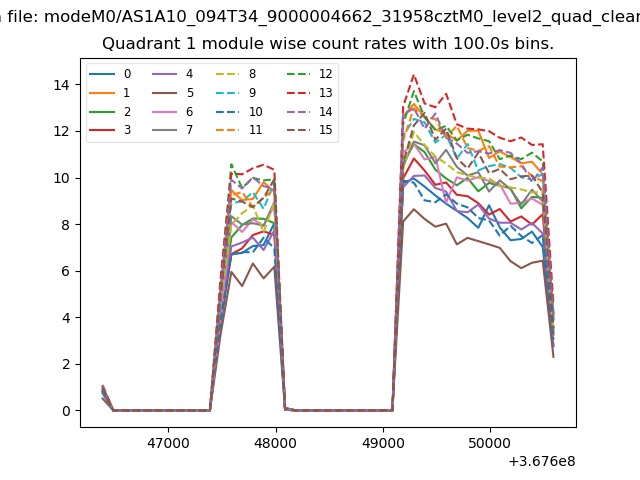
| Quadrant-wise count rates Data is divided into 100 sec bins |
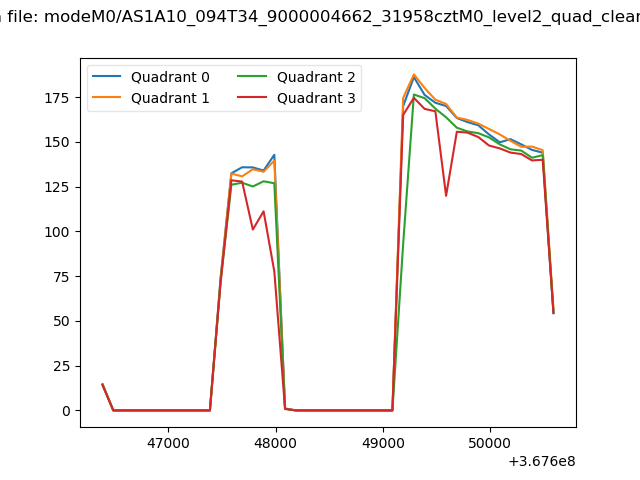 |
|
| Module-wise count rates for Quadrant A Data is divided into 100 sec bins |
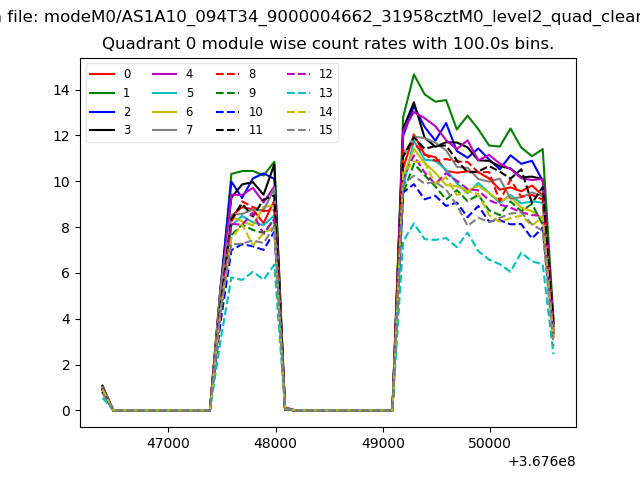 |
 |
| Module-wise count rates for Quadrant B Data is divided into 100 sec bins |
 |
 |
| Module-wise count rates for Quadrant C Data is divided into 100 sec bins |
 |
 |
| Module-wise count rates for Quadrant D Data is divided into 100 sec bins |
 |
 |
| Parameter | Plot |
|---|---|
| CZT HV Monitor |  |
| D_VDD | 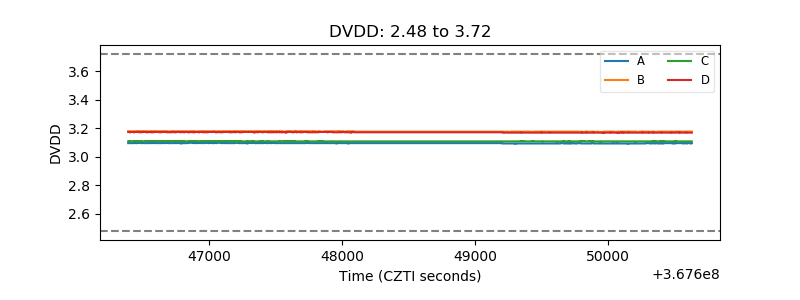 |
| Temperature 1 | 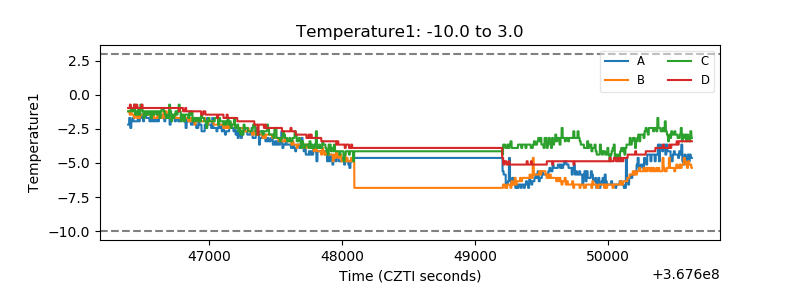 |
| Veto HV Monitor | 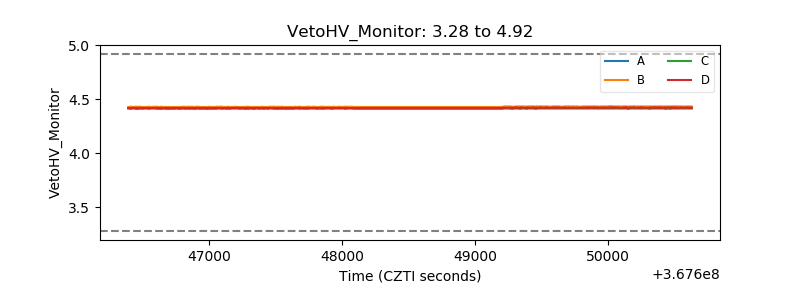 |
| Veto LLD | 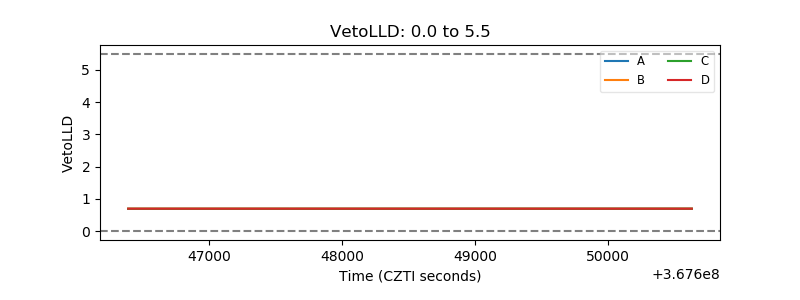 |
| Alpha Counter | 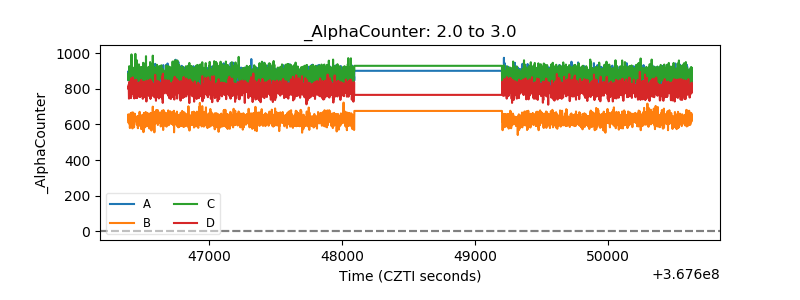 |
| _CPM_Rate | 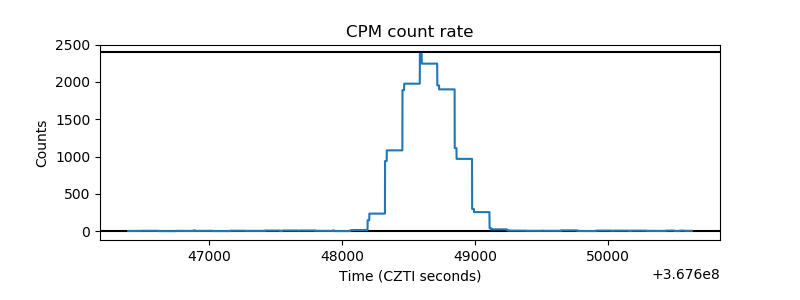 |
| CZT Counter | 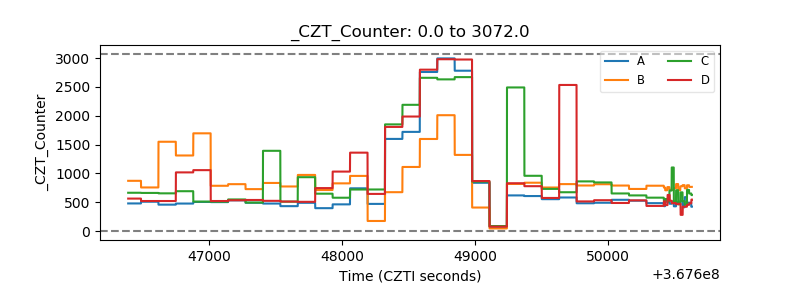 |
| +2.5 Volts monitor |  |
| +5 Volts monitor |  |
| _ROLL_ROT | 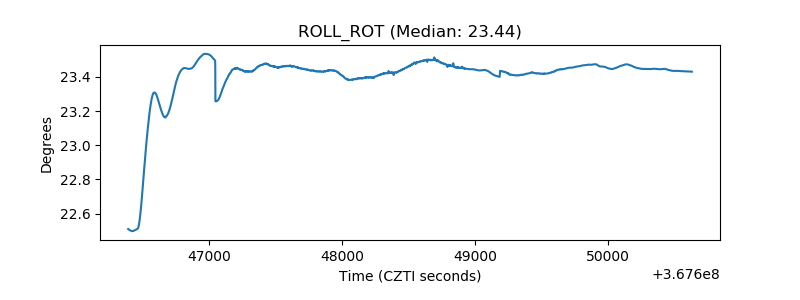 |
| _Roll_DEC | 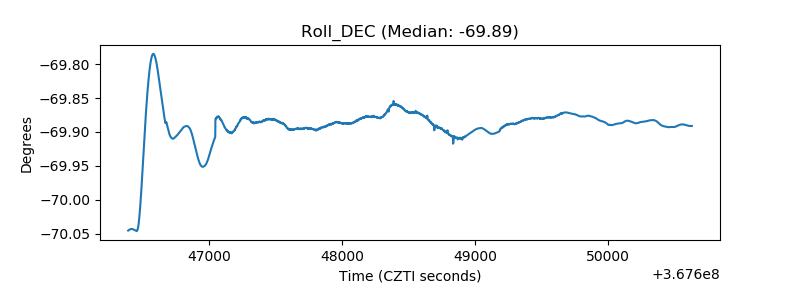 |
| _Roll_RA |  |
| Veto Counter |  |