| Param | Original file | Final file |
|---|---|---|
| Filename | modeM0/AS1A10_053T10_9000004670cztM0_level2.fits | modeM0/AS1A10_053T10_9000004670cztM0_level2_quad_clean.evt |
| Size (bytes) | 225,466,560 | 112,112,640 |
| Size | 215.0 MB | 106.9 MB |
| Events in quadrant A | 1,435,706 | 518,830 |
| Events in quadrant B | 1,353,072 | 513,181 |
| Events in quadrant C | 1,346,848 | 454,011 |
| Events in quadrant D | 1,236,580 | 451,713 |
| Mode M0 | |||
|---|---|---|---|
| Quadrant | BADHDUFLAG | Total packets | Discarded packets |
| A | 0 | 44239 | 0 |
| B | 0 | 66263 | 0 |
| C | 0 | 67994 | 0 |
| D | 0 | 58756 | 0 |
| Mode SS | |||
|---|---|---|---|
| Quadrant | BADHDUFLAG | Total packets | Discarded packets |
| A | 0 | 428 | 0 |
| B | 0 | 430 | 0 |
| C | 0 | 432 | 0 |
| D | 0 | 430 | 0 |
| Mode M9 | |||
|---|---|---|---|
| Quadrant | BADHDUFLAG | Total packets | Discarded packets |
| A | 0 | 44 | 0 |
| B | 0 | 44 | 0 |
| C | 0 | 44 | 0 |
| D | 0 | 44 | 0 |
| Quadrant | Total seconds | Saturated seconds | Saturation percentage |
|---|---|---|---|
| A | 21163 | 120 | 0.567027% |
| B | 21139 | 544 | 2.573442% |
| C | 21135 | 2552 | 12.074758% |
| D | 21152 | 443 | 2.094365% |
Noise dominated data is calculated using 1-second bins in cleaned event files. If a bin has >2000 counts, and if more than 50% of those come from <1% of pixels, then it is considered to be noise-dominated and hence unusable.
| Quadrant | # 1 sec bins | Bins with >0 counts | Bins with >2000 counts | High rate bins dominated by noise | Noise dominated (total time) | Noise dominated (detector-on time) | Marked lightcurve |
|---|---|---|---|---|---|---|---|
| A | 26774 | 21187 | 0 | 0 | 0.00% | 0.00% |  |
| B | 26773 | 21152 | 0 | 0 | 0.00% | 0.00% | 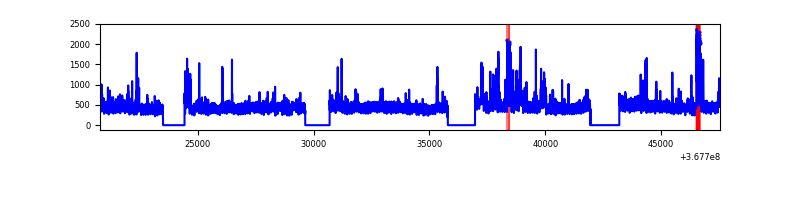 |
| C | 26774 | 21139 | 0 | 0 | 0.00% | 0.00% |  |
| D | 26774 | 21156 | 0 | 0 | 0.00% | 0.00% | 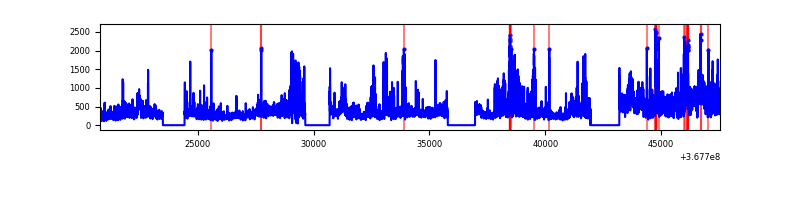 |
Top three noisy pixels from each quadrant. If the there are fewer than three noisy pixels in the level2.evt file, extra rows are filled as -1
| Pixel properties | Quadrant properties | ||||||
|---|---|---|---|---|---|---|---|
| Quadrant | DetID | PixID | Counts | Sigma | Mean | Median | Sigma |
| A | 0 | 29 | 1368 | 11.05 | 375 | 355 | 91.7 |
| A | 0 | 30 | 1078 | 7.89 | 375 | 355 | 91.7 |
| A | 9 | 19 | 1073 | 7.83 | 375 | 355 | 91.7 |
| B | 2 | 9 | 1158 | 11.16 | 357 | 342 | 73.1 |
| B | 3 | 80 | 923 | 7.94 | 357 | 342 | 73.1 |
| B | 5 | 128 | 917 | 7.86 | 357 | 342 | 73.1 |
| C | 1 | 80 | 965 | 6.92 | 356 | 337 | 90.7 |
| C | 1 | 81 | 956 | 6.82 | 356 | 337 | 90.7 |
| C | 3 | 187 | 953 | 6.79 | 356 | 337 | 90.7 |
| D | 7 | 3 | 940 | 6.5 | 354 | 323 | 94.9 |
| D | 10 | 189 | 915 | 6.24 | 354 | 323 | 94.9 |
| D | 15 | 47 | 911 | 6.2 | 354 | 323 | 94.9 |
Histogram calculated using DETX and DETY for each event in the final _common_clean file
| Quadrant A | 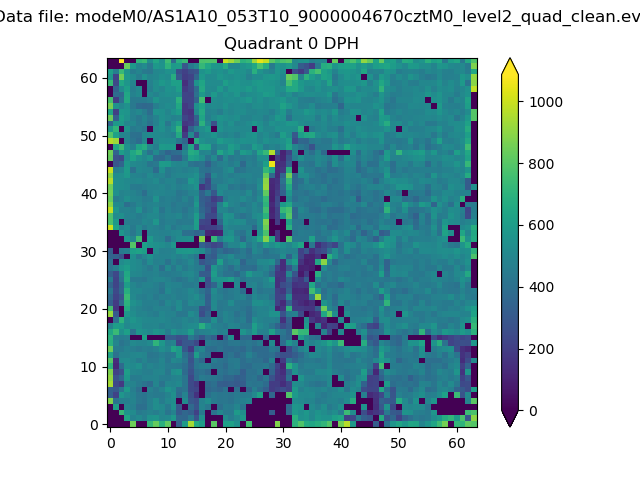 |
 |
Quadrant B |
|---|---|---|---|
| Quadrant D |  |
 |
Quadrant C |
| Plot type | Count rate plots | Images |
|---|---|---|
| Comparison with Poisson distribution Blue bars denote a histogram of data divided into 1 sec bins. Red curve is a Poisson curve with rate = median count rate of data. |
 |
 |
| Quadrant-wise count rates Data is divided into 100 sec bins |
 |
|
| Module-wise count rates for Quadrant A Data is divided into 100 sec bins |
 |
 |
| Module-wise count rates for Quadrant B Data is divided into 100 sec bins |
 |
 |
| Module-wise count rates for Quadrant C Data is divided into 100 sec bins |
 |
 |
| Module-wise count rates for Quadrant D Data is divided into 100 sec bins |
 |
 |
| Parameter | Plot |
|---|---|
| CZT HV Monitor |  |
| D_VDD |  |
| Temperature 1 | 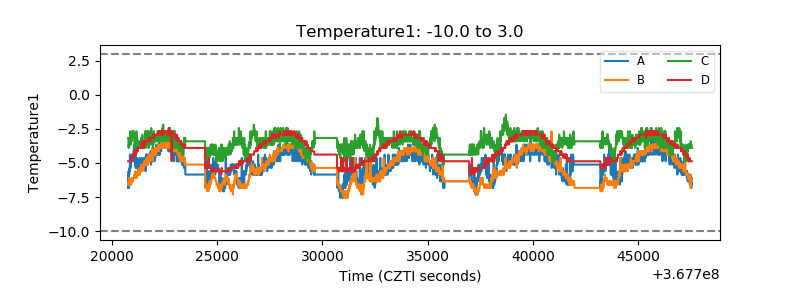 |
| Veto HV Monitor |  |
| Veto LLD |  |
| Alpha Counter |  |
| _CPM_Rate |  |
| CZT Counter | 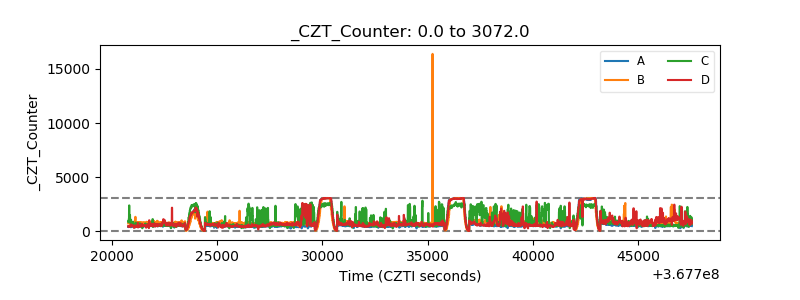 |
| +2.5 Volts monitor |  |
| +5 Volts monitor |  |
| _ROLL_ROT |  |
| _Roll_DEC |  |
| _Roll_RA |  |
| Veto Counter |  |