| Param | Original file | Final file |
|---|---|---|
| Filename | modeM0/AS1A10_053T10_9000004670_31971cztM0_level2.evt | modeM0/AS1A10_053T10_9000004670_31971cztM0_level2_quad_clean.evt |
| Size (bytes) | 834,505,920 | 120,576,960 |
| Size | 795.8 MB | 115.0 MB |
| Events in quadrant A | 4,492,782 | 770,861 |
| Events in quadrant B | 7,151,263 | 775,598 |
| Events in quadrant C | 7,174,407 | 732,458 |
| Events in quadrant D | 5,831,269 | 731,800 |
| Mode M0 | |||
|---|---|---|---|
| Quadrant | BADHDUFLAG | Total packets | Discarded packets |
| A | 0 | 18945 | 2 |
| B | 0 | 28184 | 2 |
| C | 0 | 27052 | 3 |
| D | 0 | 23406 | 2 |
| Mode SS | |||
|---|---|---|---|
| Quadrant | BADHDUFLAG | Total packets | Discarded packets |
| A | 0 | 188 | 0 |
| B | 0 | 188 | 0 |
| C | 0 | 188 | 0 |
| D | 0 | 188 | 0 |
| Mode M9 | |||
|---|---|---|---|
| Quadrant | BADHDUFLAG | Total packets | Discarded packets |
| A | 0 | 19 | 0 |
| B | 0 | 19 | 0 |
| C | 0 | 19 | 0 |
| D | 0 | 19 | 0 |
| Quadrant | Total seconds | Saturated seconds | Saturation percentage |
|---|---|---|---|
| A | 9237 | 27 | 0.292303% |
| B | 9237 | 149 | 1.613078% |
| C | 9236 | 848 | 9.181464% |
| D | 9236 | 231 | 2.501083% |
Noise dominated data is calculated using 1-second bins in cleaned event files. If a bin has >2000 counts, and if more than 50% of those come from <1% of pixels, then it is considered to be noise-dominated and hence unusable.
| Quadrant | # 1 sec bins | Bins with >0 counts | Bins with >2000 counts | High rate bins dominated by noise | Noise dominated (total time) | Noise dominated (detector-on time) | Marked lightcurve |
|---|---|---|---|---|---|---|---|
| A | 11227 | 9237 | 1 | 1 | 0.01% | 0.01% | 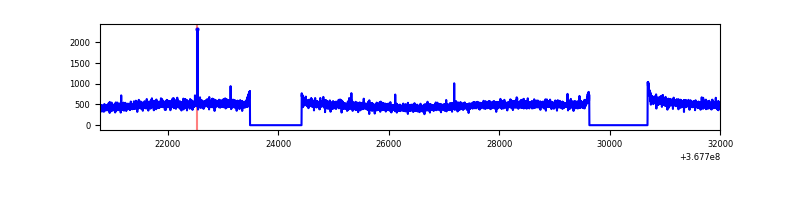 |
| B | 11227 | 9237 | 10 | 10 | 0.09% | 0.11% | 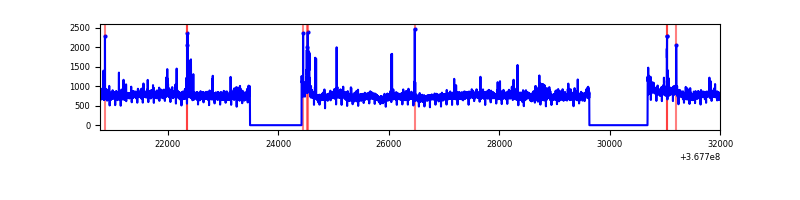 |
| C | 11225 | 9235 | 553 | 553 | 4.93% | 5.99% | 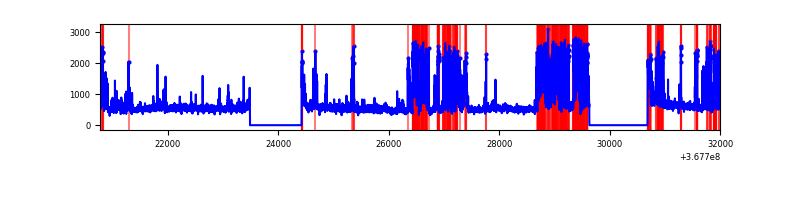 |
| D | 11226 | 9236 | 196 | 196 | 1.75% | 2.12% | 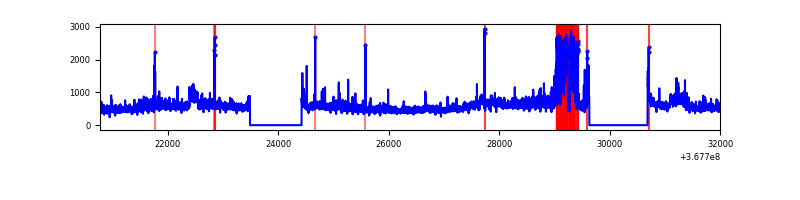 |
Top three noisy pixels from each quadrant. If the there are fewer than three noisy pixels in the level2.evt file, extra rows are filled as -1
| Pixel properties | Quadrant properties | ||||||
|---|---|---|---|---|---|---|---|
| Quadrant | DetID | PixID | Counts | Sigma | Mean | Median | Sigma |
| A | 13 | 254 | 16987 | 68.42 | 1162 | 1140 | 231.6 |
| A | 3 | 137 | 12073 | 47.2 | 1162 | 1140 | 231.6 |
| A | 0 | 226 | 9754 | 37.19 | 1162 | 1140 | 231.6 |
| B | 6 | 159 | 2407205 | 10873.43 | 1151 | 1119 | 221.3 |
| B | 10 | 245 | 140387 | 629.37 | 1151 | 1119 | 221.3 |
| B | 0 | 190 | 48471 | 213.99 | 1151 | 1119 | 221.3 |
| C | 0 | 10 | 2433813 | 9468.54 | 1102 | 1110 | 256.9 |
| C | 3 | 233 | 218042 | 844.34 | 1102 | 1110 | 256.9 |
| C | 14 | 238 | 181281 | 701.26 | 1102 | 1110 | 256.9 |
| D | 8 | 195 | 718152 | 2707.87 | 1122 | 1093 | 264.8 |
| D | 7 | 238 | 539934 | 2034.86 | 1122 | 1093 | 264.8 |
| D | 11 | 164 | 234677 | 882.1 | 1122 | 1093 | 264.8 |
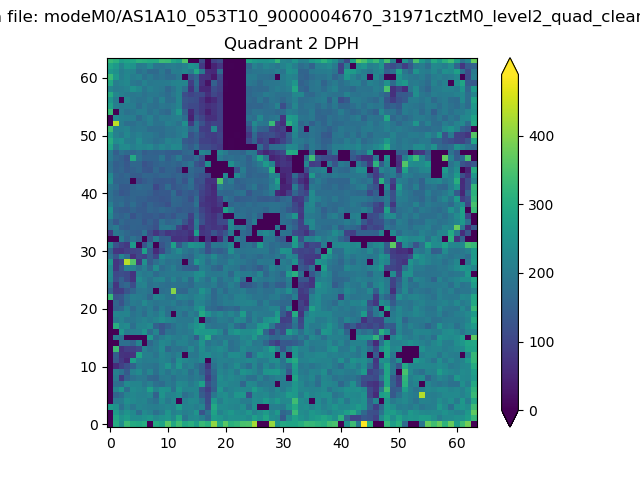
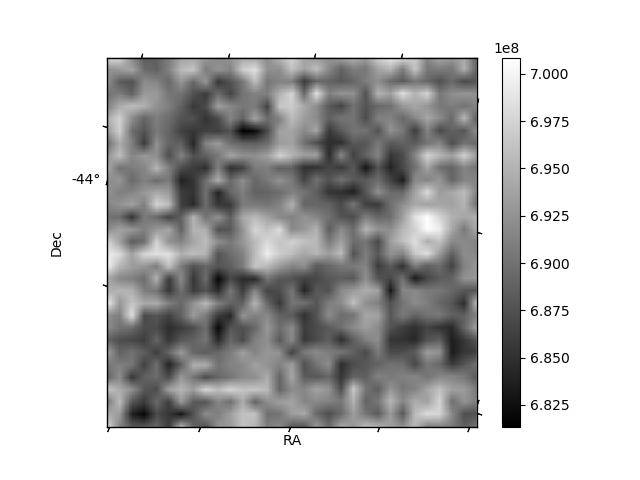
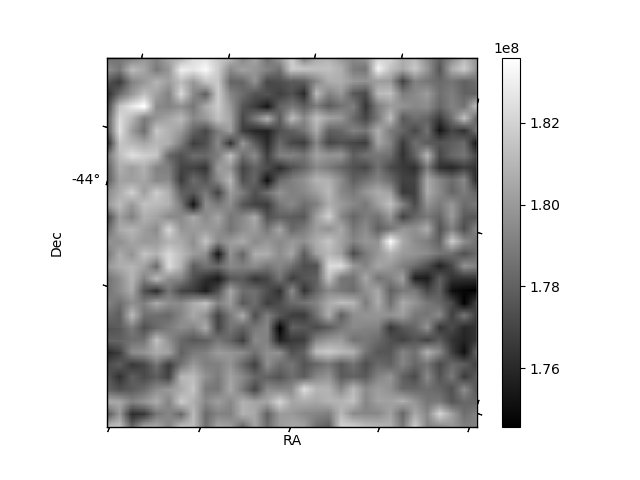
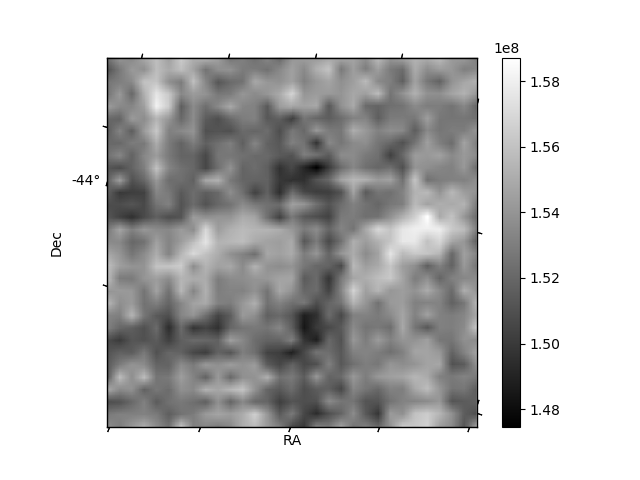
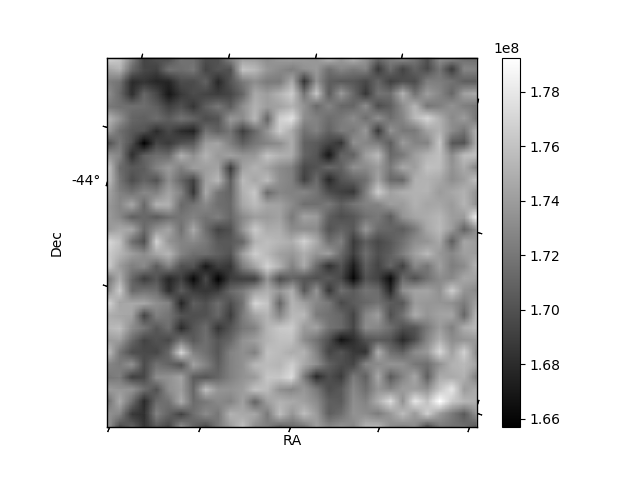
Histogram calculated using DETX and DETY for each event in the final _common_clean file
| Quadrant A | 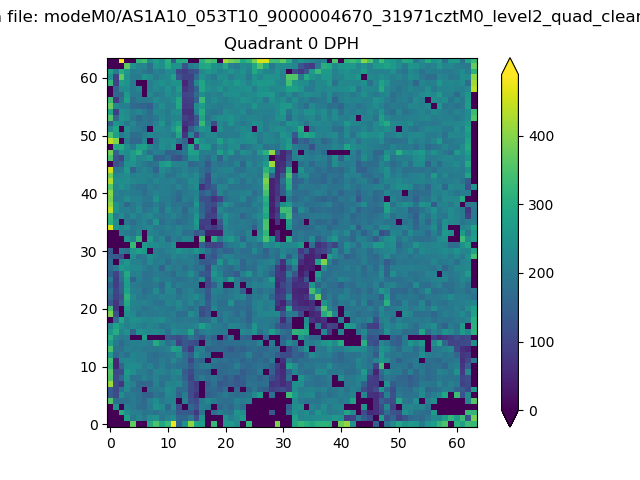 |
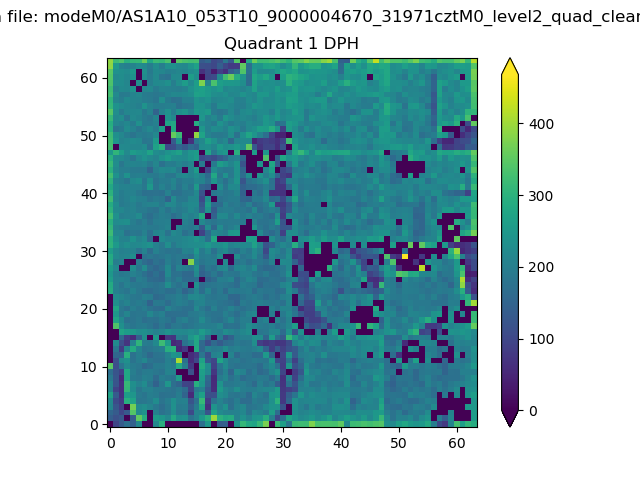 |
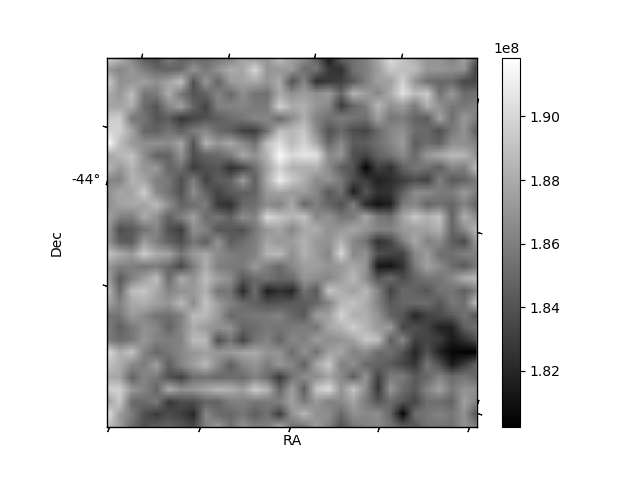
Quadrant B |
|---|---|---|---|
| Quadrant D | 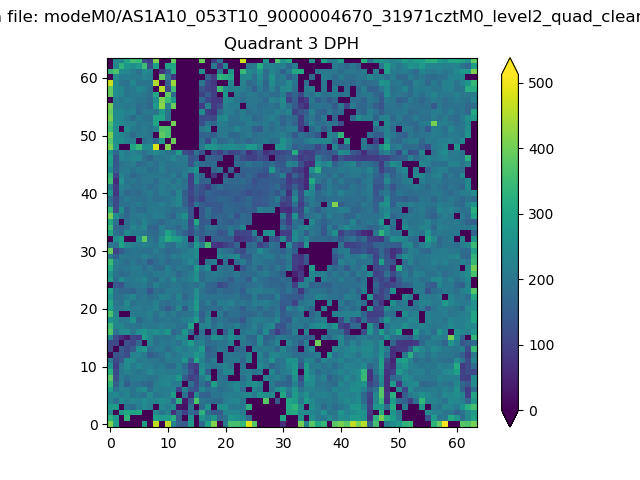 |
 |
Quadrant C |
| Plot type | Count rate plots | Images |
|---|---|---|
| Comparison with Poisson distribution Blue bars denote a histogram of data divided into 1 sec bins. Red curve is a Poisson curve with rate = median count rate of data. |
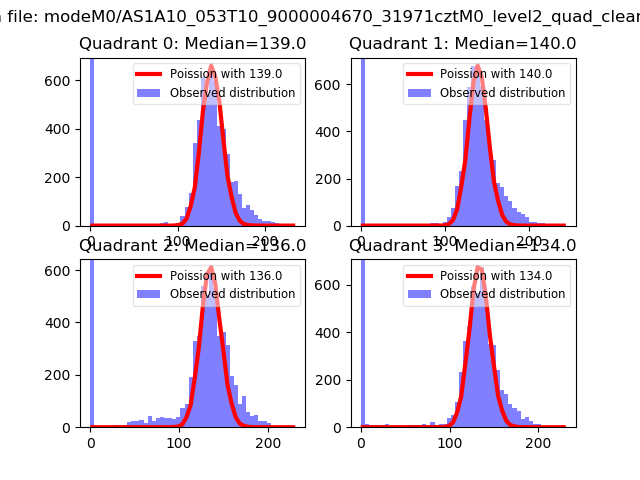 |
 |
| Quadrant-wise count rates Data is divided into 100 sec bins |
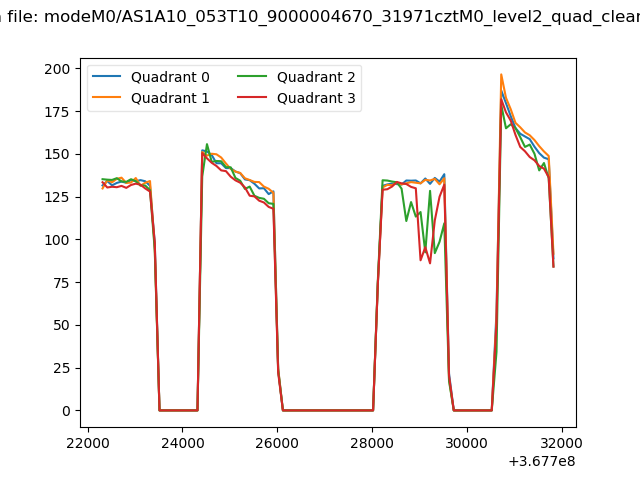 |
|
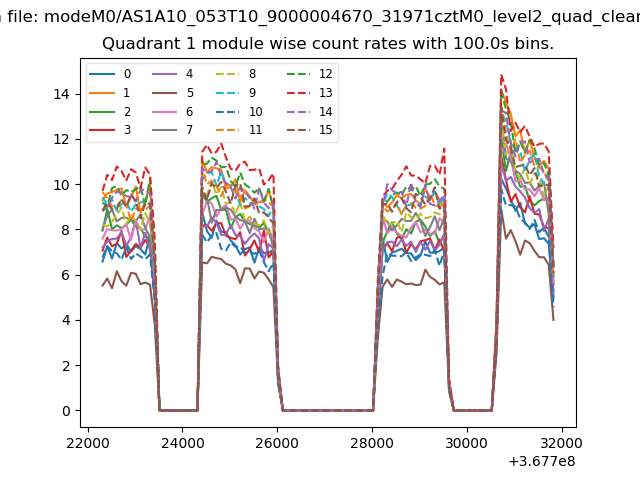
| Module-wise count rates for Quadrant A Data is divided into 100 sec bins |
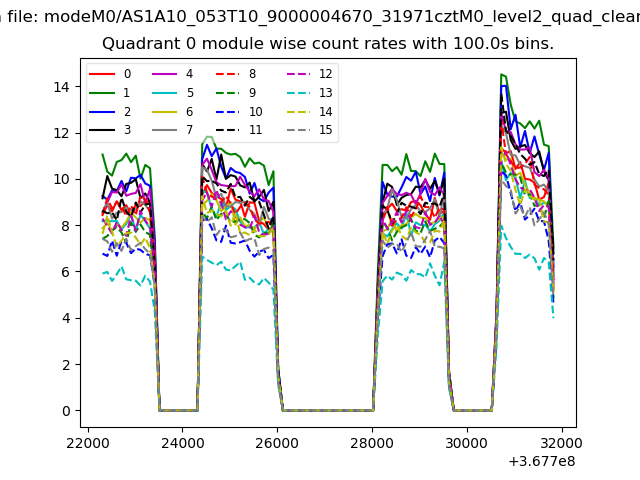 |
 |
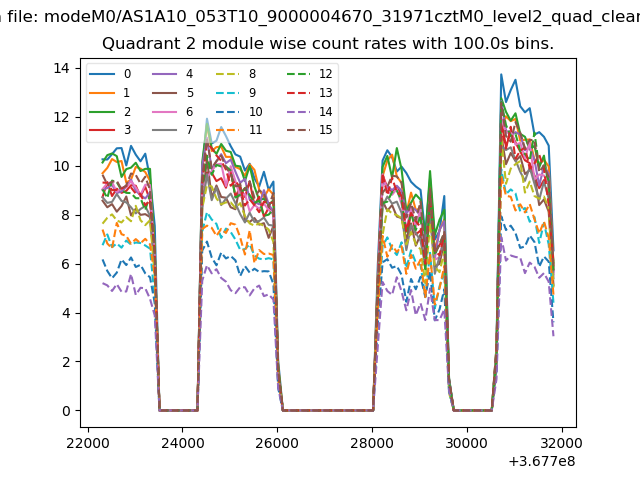
| Module-wise count rates for Quadrant B Data is divided into 100 sec bins |
 |
 |
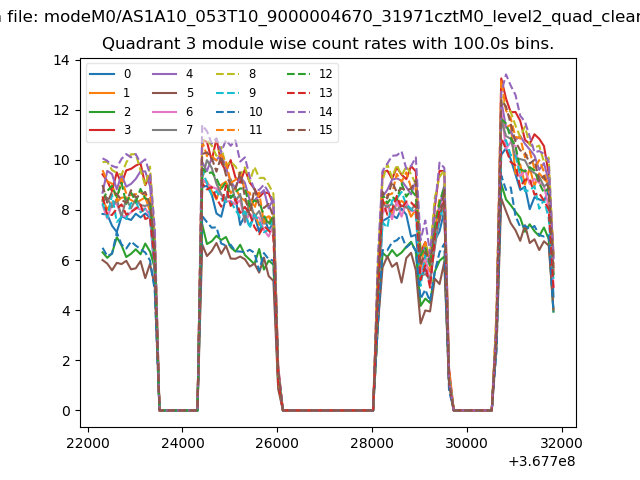
| Module-wise count rates for Quadrant C Data is divided into 100 sec bins |
 |
 |
| Module-wise count rates for Quadrant D Data is divided into 100 sec bins |
 |
 |
| Parameter | Plot |
|---|---|
| CZT HV Monitor | 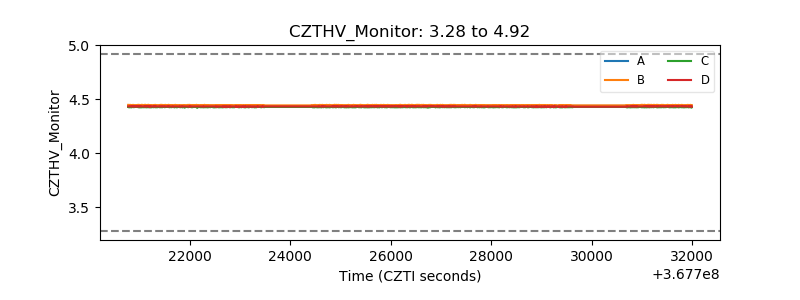 |
| D_VDD | 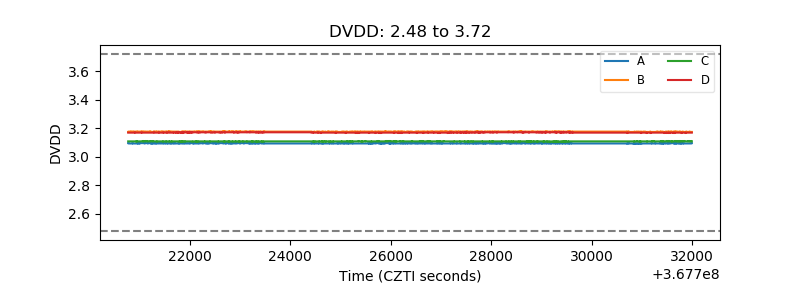 |
| Temperature 1 | 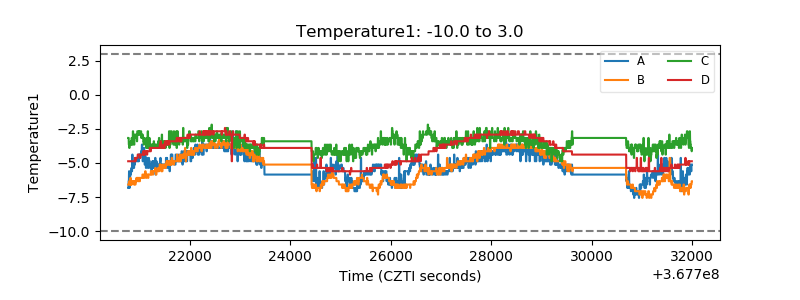 |
| Veto HV Monitor | 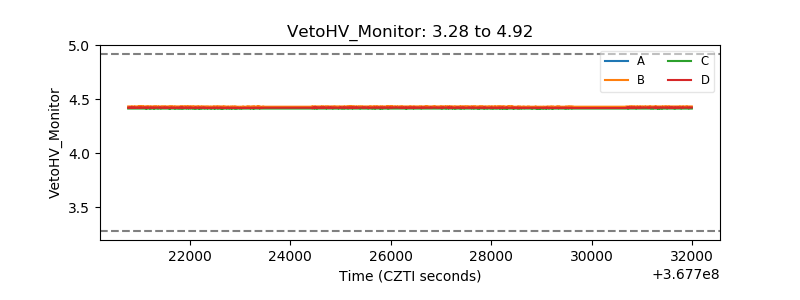 |
| Veto LLD | 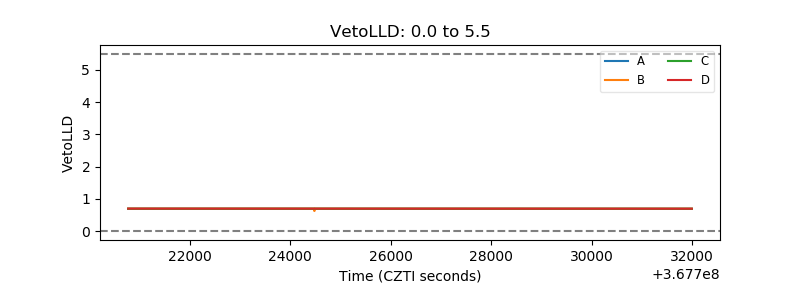 |
| Alpha Counter | 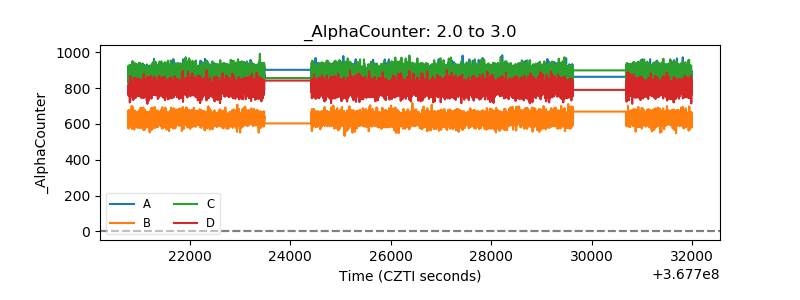 |
| _CPM_Rate | 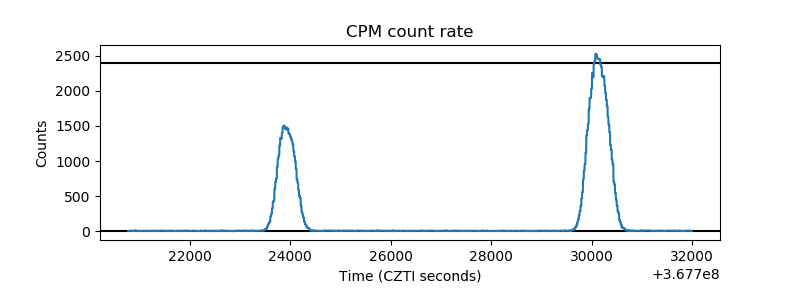 |
| CZT Counter | 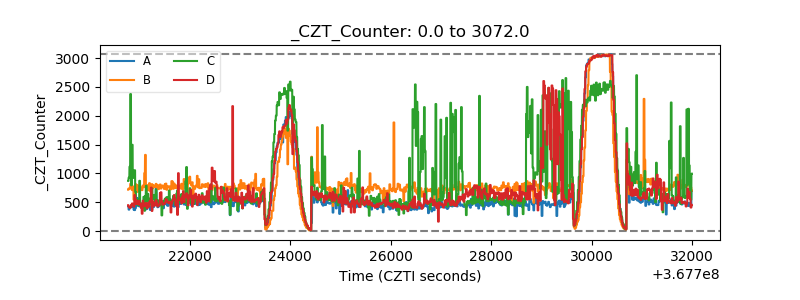 |
| +2.5 Volts monitor |  |
| +5 Volts monitor | 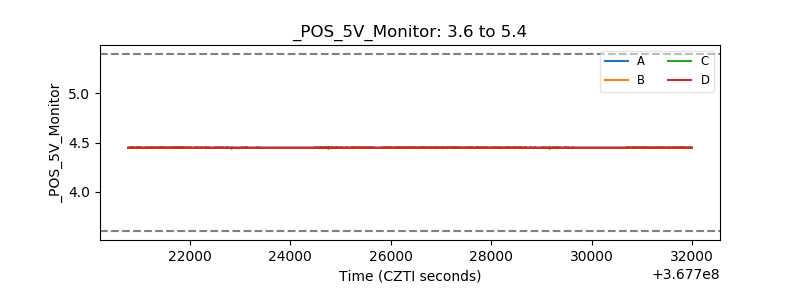 |
| _ROLL_ROT | 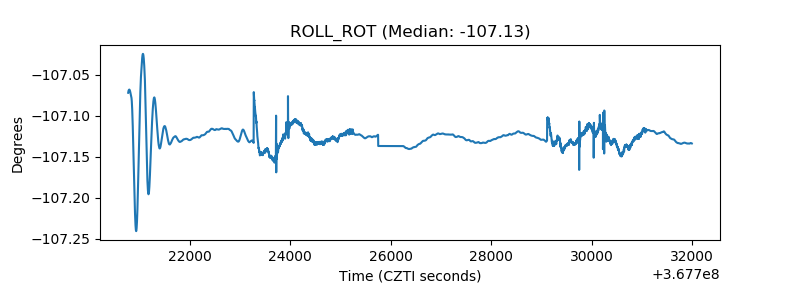 |
| _Roll_DEC | 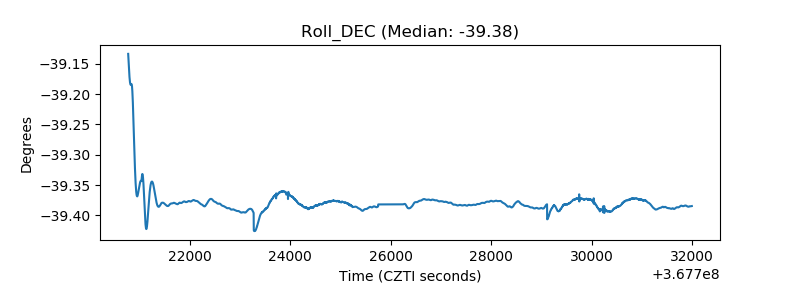 |
| _Roll_RA | 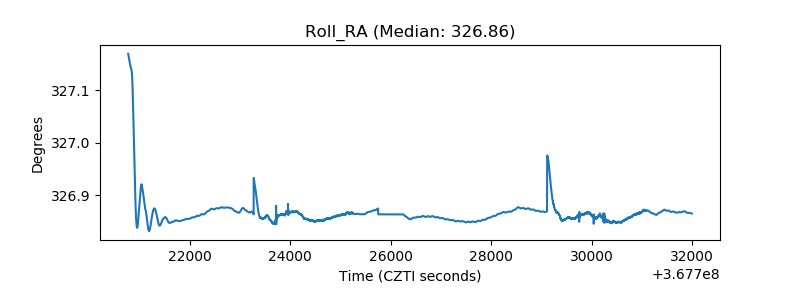 |
| Veto Counter | 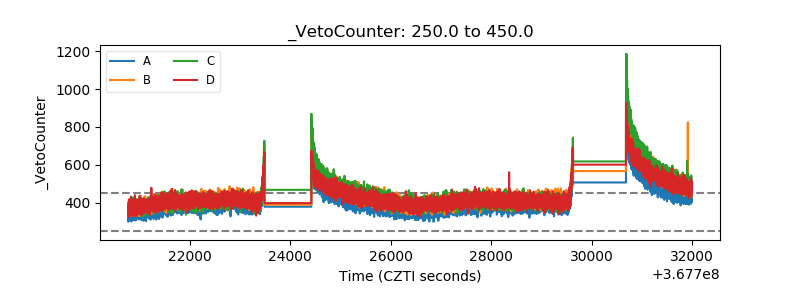 |