| Param | Original file | Final file |
|---|---|---|
| Filename | modeM0/AS1A10_053T10_9000004670_31973cztM0_level2.evt | modeM0/AS1A10_053T10_9000004670_31973cztM0_level2_quad_clean.evt |
| Size (bytes) | 517,132,800 | 64,733,760 |
| Size | 493.2 MB | 61.7 MB |
| Events in quadrant A | 2,657,405 | 418,693 |
| Events in quadrant B | 4,172,065 | 423,219 |
| Events in quadrant C | 5,134,370 | 357,997 |
| Events in quadrant D | 3,350,403 | 400,494 |
| Mode M0 | |||
|---|---|---|---|
| Quadrant | BADHDUFLAG | Total packets | Discarded packets |
| A | 0 | 11926 | 865 |
| B | 0 | 17307 | 1347 |
| C | 0 | 20365 | 1597 |
| D | 0 | 14477 | 1134 |
| Mode SS | |||
|---|---|---|---|
| Quadrant | BADHDUFLAG | Total packets | Discarded packets |
| A | 0 | 112 | 10 |
| B | 0 | 112 | 8 |
| C | 0 | 113 | 7 |
| D | 0 | 114 | 10 |
| Mode M9 | |||
|---|---|---|---|
| Quadrant | BADHDUFLAG | Total packets | Discarded packets |
| A | 0 | 12 | 0 |
| B | 0 | 22 | 9 |
| C | 0 | 15 | 2 |
| D | 0 | 13 | 1 |
| Quadrant | Total seconds | Saturated seconds | Saturation percentage |
|---|---|---|---|
| A | 5148 | 32 | 0.621601% |
| B | 5121 | 106 | 2.069908% |
| C | 5112 | 922 | 18.035994% |
| D | 5132 | 71 | 1.383476% |
Noise dominated data is calculated using 1-second bins in cleaned event files. If a bin has >2000 counts, and if more than 50% of those come from <1% of pixels, then it is considered to be noise-dominated and hence unusable.
| Quadrant | # 1 sec bins | Bins with >0 counts | Bins with >2000 counts | High rate bins dominated by noise | Noise dominated (total time) | Noise dominated (detector-on time) | Marked lightcurve |
|---|---|---|---|---|---|---|---|
| A | 7532 | 5187 | 0 | 0 | 0.00% | 0.00% | 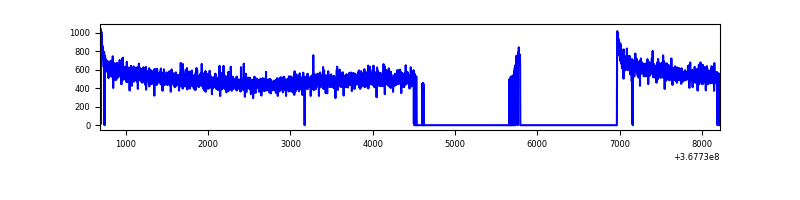 |
| B | 7530 | 5151 | 14 | 14 | 0.19% | 0.27% | 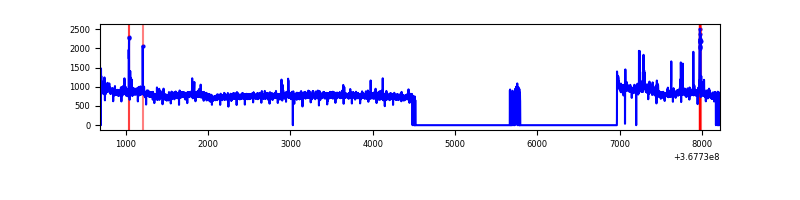 |
| C | 7524 | 5136 | 574 | 574 | 7.63% | 11.18% | 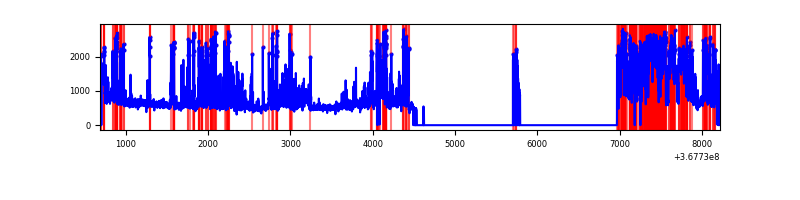 |
| D | 7528 | 5166 | 23 | 23 | 0.31% | 0.45% | 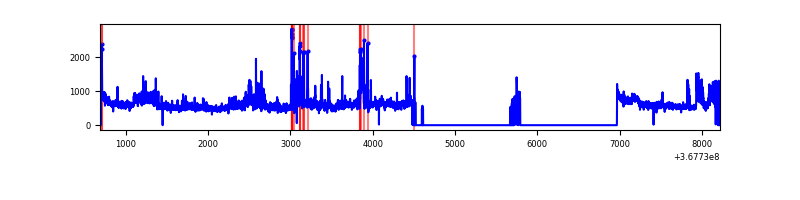 |
Top three noisy pixels from each quadrant. If the there are fewer than three noisy pixels in the level2.evt file, extra rows are filled as -1
| Pixel properties | Quadrant properties | ||||||
|---|---|---|---|---|---|---|---|
| Quadrant | DetID | PixID | Counts | Sigma | Mean | Median | Sigma |
| A | 13 | 254 | 7776 | 52.03 | 688 | 677 | 136.4 |
| A | 3 | 137 | 6410 | 42.02 | 688 | 677 | 136.4 |
| A | 0 | 226 | 5692 | 36.76 | 688 | 677 | 136.4 |
| B | 6 | 159 | 1401124 | 10989.54 | 682 | 667 | 127.4 |
| B | 10 | 245 | 72446 | 563.26 | 682 | 667 | 127.4 |
| B | 12 | 111 | 15233 | 114.3 | 682 | 667 | 127.4 |
| C | 0 | 10 | 2423205 | 16314.41 | 637 | 643 | 148.5 |
| C | 3 | 233 | 106634 | 713.78 | 637 | 643 | 148.5 |
| C | 14 | 238 | 103166 | 690.43 | 637 | 643 | 148.5 |
| D | 11 | 164 | 290440 | 1802.22 | 680 | 665 | 160.8 |
| D | 8 | 195 | 258765 | 1605.22 | 680 | 665 | 160.8 |
| D | 12 | 218 | 203285 | 1260.17 | 680 | 665 | 160.8 |
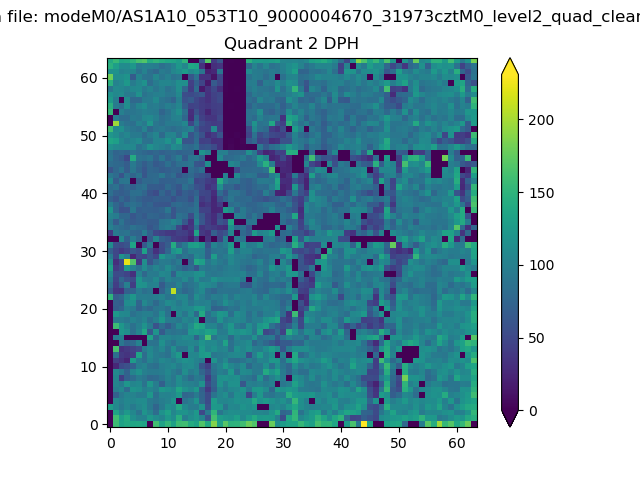
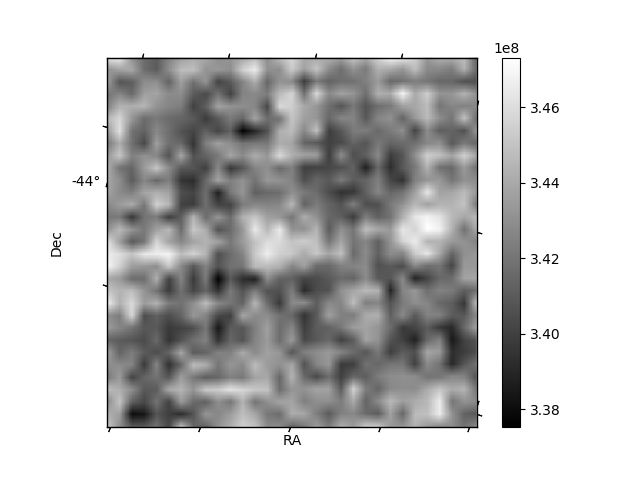
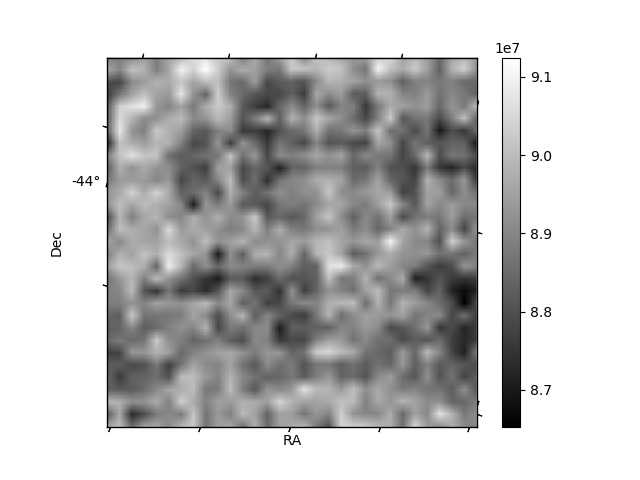
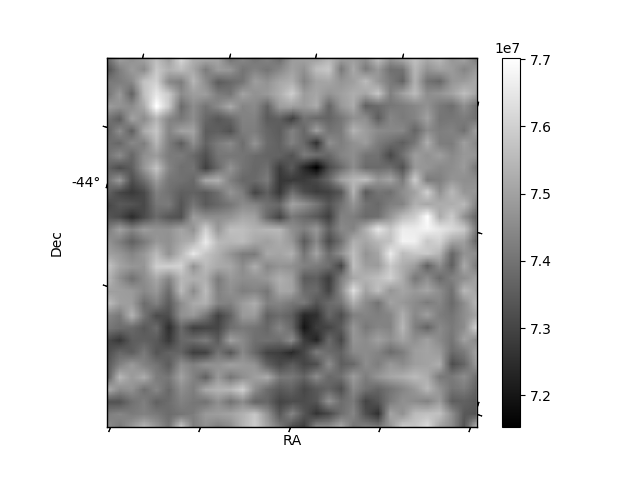
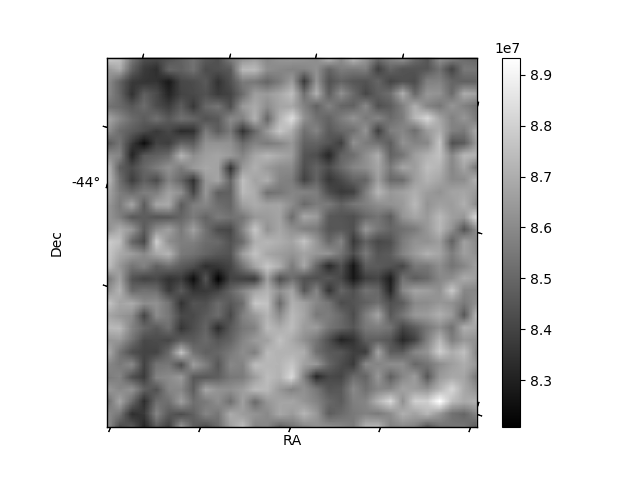
Histogram calculated using DETX and DETY for each event in the final _common_clean file
| Quadrant A | 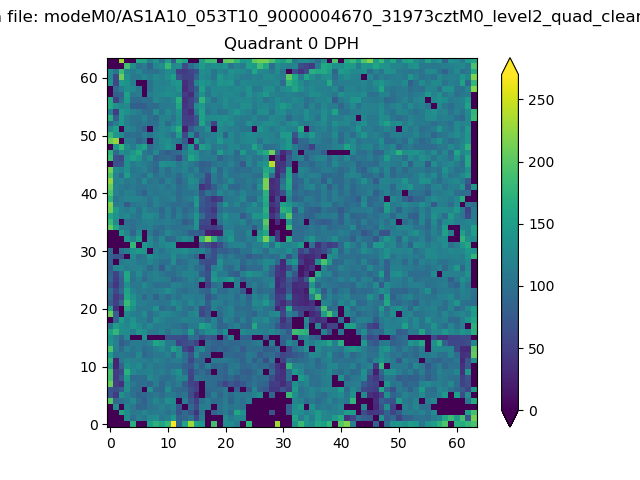 |
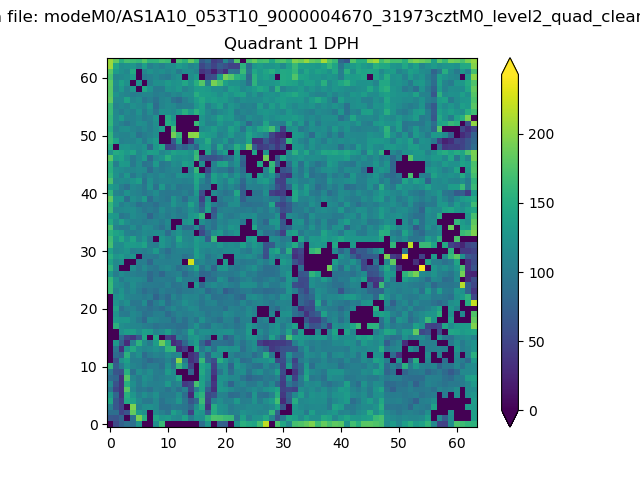 |
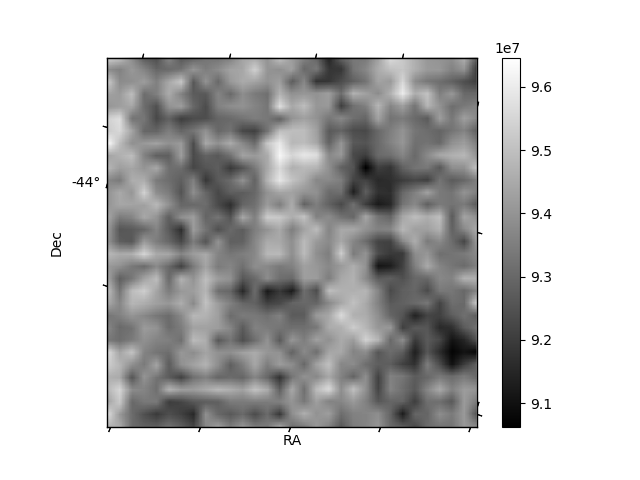
Quadrant B |
|---|---|---|---|
| Quadrant D | 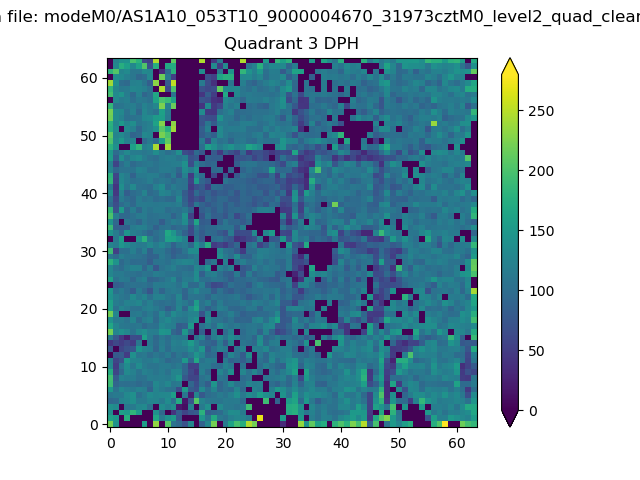 |
 |
Quadrant C |
| Plot type | Count rate plots | Images |
|---|---|---|
| Comparison with Poisson distribution Blue bars denote a histogram of data divided into 1 sec bins. Red curve is a Poisson curve with rate = median count rate of data. |
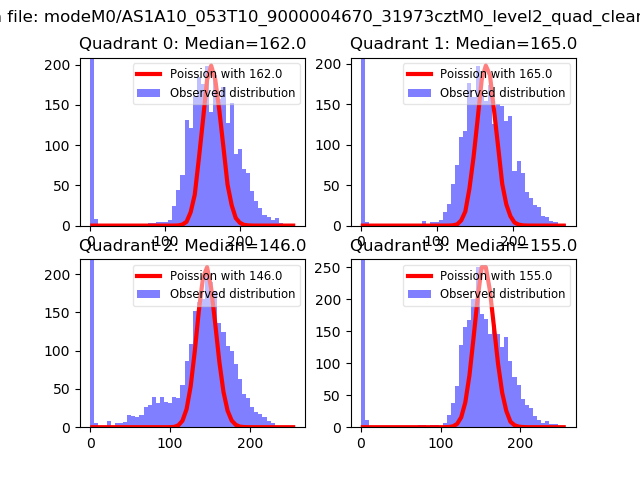 |
 |
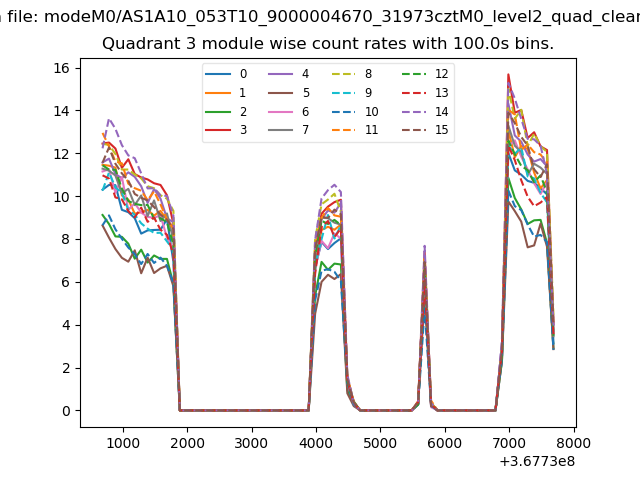
| Quadrant-wise count rates Data is divided into 100 sec bins |
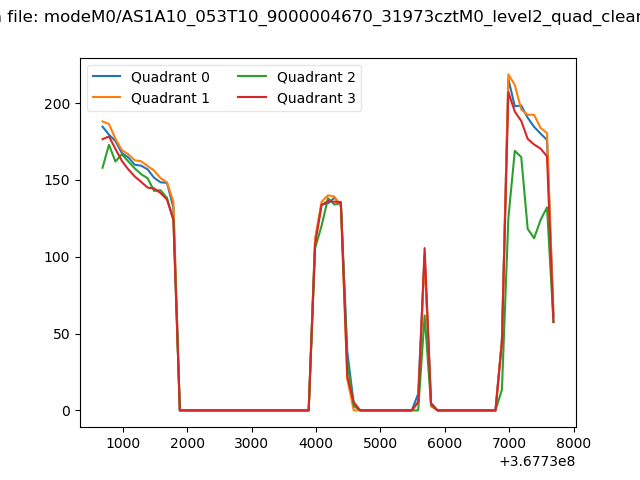 |
|
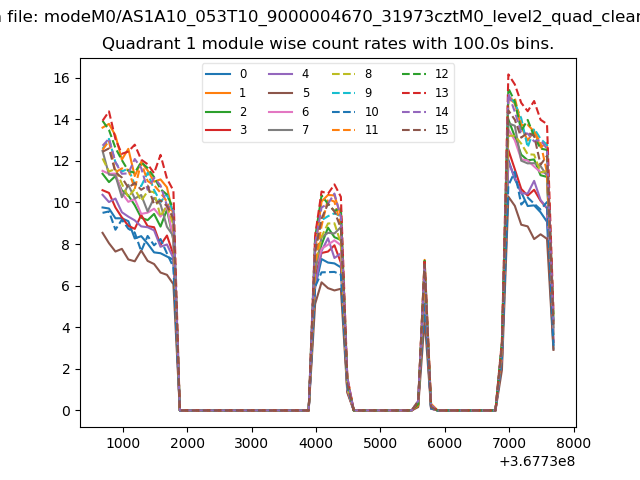
| Module-wise count rates for Quadrant A Data is divided into 100 sec bins |
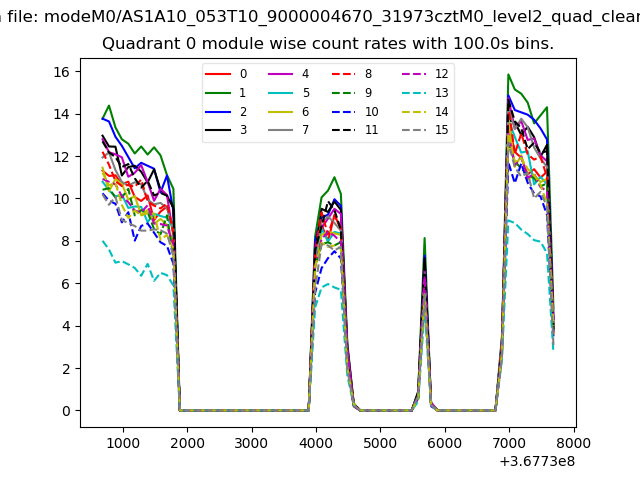 |
 |
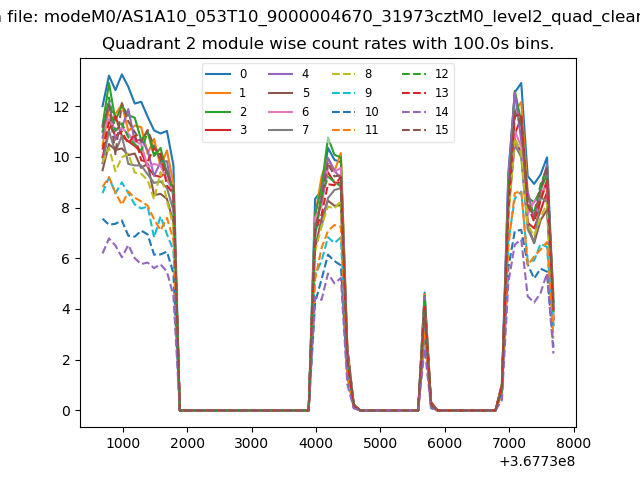
| Module-wise count rates for Quadrant B Data is divided into 100 sec bins |
 |
 |
| Module-wise count rates for Quadrant C Data is divided into 100 sec bins |
 |
 |
| Module-wise count rates for Quadrant D Data is divided into 100 sec bins |
 |
 |
| Parameter | Plot |
|---|---|
| CZT HV Monitor | 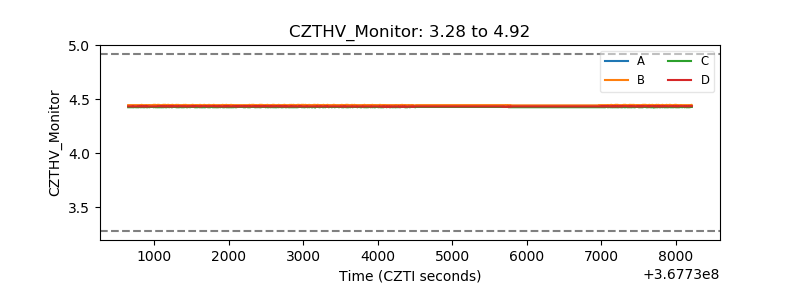 |
| D_VDD | 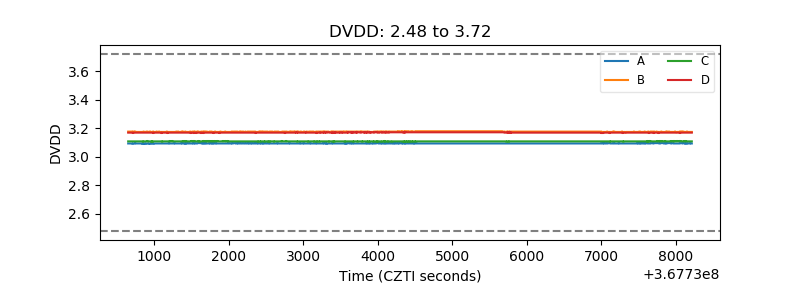 |
| Temperature 1 | 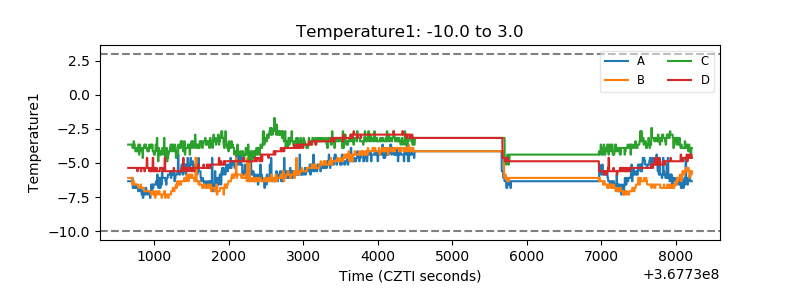 |
| Veto HV Monitor | 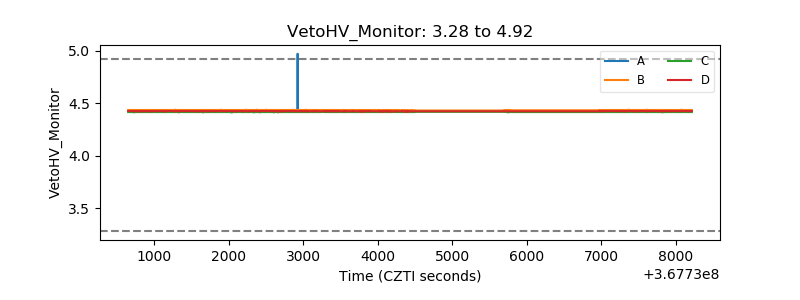 |
| Veto LLD | 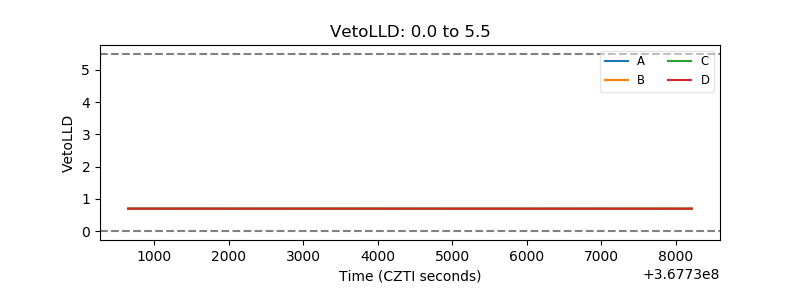 |
| Alpha Counter | 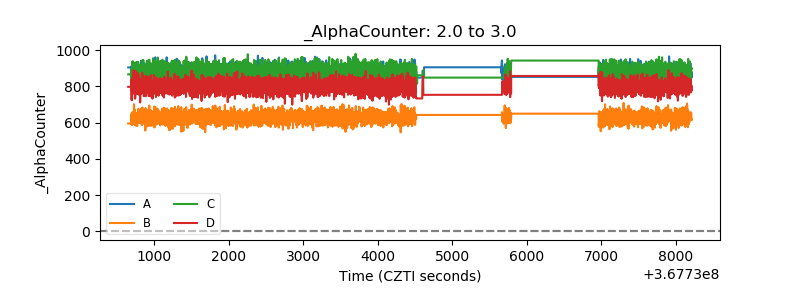 |
| _CPM_Rate | 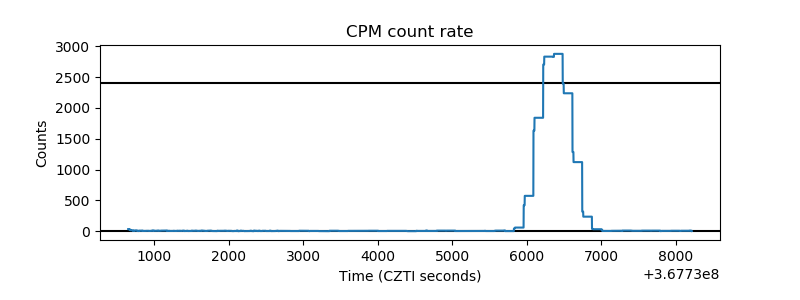 |
| CZT Counter | 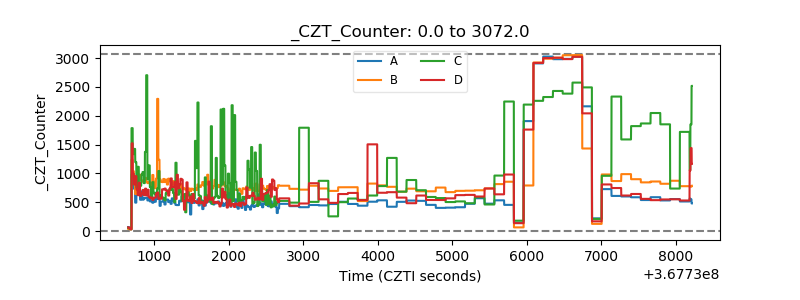 |
| +2.5 Volts monitor | 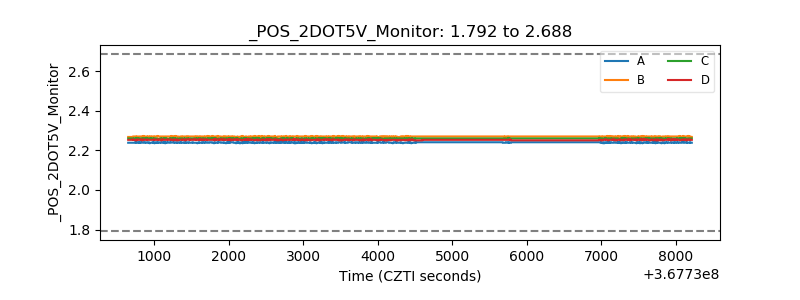 |
| +5 Volts monitor | 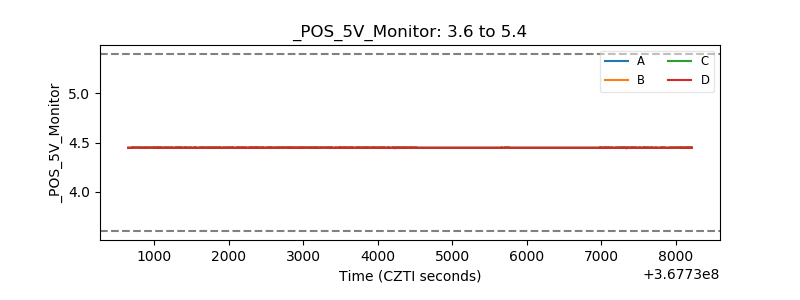 |
| _ROLL_ROT | 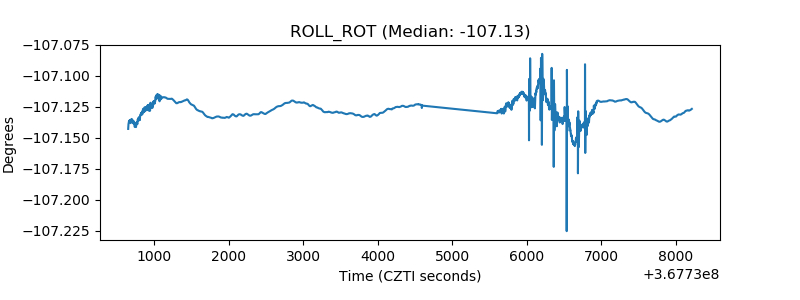 |
| _Roll_DEC | 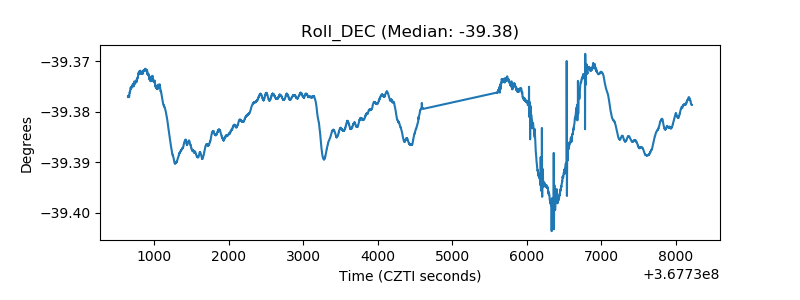 |
| _Roll_RA | 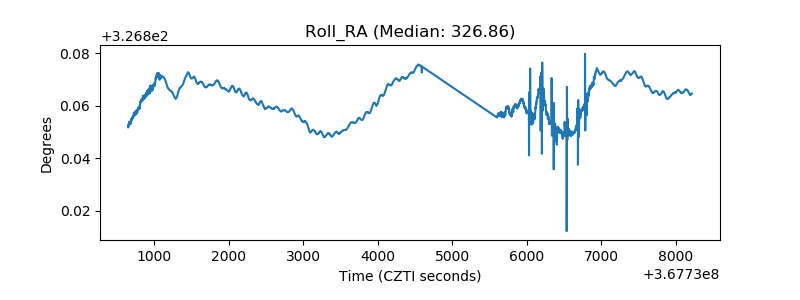 |
| Veto Counter | 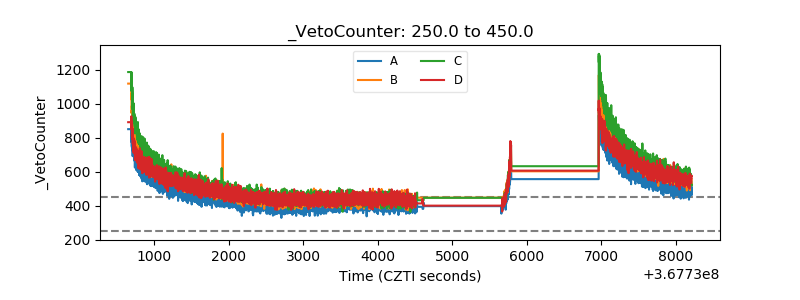 |