| Param | Original file | Final file |
|---|---|---|
| Filename | modeM0/AS1A10_053T10_9000004670_31974cztM0_level2.evt | modeM0/AS1A10_053T10_9000004670_31974cztM0_level2_quad_clean.evt |
| Size (bytes) | 1,081,293,120 | 125,585,280 |
| Size | 1.0 GB | 119.8 MB |
| Events in quadrant A | 5,419,904 | 792,996 |
| Events in quadrant B | 8,677,144 | 803,620 |
| Events in quadrant C | 10,630,809 | 707,105 |
| Events in quadrant D | 7,312,563 | 771,927 |
| Mode M0 | |||
|---|---|---|---|
| Quadrant | BADHDUFLAG | Total packets | Discarded packets |
| A | 0 | 22440 | 5 |
| B | 0 | 33202 | 2 |
| C | 0 | 38734 | 2 |
| D | 0 | 28709 | 2 |
| Mode SS | |||
|---|---|---|---|
| Quadrant | BADHDUFLAG | Total packets | Discarded packets |
| A | 0 | 214 | 0 |
| B | 0 | 214 | 0 |
| C | 0 | 214 | 0 |
| D | 0 | 214 | 0 |
| Mode M9 | |||
|---|---|---|---|
| Quadrant | BADHDUFLAG | Total packets | Discarded packets |
| A | 0 | 25 | 0 |
| B | 0 | 25 | 0 |
| C | 0 | 25 | 0 |
| D | 0 | 25 | 0 |
| Quadrant | Total seconds | Saturated seconds | Saturation percentage |
|---|---|---|---|
| A | 10503 | 94 | 0.894982% |
| B | 10505 | 297 | 2.827225% |
| C | 10505 | 1842 | 17.534507% |
| D | 10505 | 165 | 1.570681% |
Noise dominated data is calculated using 1-second bins in cleaned event files. If a bin has >2000 counts, and if more than 50% of those come from <1% of pixels, then it is considered to be noise-dominated and hence unusable.
| Quadrant | # 1 sec bins | Bins with >0 counts | Bins with >2000 counts | High rate bins dominated by noise | Noise dominated (total time) | Noise dominated (detector-on time) | Marked lightcurve |
|---|---|---|---|---|---|---|---|
| A | 12919 | 10504 | 0 | 0 | 0.00% | 0.00% | 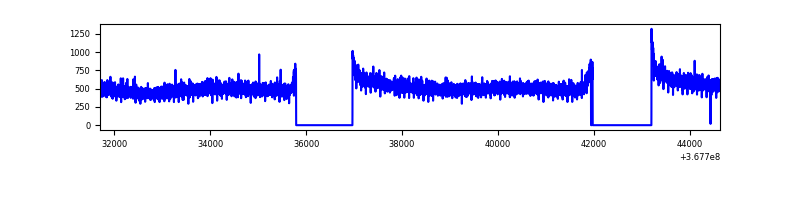 |
| B | 12920 | 10505 | 95 | 95 | 0.74% | 0.90% | 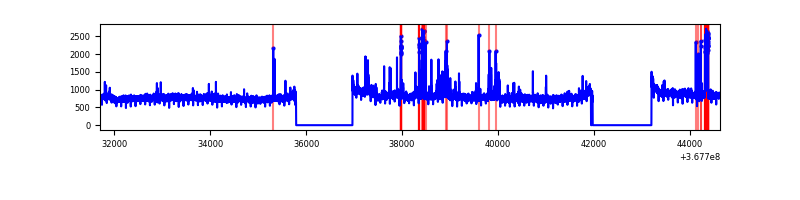 |
| C | 12920 | 10505 | 1188 | 1188 | 9.20% | 11.31% | 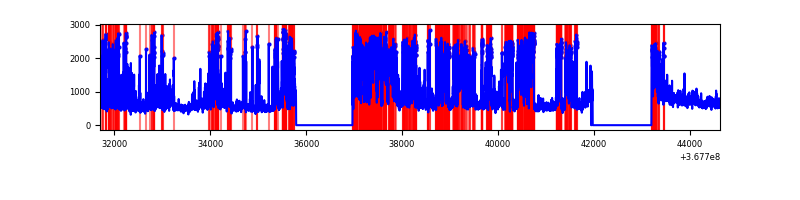 |
| D | 12920 | 10506 | 82 | 82 | 0.63% | 0.78% | 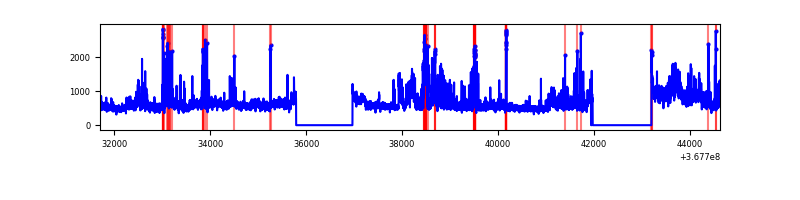 |
Top three noisy pixels from each quadrant. If the there are fewer than three noisy pixels in the level2.evt file, extra rows are filled as -1
| Pixel properties | Quadrant properties | ||||||
|---|---|---|---|---|---|---|---|
| Quadrant | DetID | PixID | Counts | Sigma | Mean | Median | Sigma |
| A | 13 | 254 | 15986 | 52.89 | 1404 | 1380 | 276.2 |
| A | 3 | 137 | 13552 | 44.08 | 1404 | 1380 | 276.2 |
| A | 0 | 226 | 11831 | 37.84 | 1404 | 1380 | 276.2 |
| B | 6 | 159 | 2783376 | 10817.48 | 1388 | 1358 | 257.2 |
| B | 10 | 245 | 403569 | 1563.94 | 1388 | 1358 | 257.2 |
| B | 12 | 111 | 31304 | 116.44 | 1388 | 1358 | 257.2 |
| C | 0 | 10 | 4908563 | 16380.14 | 1307 | 1320 | 299.6 |
| C | 3 | 233 | 338101 | 1124.16 | 1307 | 1320 | 299.6 |
| C | 14 | 238 | 216500 | 718.26 | 1307 | 1320 | 299.6 |
| D | 11 | 164 | 1172585 | 3631.31 | 1377 | 1347 | 322.5 |
| D | 8 | 195 | 318521 | 983.37 | 1377 | 1347 | 322.5 |
| D | 7 | 238 | 313545 | 967.94 | 1377 | 1347 | 322.5 |
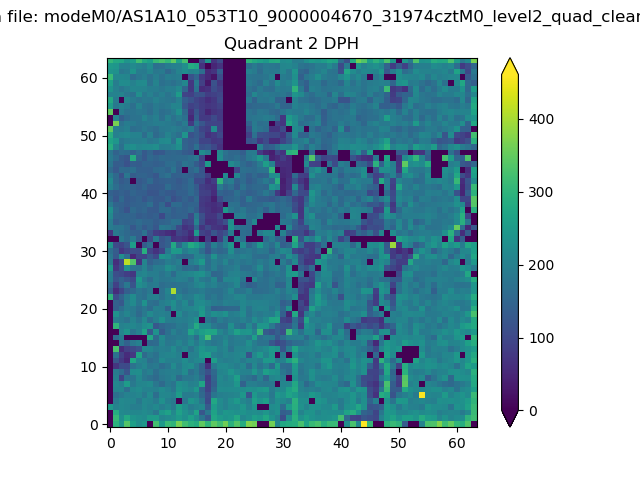
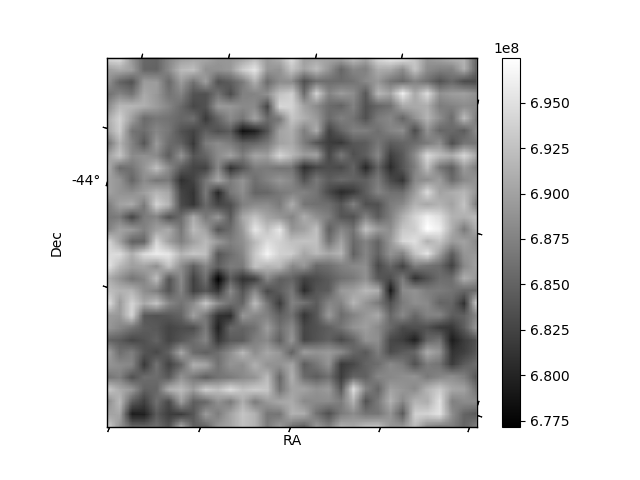
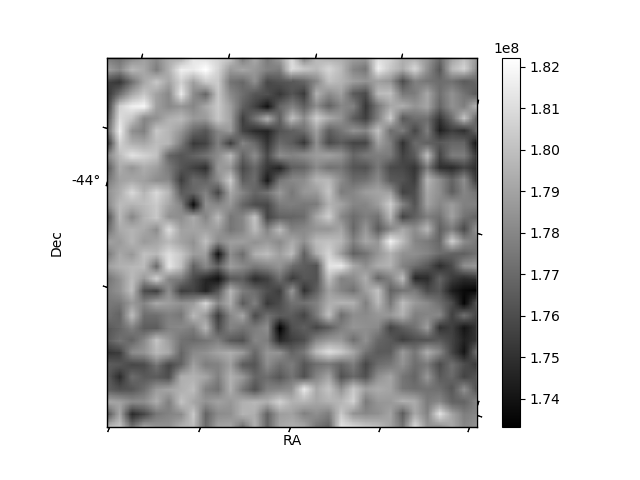
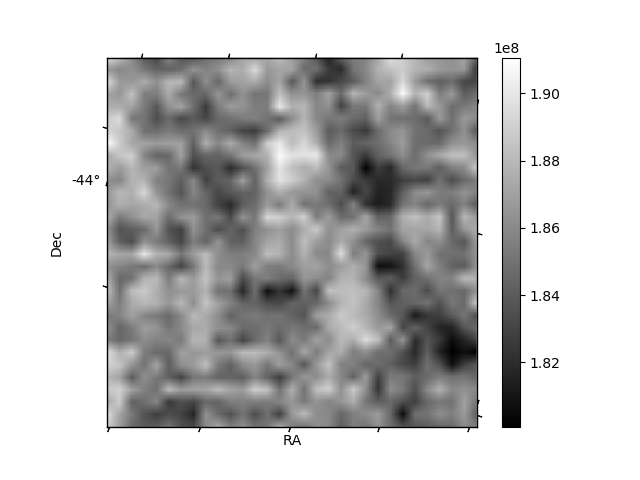
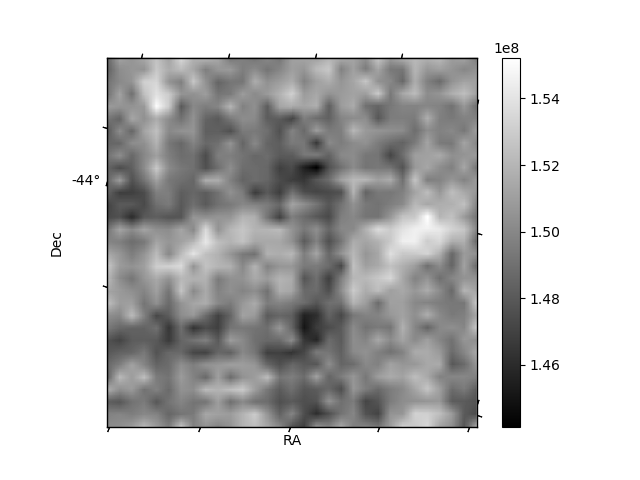
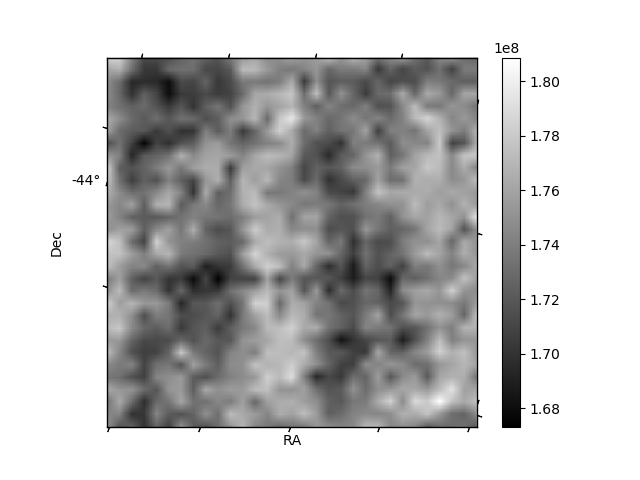
Histogram calculated using DETX and DETY for each event in the final _common_clean file
| Quadrant A | 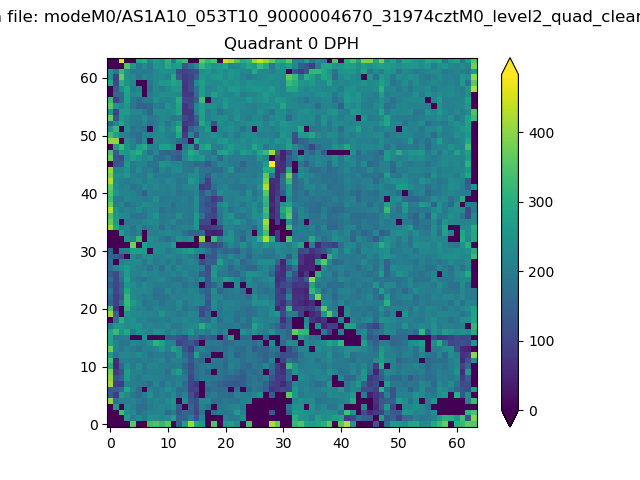 |
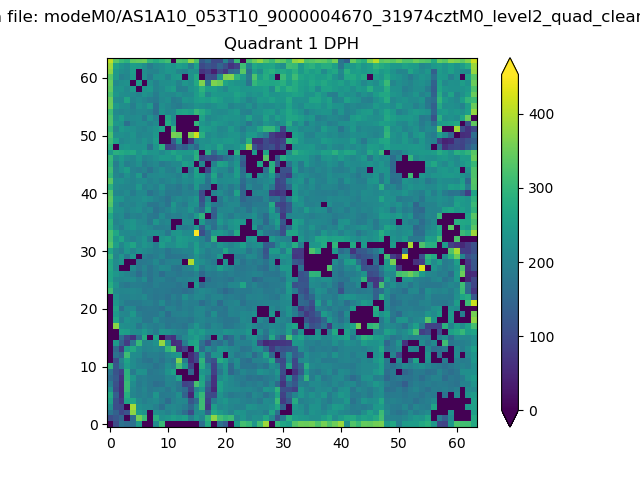 |
Quadrant B |
|---|---|---|---|
| Quadrant D | 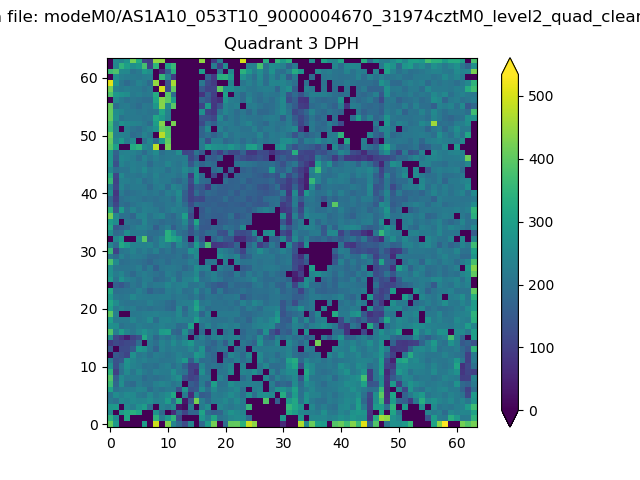 |
 |
Quadrant C |
| Plot type | Count rate plots | Images |
|---|---|---|
| Comparison with Poisson distribution Blue bars denote a histogram of data divided into 1 sec bins. Red curve is a Poisson curve with rate = median count rate of data. |
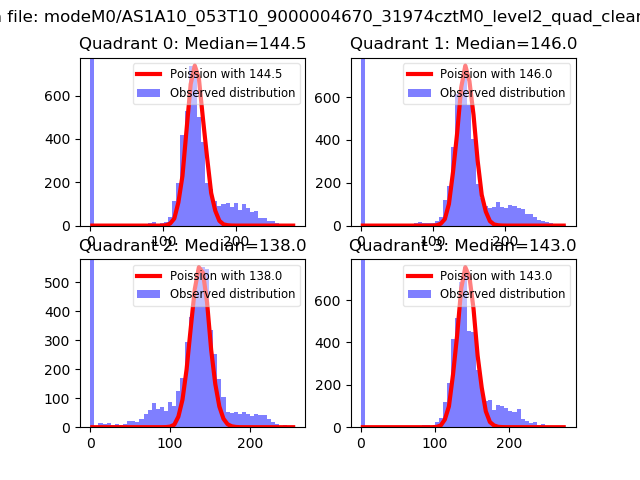 |
 |
| Quadrant-wise count rates Data is divided into 100 sec bins |
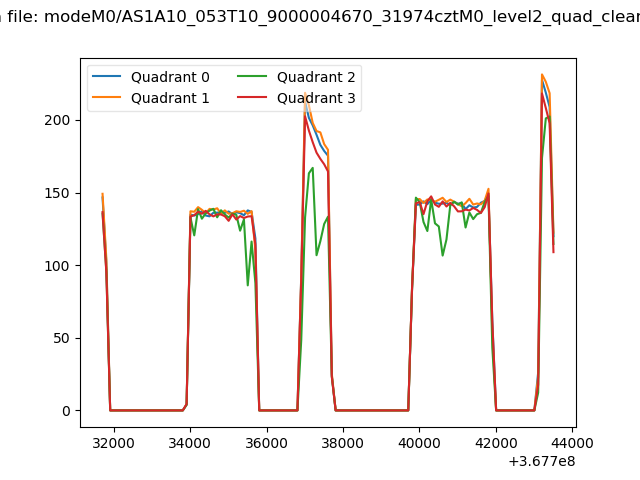 |
|
| Module-wise count rates for Quadrant A Data is divided into 100 sec bins |
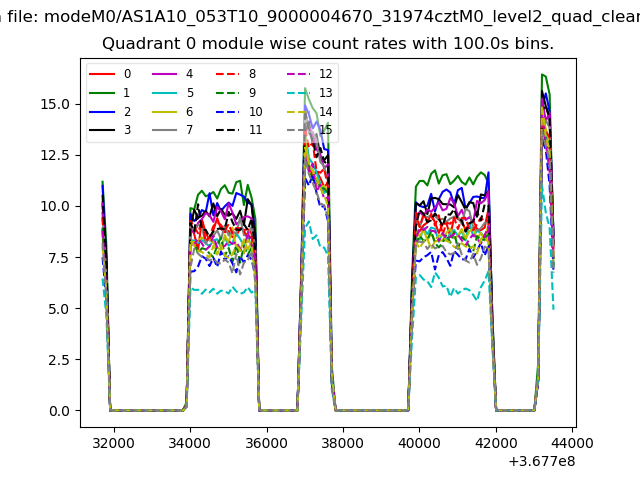 |
 |
| Module-wise count rates for Quadrant B Data is divided into 100 sec bins |
 |
 |
| Module-wise count rates for Quadrant C Data is divided into 100 sec bins |
 |
 |
| Module-wise count rates for Quadrant D Data is divided into 100 sec bins |
 |
 |
| Parameter | Plot |
|---|---|
| CZT HV Monitor | 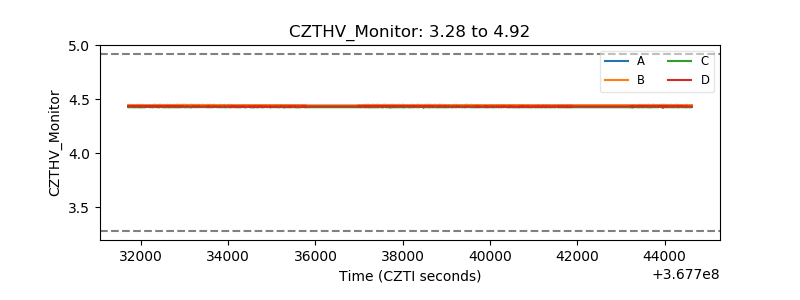 |
| D_VDD | 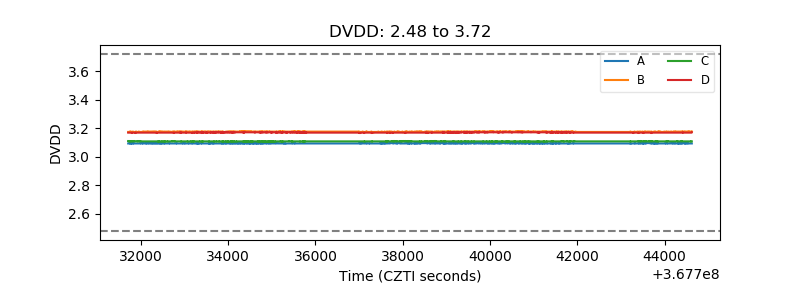 |
| Temperature 1 |  |
| Veto HV Monitor | 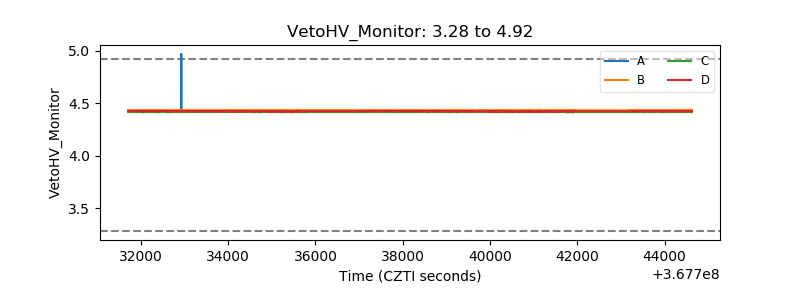 |
| Veto LLD |  |
| Alpha Counter | 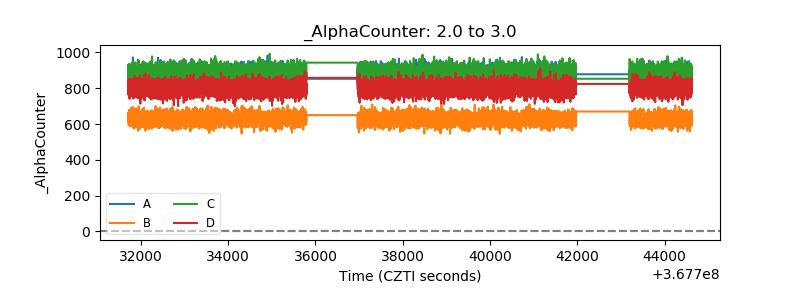 |
| _CPM_Rate | 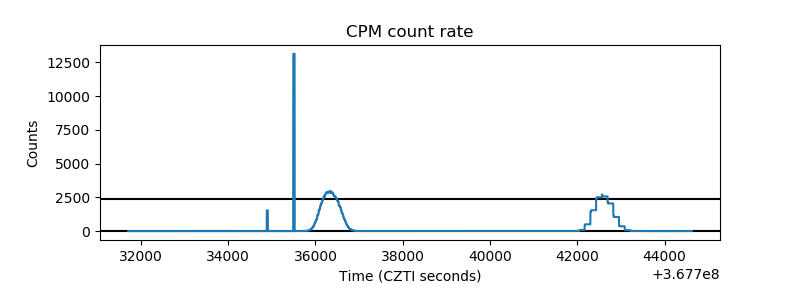 |
| CZT Counter | 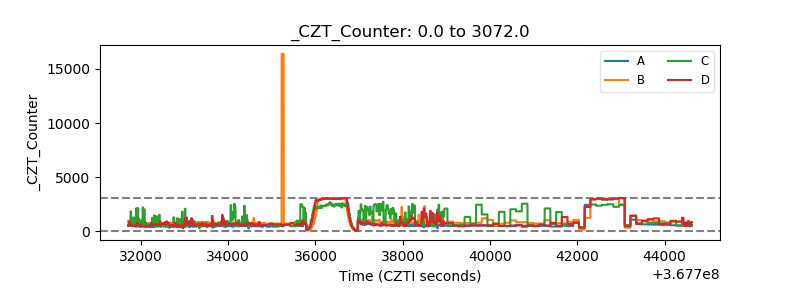 |
| +2.5 Volts monitor |  |
| +5 Volts monitor |  |
| _ROLL_ROT | 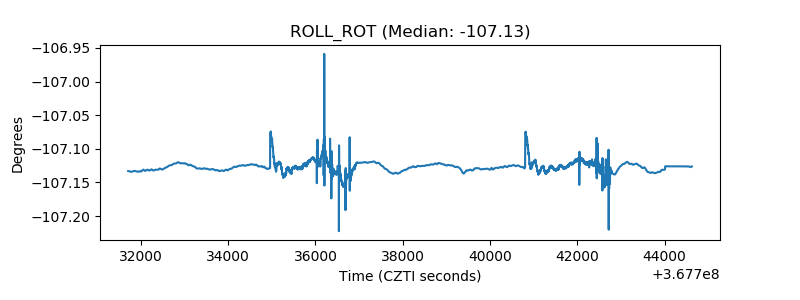 |
| _Roll_DEC | 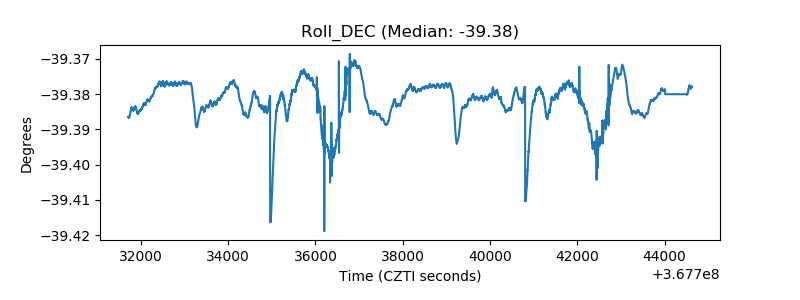 |
| _Roll_RA | 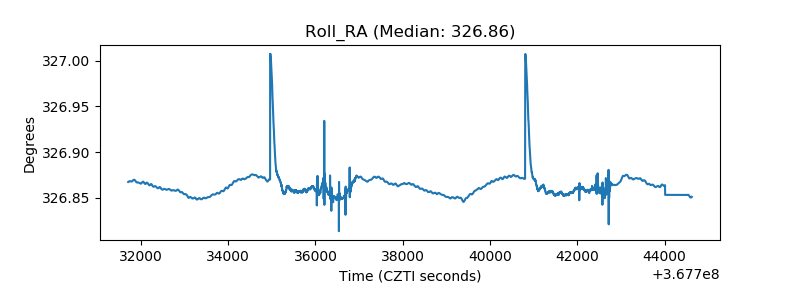 |
| Veto Counter | 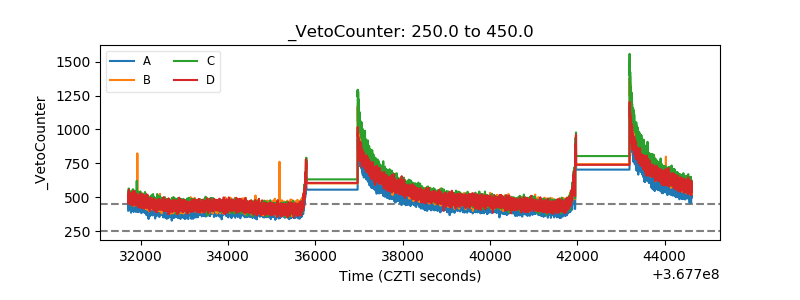 |