| Param | Original file | Final file |
|---|---|---|
| Filename | modeM0/AS1A10_053T10_9000004670_31975cztM0_level2.evt | modeM0/AS1A10_053T10_9000004670_31975cztM0_level2_quad_clean.evt |
| Size (bytes) | 1,371,798,720 | 168,039,360 |
| Size | 1.3 GB | 160.3 MB |
| Events in quadrant A | 6,892,081 | 1,066,742 |
| Events in quadrant B | 11,163,202 | 1,073,810 |
| Events in quadrant C | 12,463,607 | 984,312 |
| Events in quadrant D | 10,124,324 | 1,036,892 |
| Mode M0 | |||
|---|---|---|---|
| Quadrant | BADHDUFLAG | Total packets | Discarded packets |
| A | 0 | 28327 | 2 |
| B | 0 | 42673 | 2 |
| C | 0 | 45891 | 2 |
| D | 0 | 39103 | 2 |
| Mode SS | |||
|---|---|---|---|
| Quadrant | BADHDUFLAG | Total packets | Discarded packets |
| A | 0 | 272 | 0 |
| B | 0 | 272 | 0 |
| C | 0 | 272 | 0 |
| D | 0 | 272 | 0 |
| Mode M9 | |||
|---|---|---|---|
| Quadrant | BADHDUFLAG | Total packets | Discarded packets |
| A | 0 | 25 | 0 |
| B | 0 | 25 | 0 |
| C | 0 | 25 | 0 |
| D | 0 | 25 | 0 |
| Quadrant | Total seconds | Saturated seconds | Saturation percentage |
|---|---|---|---|
| A | 13424 | 95 | 0.707688% |
| B | 13425 | 406 | 3.024209% |
| C | 13425 | 1891 | 14.085661% |
| D | 13425 | 216 | 1.608939% |
Noise dominated data is calculated using 1-second bins in cleaned event files. If a bin has >2000 counts, and if more than 50% of those come from <1% of pixels, then it is considered to be noise-dominated and hence unusable.
| Quadrant | # 1 sec bins | Bins with >0 counts | Bins with >2000 counts | High rate bins dominated by noise | Noise dominated (total time) | Noise dominated (detector-on time) | Marked lightcurve |
|---|---|---|---|---|---|---|---|
| A | 15839 | 13424 | 0 | 0 | 0.00% | 0.00% | 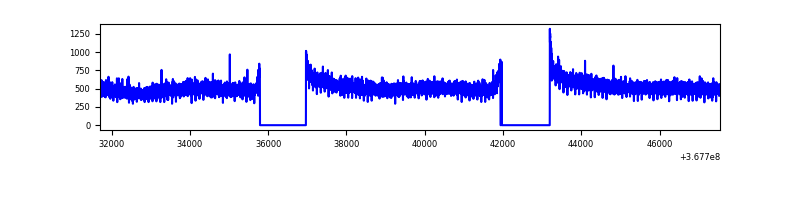 |
| B | 15840 | 13425 | 192 | 192 | 1.21% | 1.43% | 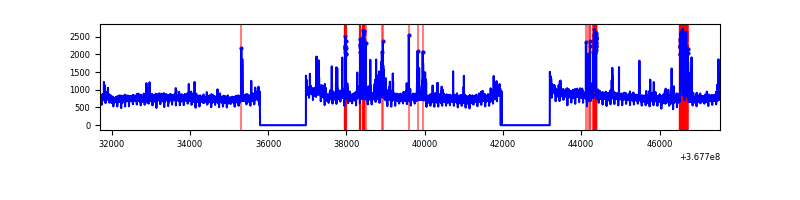 |
| C | 15840 | 13425 | 1218 | 1218 | 7.69% | 9.07% | 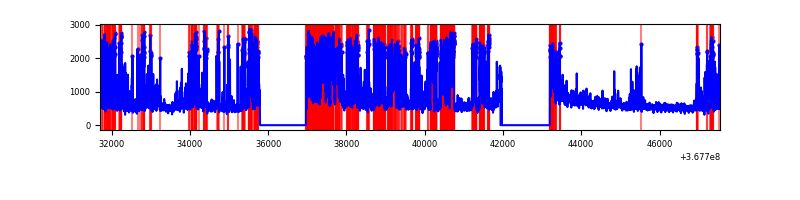 |
| D | 15840 | 13426 | 142 | 142 | 0.90% | 1.06% | 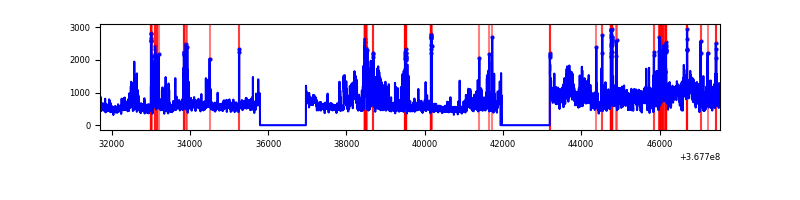 |
Top three noisy pixels from each quadrant. If the there are fewer than three noisy pixels in the level2.evt file, extra rows are filled as -1
| Pixel properties | Quadrant properties | ||||||
|---|---|---|---|---|---|---|---|
| Quadrant | DetID | PixID | Counts | Sigma | Mean | Median | Sigma |
| A | 13 | 254 | 20194 | 52.62 | 1786 | 1755 | 350.4 |
| A | 3 | 137 | 17382 | 44.6 | 1786 | 1755 | 350.4 |
| A | 0 | 226 | 15054 | 37.95 | 1786 | 1755 | 350.4 |
| B | 6 | 159 | 3506852 | 10716.45 | 1761 | 1721 | 327.1 |
| B | 10 | 245 | 668741 | 2039.32 | 1761 | 1721 | 327.1 |
| B | 0 | 190 | 65337 | 194.5 | 1761 | 1721 | 327.1 |
| C | 0 | 10 | 5199307 | 13594.92 | 1675 | 1692 | 382.3 |
| C | 3 | 233 | 375700 | 978.26 | 1675 | 1692 | 382.3 |
| C | 14 | 238 | 276922 | 719.89 | 1675 | 1692 | 382.3 |
| D | 11 | 164 | 2250774 | 5520.99 | 1747 | 1709 | 407.4 |
| D | 7 | 238 | 536717 | 1313.33 | 1747 | 1709 | 407.4 |
| D | 8 | 195 | 351530 | 858.74 | 1747 | 1709 | 407.4 |
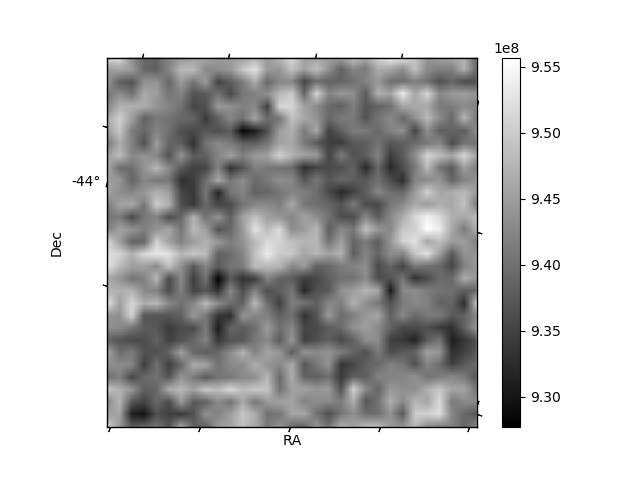
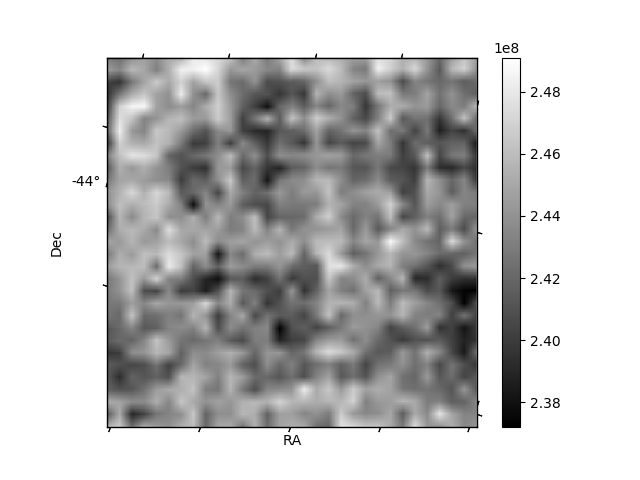
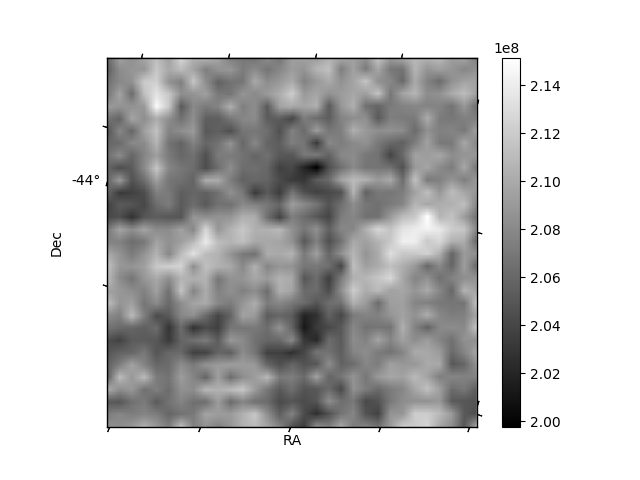
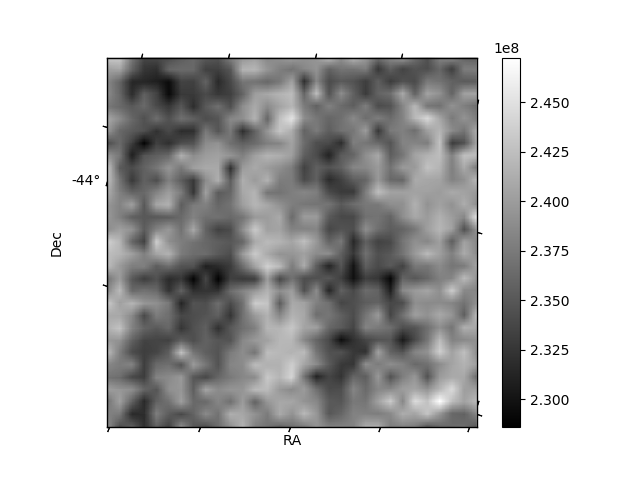
Histogram calculated using DETX and DETY for each event in the final _common_clean file
| Quadrant A | 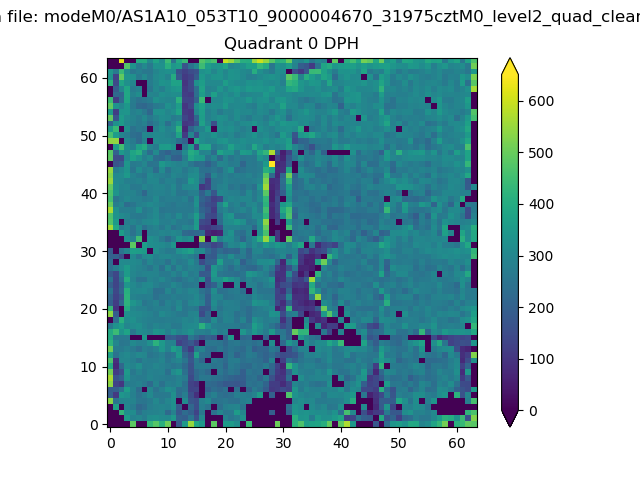 |
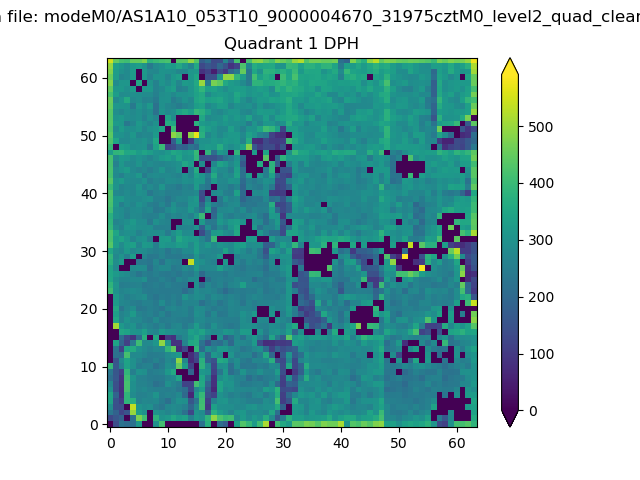 |
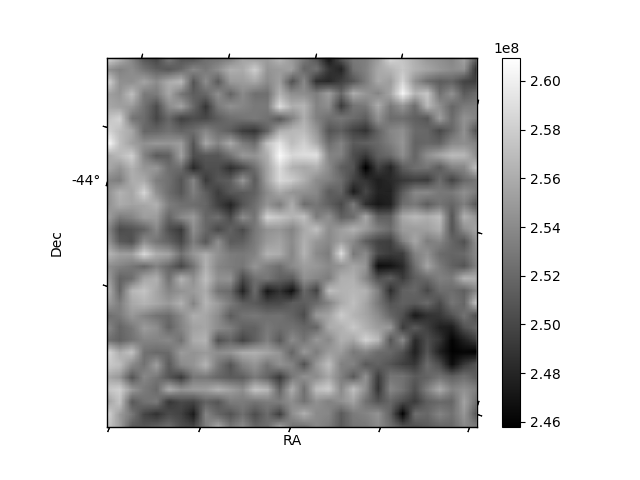
Quadrant B |
|---|---|---|---|
| Quadrant D | 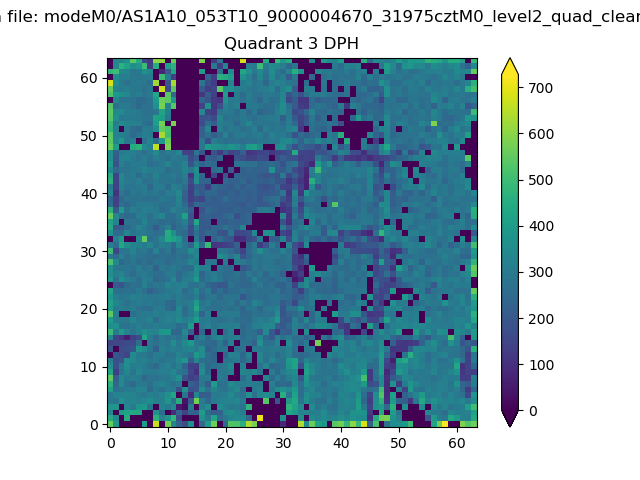 |
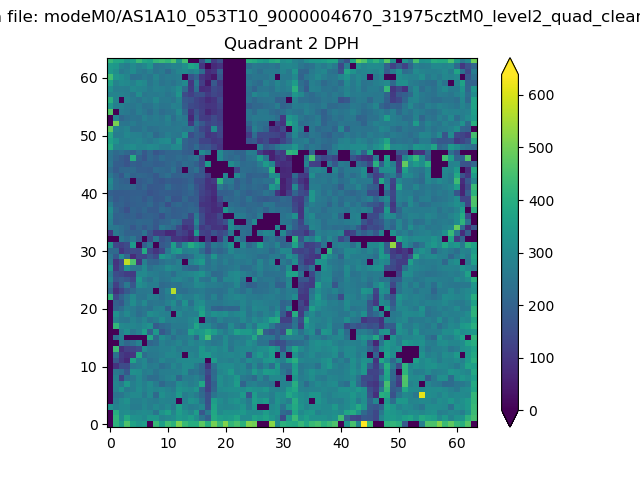 |
Quadrant C |
| Plot type | Count rate plots | Images |
|---|---|---|
| Comparison with Poisson distribution Blue bars denote a histogram of data divided into 1 sec bins. Red curve is a Poisson curve with rate = median count rate of data. |
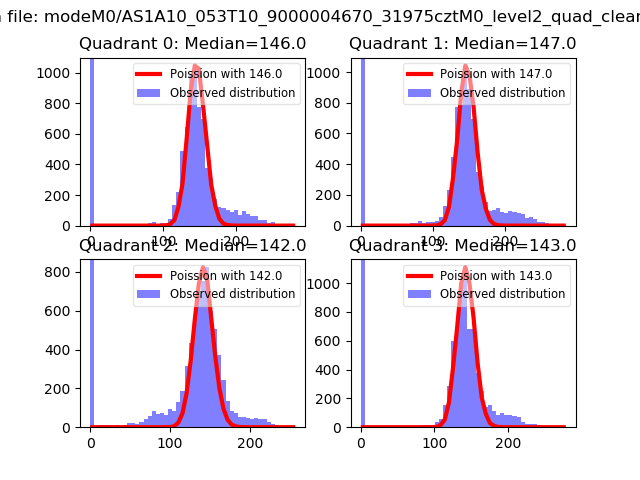 |
 |
| Quadrant-wise count rates Data is divided into 100 sec bins |
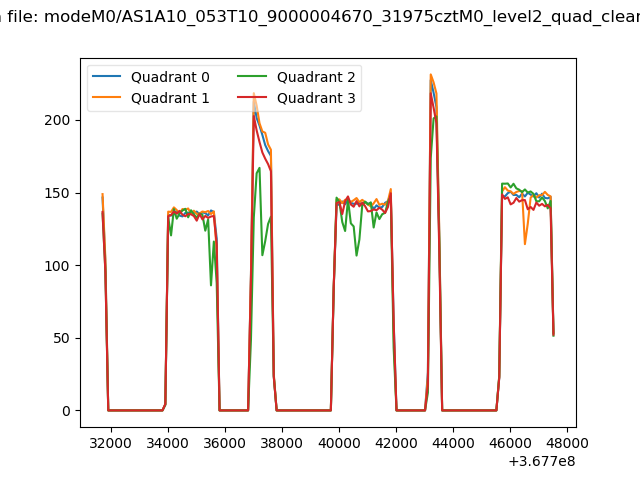 |
|
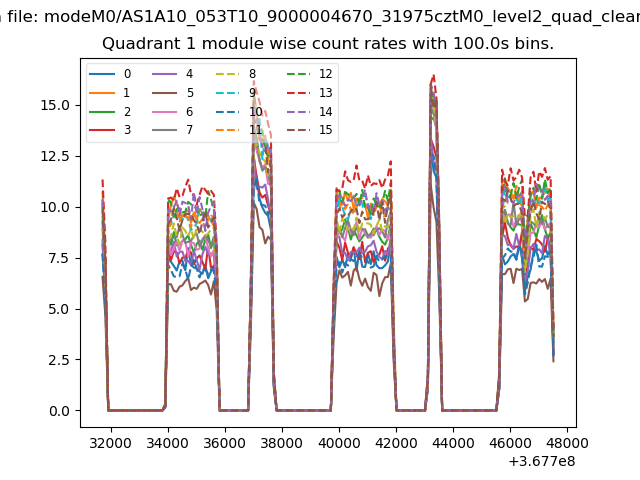
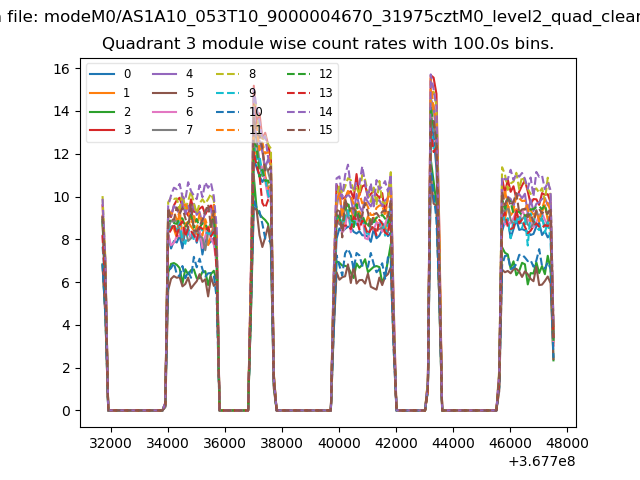
| Module-wise count rates for Quadrant A Data is divided into 100 sec bins |
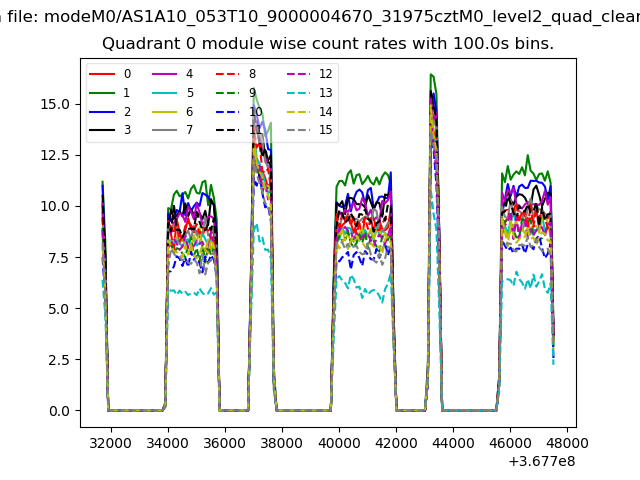 |
 |
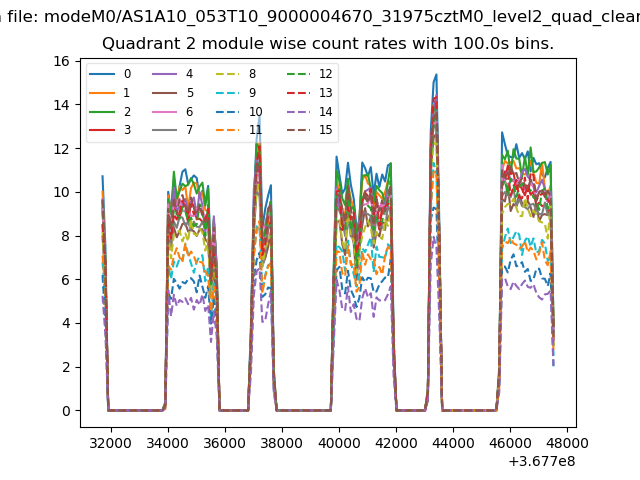
| Module-wise count rates for Quadrant B Data is divided into 100 sec bins |
 |
 |
| Module-wise count rates for Quadrant C Data is divided into 100 sec bins |
 |
 |
| Module-wise count rates for Quadrant D Data is divided into 100 sec bins |
 |
 |
| Parameter | Plot |
|---|---|
| CZT HV Monitor | 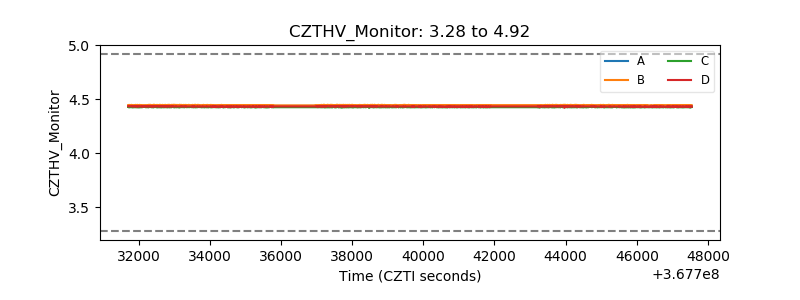 |
| D_VDD | 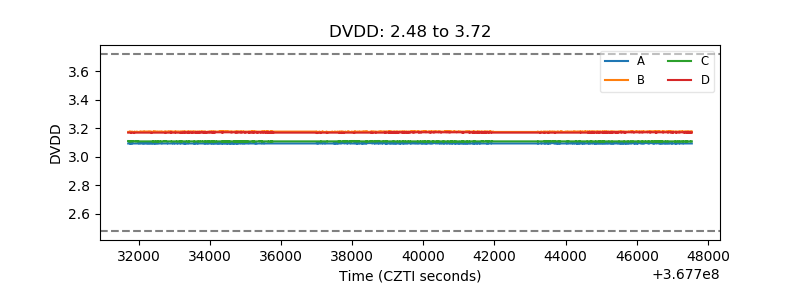 |
| Temperature 1 |  |
| Veto HV Monitor | 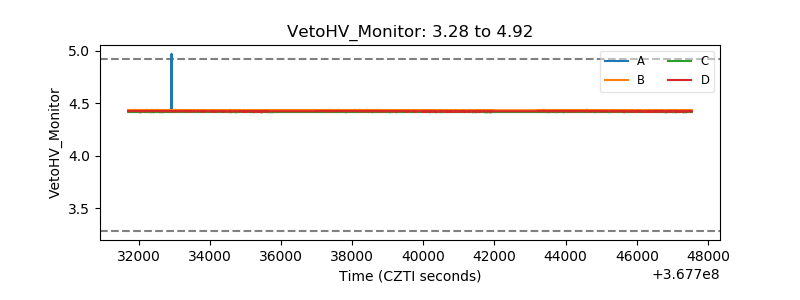 |
| Veto LLD | 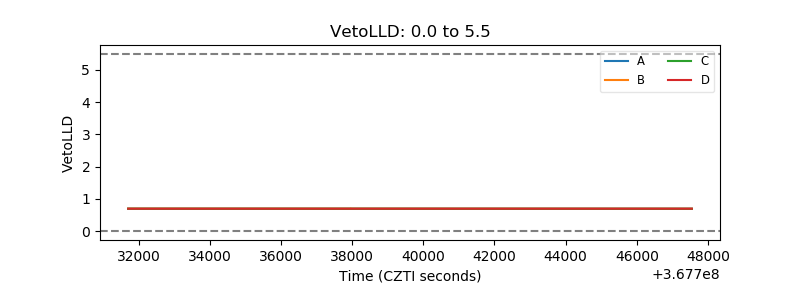 |
| Alpha Counter | 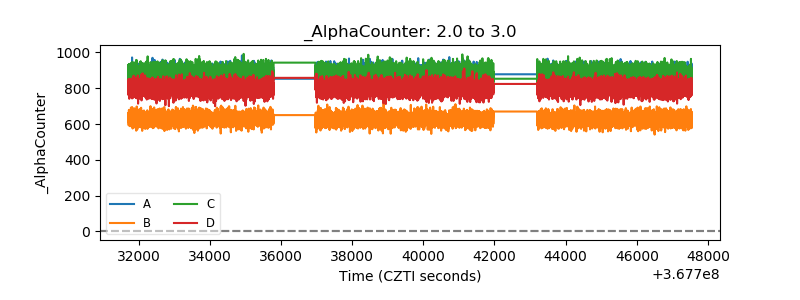 |
| _CPM_Rate | 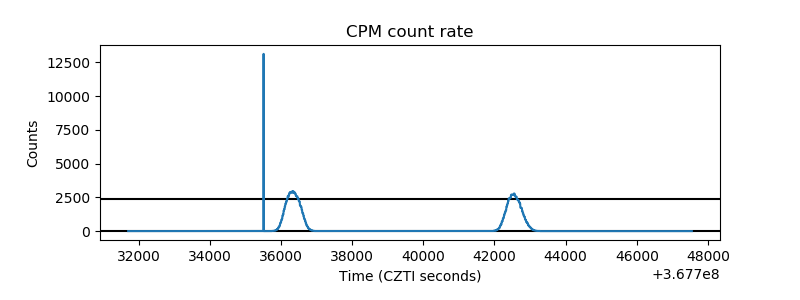 |
| CZT Counter | 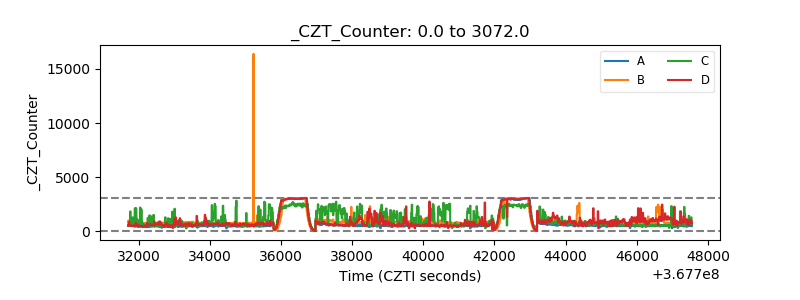 |
| +2.5 Volts monitor |  |
| +5 Volts monitor |  |
| _ROLL_ROT | 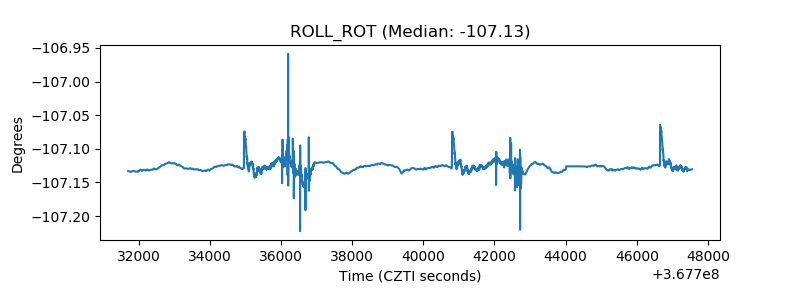 |
| _Roll_DEC | 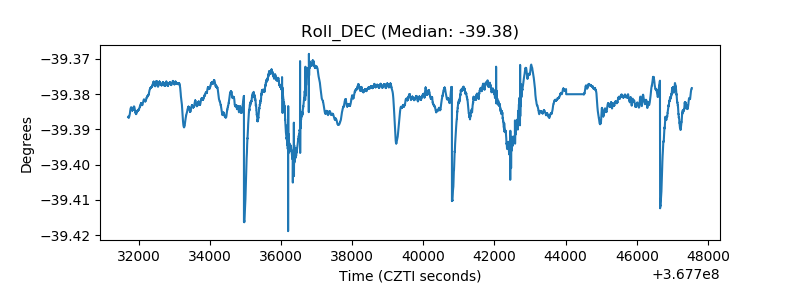 |
| _Roll_RA | 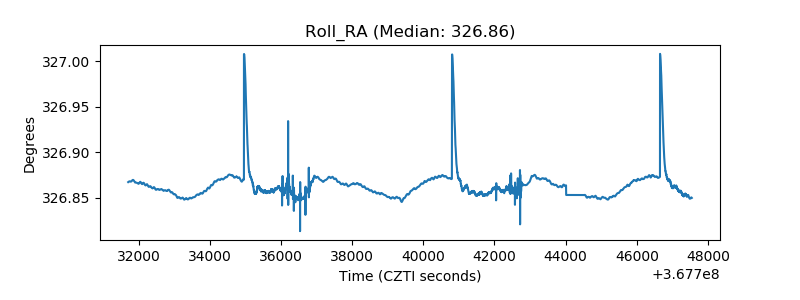 |
| Veto Counter | 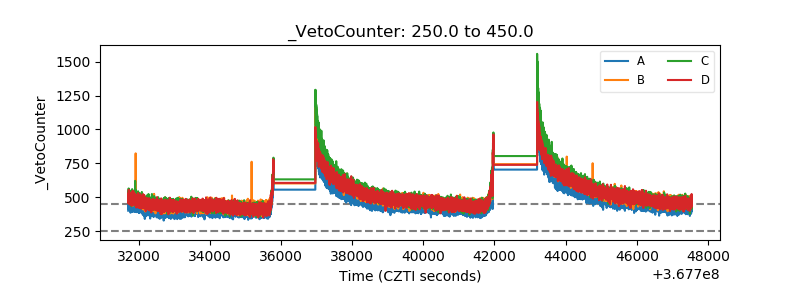 |