| Param | Original file | Final file |
|---|---|---|
| Filename | modeM0/AS1A10_058T12_9000004674cztM0_level2.fits | modeM0/AS1A10_058T12_9000004674cztM0_level2_quad_clean.evt |
| Size (bytes) | 806,319,360 | 634,371,840 |
| Size | 769.0 MB | 605.0 MB |
| Events in quadrant A | 5,116,804 | 3,655,549 |
| Events in quadrant B | 4,714,672 | 3,571,190 |
| Events in quadrant C | 4,788,064 | 3,386,087 |
| Events in quadrant D | 4,319,920 | 3,118,683 |
| Mode SS | |||
|---|---|---|---|
| Quadrant | BADHDUFLAG | Total packets | Discarded packets |
| A | 0 | 1628 | 0 |
| B | 0 | 1628 | 0 |
| C | 0 | 1628 | 0 |
| D | 0 | 1628 | 0 |
| Mode M0 | |||
|---|---|---|---|
| Quadrant | BADHDUFLAG | Total packets | Discarded packets |
| A | 0 | 167124 | 0 |
| B | 0 | 246561 | 0 |
| C | 0 | 190798 | 0 |
| D | 0 | 196901 | 0 |
| Mode M9 | |||
|---|---|---|---|
| Quadrant | BADHDUFLAG | Total packets | Discarded packets |
| A | 0 | 123 | 0 |
| B | 0 | 123 | 0 |
| C | 0 | 123 | 0 |
| D | 0 | 123 | 0 |
| Quadrant | Total seconds | Saturated seconds | Saturation percentage |
|---|---|---|---|
| A | 79909 | 868 | 1.086236% |
| B | 79909 | 2262 | 2.830720% |
| C | 79909 | 3313 | 4.145966% |
| D | 79909 | 2427 | 3.037205% |
Noise dominated data is calculated using 1-second bins in cleaned event files. If a bin has >2000 counts, and if more than 50% of those come from <1% of pixels, then it is considered to be noise-dominated and hence unusable.
| Quadrant | # 1 sec bins | Bins with >0 counts | Bins with >2000 counts | High rate bins dominated by noise | Noise dominated (total time) | Noise dominated (detector-on time) | Marked lightcurve |
|---|---|---|---|---|---|---|---|
| A | 92158 | 79893 | 0 | 0 | 0.00% | 0.00% |  |
| B | 92159 | 79887 | 0 | 0 | 0.00% | 0.00% |  |
| C | 92159 | 79885 | 0 | 0 | 0.00% | 0.00% | 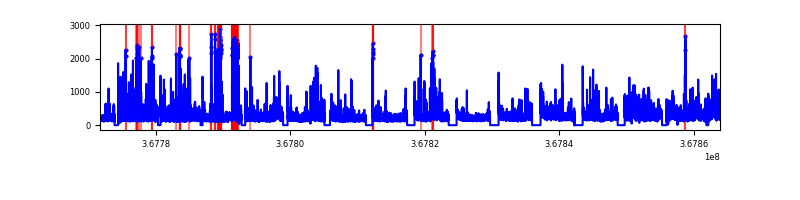 |
| D | 92159 | 79870 | 0 | 0 | 0.00% | 0.00% | 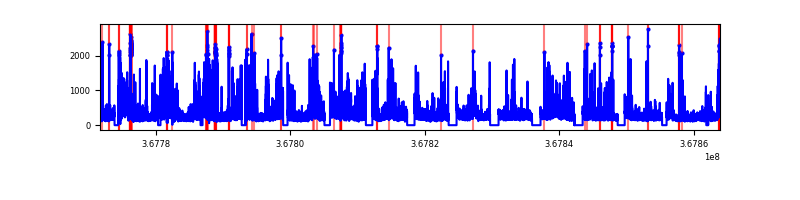 |
Top three noisy pixels from each quadrant. If the there are fewer than three noisy pixels in the level2.evt file, extra rows are filled as -1
| Pixel properties | Quadrant properties | ||||||
|---|---|---|---|---|---|---|---|
| Quadrant | DetID | PixID | Counts | Sigma | Mean | Median | Sigma |
| A | 0 | 29 | 4896 | 11.34 | 1331 | 1252 | 321.4 |
| A | 7 | 110 | 3987 | 8.51 | 1331 | 1252 | 321.4 |
| A | 0 | 30 | 3908 | 8.26 | 1331 | 1252 | 321.4 |
| B | 2 | 9 | 3703 | 10.35 | 1246 | 1190 | 242.9 |
| B | 3 | 80 | 3249 | 8.48 | 1246 | 1190 | 242.9 |
| B | 3 | 17 | 3140 | 8.03 | 1246 | 1190 | 242.9 |
| C | 1 | 80 | 3763 | 8.05 | 1267 | 1185 | 320.2 |
| C | 1 | 81 | 3759 | 8.04 | 1267 | 1185 | 320.2 |
| C | 12 | 241 | 3436 | 7.03 | 1267 | 1185 | 320.2 |
| D | 15 | 47 | 3138 | 6.2 | 1233 | 1125 | 324.9 |
| D | 3 | 14 | 3083 | 6.03 | 1233 | 1125 | 324.9 |
| D | 10 | 189 | 3044 | 5.91 | 1233 | 1125 | 324.9 |
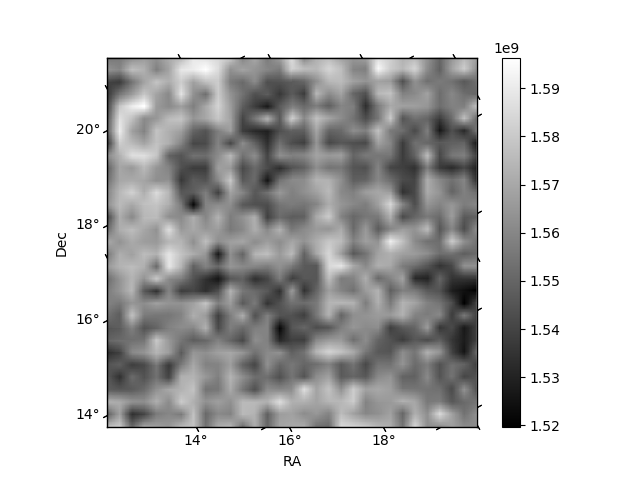
Histogram calculated using DETX and DETY for each event in the final _common_clean file
| Quadrant A | 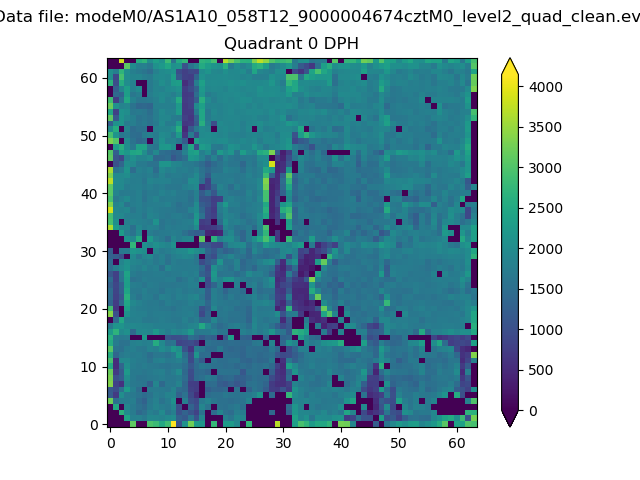 |
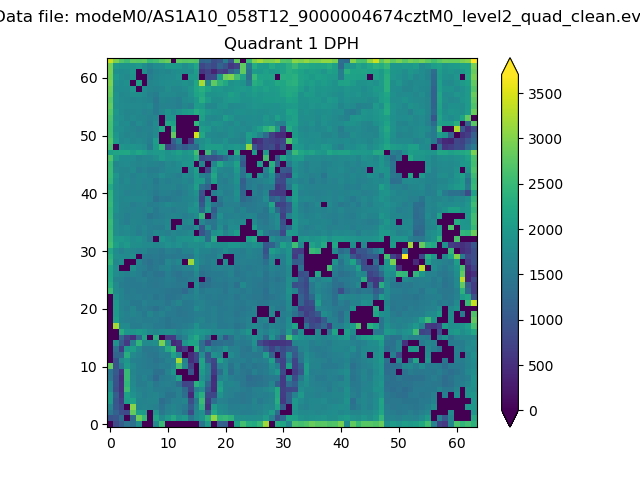 |
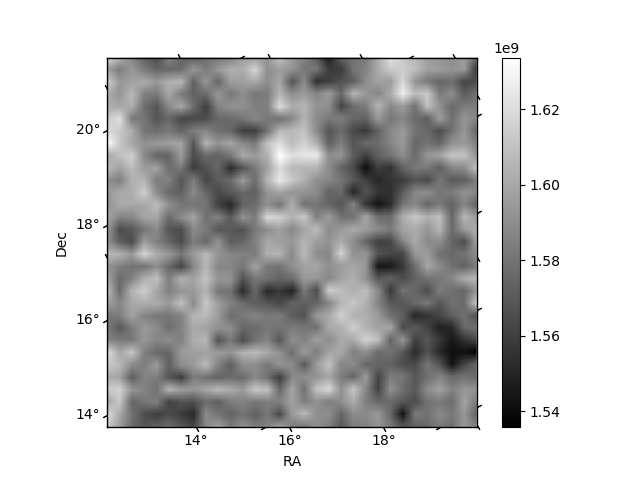
Quadrant B |
|---|---|---|---|
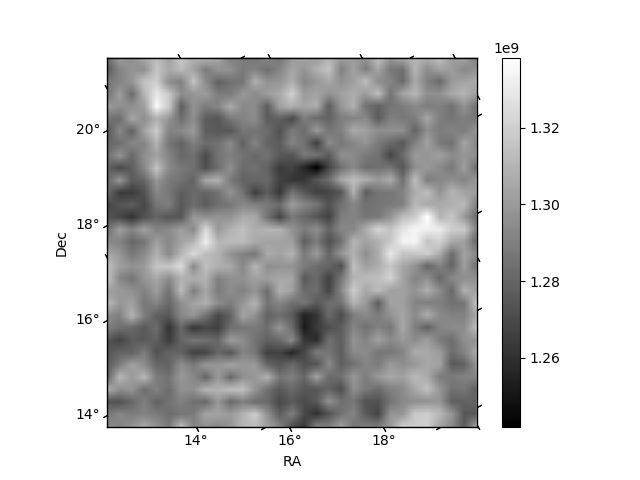
| Quadrant D |  |
 |
Quadrant C |
| Plot type | Count rate plots | Images |
|---|---|---|
| Comparison with Poisson distribution Blue bars denote a histogram of data divided into 1 sec bins. Red curve is a Poisson curve with rate = median count rate of data. |
 |
 |
| Quadrant-wise count rates Data is divided into 100 sec bins |
 |
|
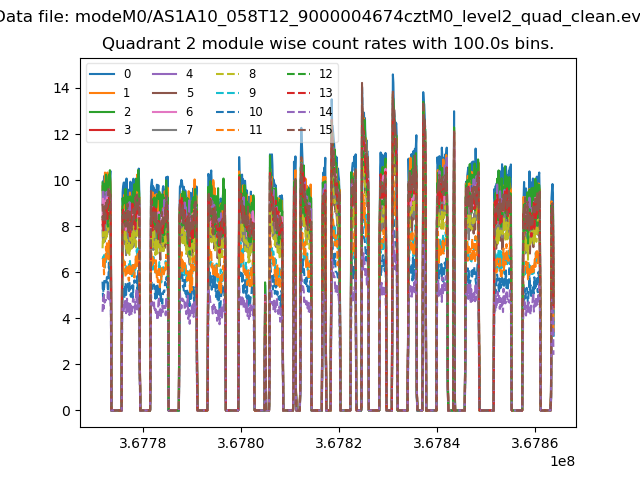
| Module-wise count rates for Quadrant A Data is divided into 100 sec bins |
 |
 |
| Module-wise count rates for Quadrant B Data is divided into 100 sec bins |
 |
 |
| Module-wise count rates for Quadrant C Data is divided into 100 sec bins |
 |
 |
| Module-wise count rates for Quadrant D Data is divided into 100 sec bins |
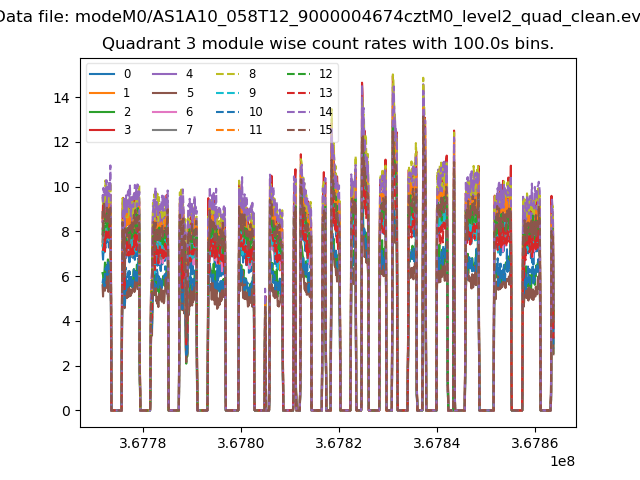 |
 |
| Parameter | Plot |
|---|---|
| CZT HV Monitor |  |
| D_VDD | 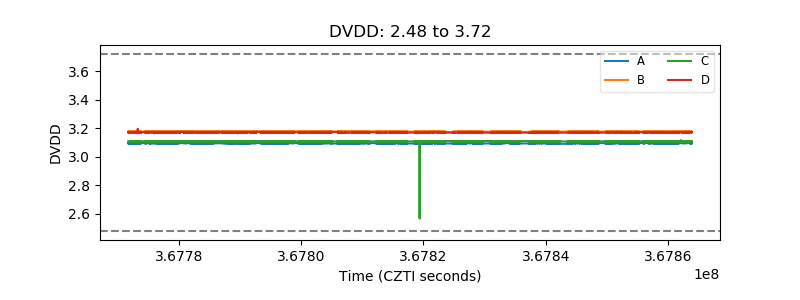 |
| Temperature 1 |  |
| Veto HV Monitor |  |
| Veto LLD | 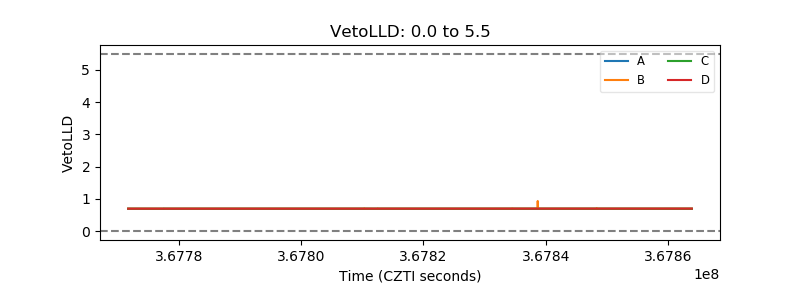 |
| Alpha Counter | 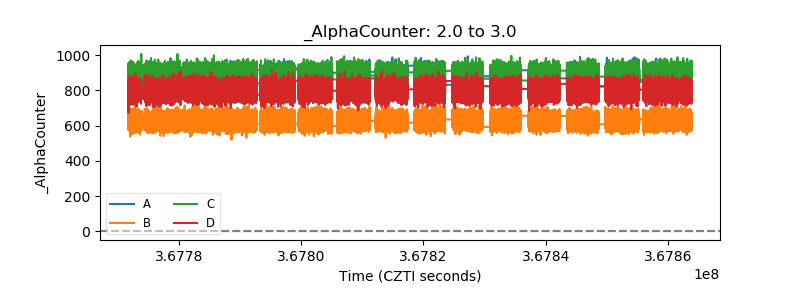 |
| _CPM_Rate |  |
| CZT Counter |  |
| +2.5 Volts monitor | 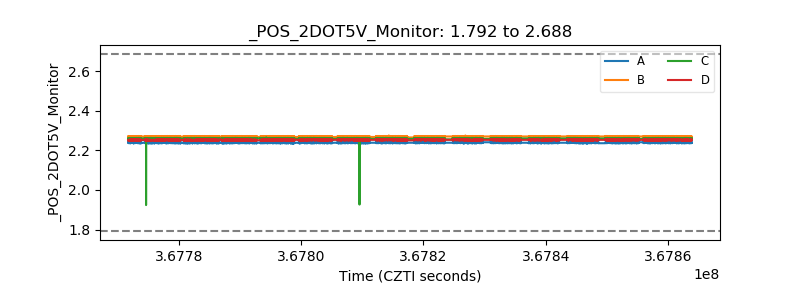 |
| +5 Volts monitor |  |
| _ROLL_ROT |  |
| _Roll_DEC | 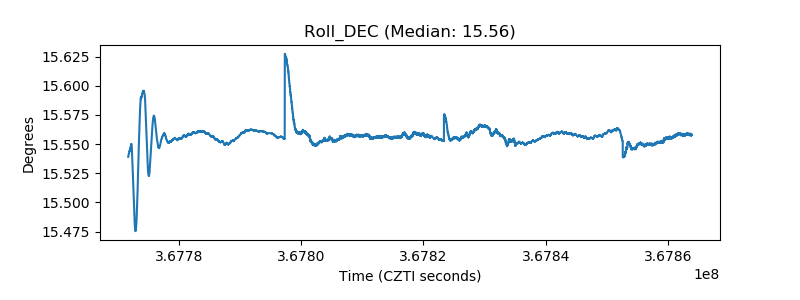 |
| _Roll_RA | 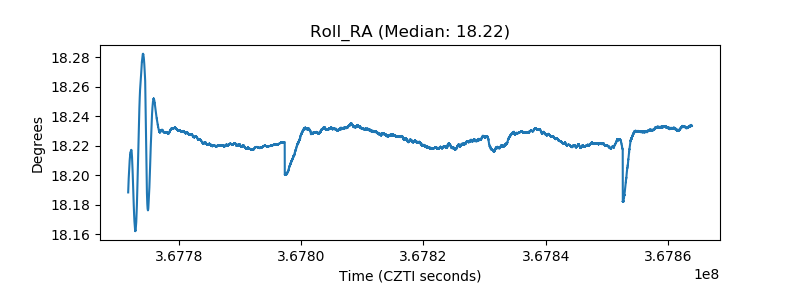 |
| Veto Counter |  |