| Param | Original file | Final file |
|---|---|---|
| Filename | modeM0/AS1A10_058T12_9000004674_31979cztM0_level2.evt | modeM0/AS1A10_058T12_9000004674_31979cztM0_level2_quad_clean.evt |
| Size (bytes) | 312,402,240 | 41,474,880 |
| Size | 297.9 MB | 39.6 MB |
| Events in quadrant A | 1,850,187 | 255,161 |
| Events in quadrant B | 2,909,943 | 252,720 |
| Events in quadrant C | 2,045,514 | 246,204 |
| Events in quadrant D | 2,408,369 | 244,992 |
| Mode SS | |||
|---|---|---|---|
| Quadrant | BADHDUFLAG | Total packets | Discarded packets |
| A | 0 | 76 | 0 |
| B | 0 | 76 | 0 |
| C | 0 | 76 | 0 |
| D | 0 | 76 | 0 |
| Mode M0 | |||
|---|---|---|---|
| Quadrant | BADHDUFLAG | Total packets | Discarded packets |
| A | 0 | 7616 | 1 |
| B | 0 | 11199 | 1 |
| C | 0 | 8257 | 1 |
| D | 0 | 9629 | 5 |
| Mode M9 | |||
|---|---|---|---|
| Quadrant | BADHDUFLAG | Total packets | Discarded packets |
| A | 0 | 5 | 0 |
| B | 0 | 5 | 0 |
| C | 0 | 5 | 0 |
| D | 0 | 5 | 0 |
| Quadrant | Total seconds | Saturated seconds | Saturation percentage |
|---|---|---|---|
| A | 3616 | 56 | 1.548673% |
| B | 3616 | 146 | 4.037611% |
| C | 3616 | 189 | 5.226770% |
| D | 3615 | 131 | 3.623790% |
Noise dominated data is calculated using 1-second bins in cleaned event files. If a bin has >2000 counts, and if more than 50% of those come from <1% of pixels, then it is considered to be noise-dominated and hence unusable.
| Quadrant | # 1 sec bins | Bins with >0 counts | Bins with >2000 counts | High rate bins dominated by noise | Noise dominated (total time) | Noise dominated (detector-on time) | Marked lightcurve |
|---|---|---|---|---|---|---|---|
| A | 4136 | 3616 | 0 | 0 | 0.00% | 0.00% | 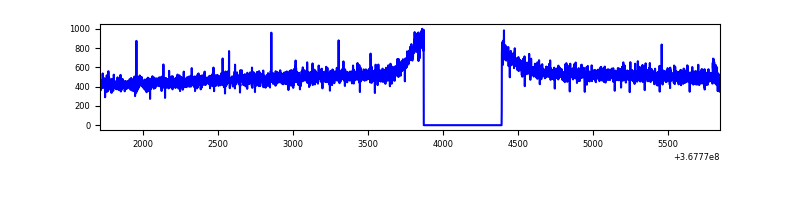 |
| B | 4136 | 3616 | 17 | 17 | 0.41% | 0.47% | 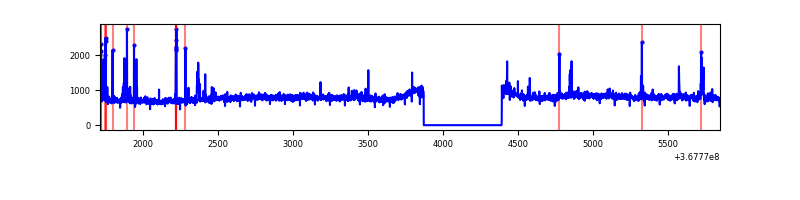 |
| C | 4136 | 3616 | 10 | 10 | 0.24% | 0.28% | 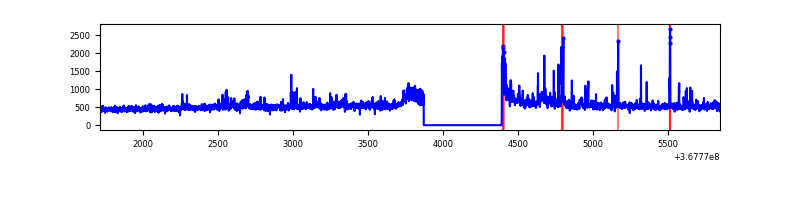 |
| D | 4135 | 3615 | 69 | 69 | 1.67% | 1.91% | 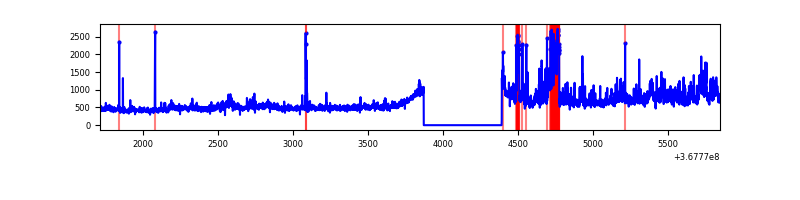 |
Top three noisy pixels from each quadrant. If the there are fewer than three noisy pixels in the level2.evt file, extra rows are filled as -1
| Pixel properties | Quadrant properties | ||||||
|---|---|---|---|---|---|---|---|
| Quadrant | DetID | PixID | Counts | Sigma | Mean | Median | Sigma |
| A | 13 | 254 | 6500 | 61.37 | 478 | 466 | 98.3 |
| A | 14 | 238 | 5058 | 46.7 | 478 | 466 | 98.3 |
| A | 3 | 137 | 4933 | 45.43 | 478 | 466 | 98.3 |
| B | 6 | 159 | 959523 | 10417.07 | 465 | 453 | 92.1 |
| B | 10 | 245 | 86205 | 931.41 | 465 | 453 | 92.1 |
| B | 0 | 190 | 11420 | 119.12 | 465 | 453 | 92.1 |
| C | 0 | 10 | 126099 | 1182.22 | 443 | 445 | 106.3 |
| C | 14 | 238 | 111496 | 1044.83 | 443 | 445 | 106.3 |
| C | 14 | 254 | 55489 | 517.88 | 443 | 445 | 106.3 |
| D | 8 | 195 | 364857 | 3353.95 | 453 | 439 | 108.7 |
| D | 13 | 249 | 129071 | 1183.87 | 453 | 439 | 108.7 |
| D | 12 | 218 | 77685 | 710.94 | 453 | 439 | 108.7 |
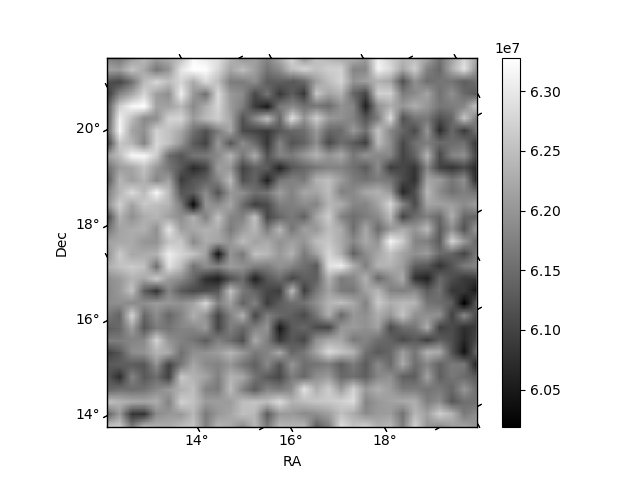
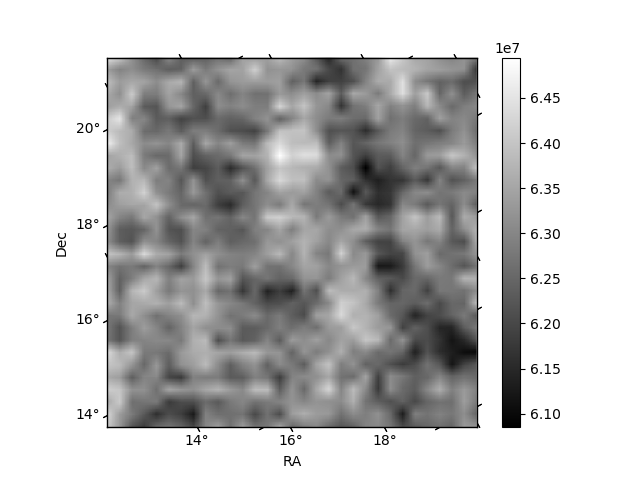
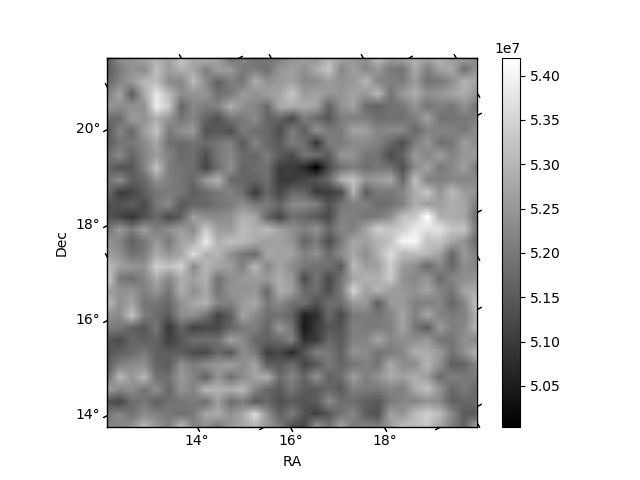
Histogram calculated using DETX and DETY for each event in the final _common_clean file
| Quadrant A | 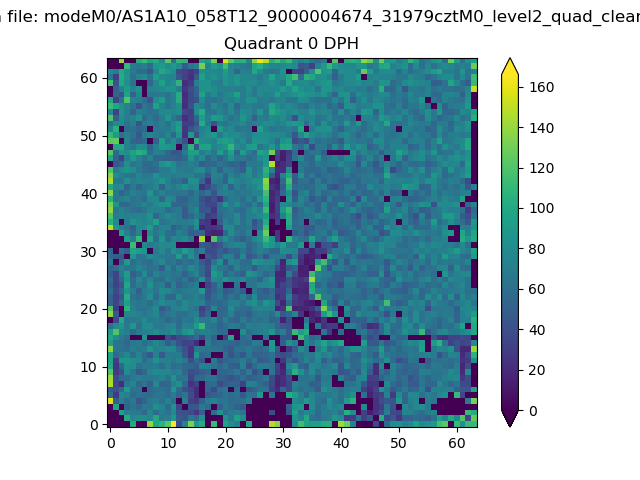 |
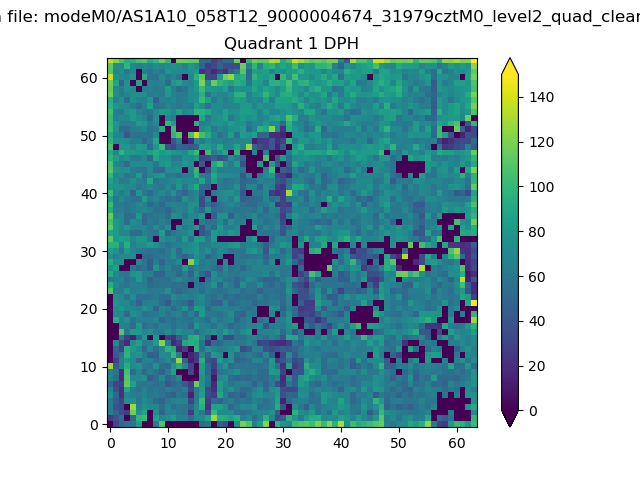 |
Quadrant B |
|---|---|---|---|
| Quadrant D |  |
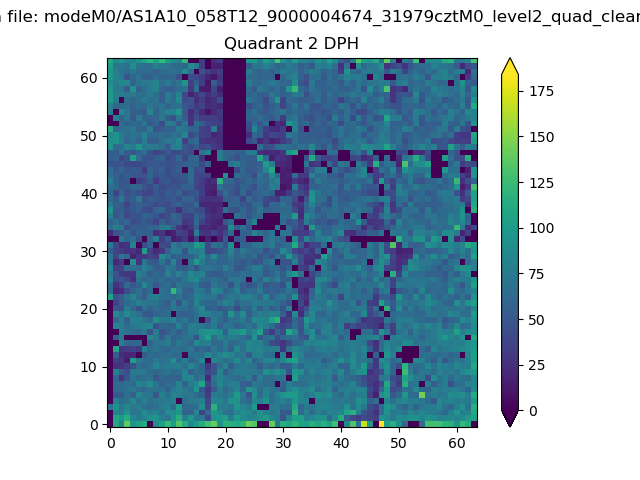 |
Quadrant C |
| Plot type | Count rate plots | Images |
|---|---|---|
| Comparison with Poisson distribution Blue bars denote a histogram of data divided into 1 sec bins. Red curve is a Poisson curve with rate = median count rate of data. |
 |
 |
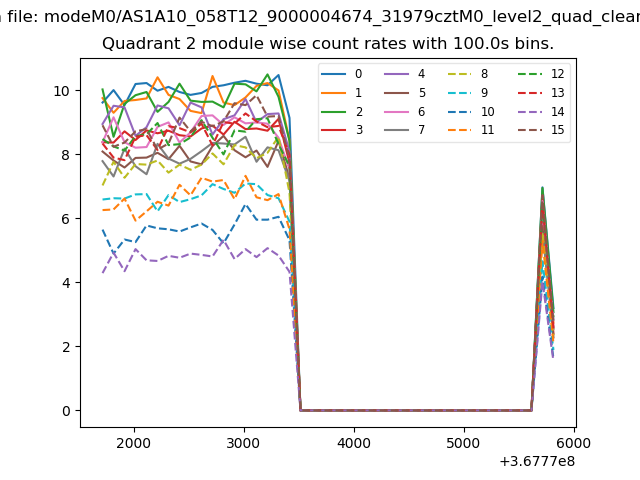
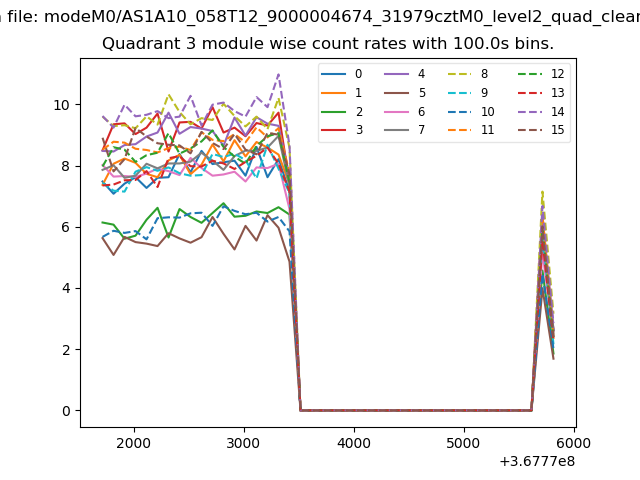
| Quadrant-wise count rates Data is divided into 100 sec bins |
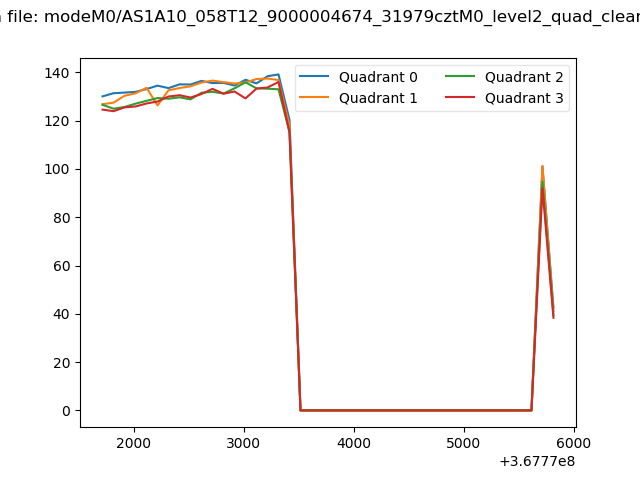 |
|
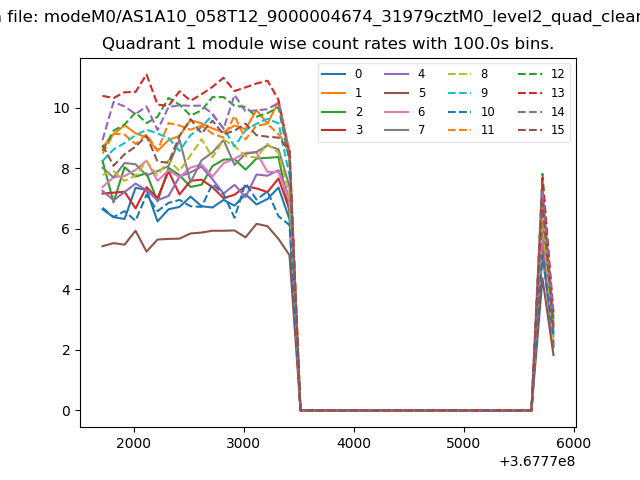
| Module-wise count rates for Quadrant A Data is divided into 100 sec bins |
 |
 |
| Module-wise count rates for Quadrant B Data is divided into 100 sec bins |
 |
 |
| Module-wise count rates for Quadrant C Data is divided into 100 sec bins |
 |
 |
| Module-wise count rates for Quadrant D Data is divided into 100 sec bins |
 |
 |
| Parameter | Plot |
|---|---|
| CZT HV Monitor | 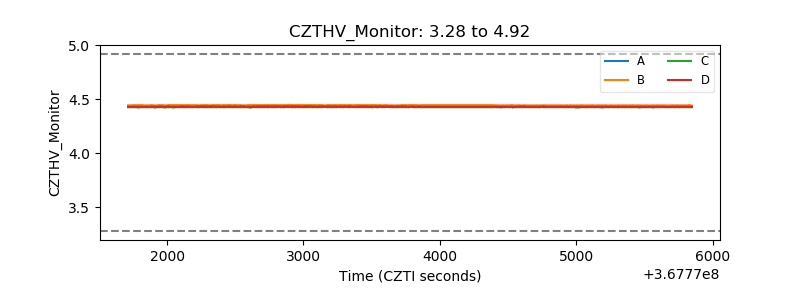 |
| D_VDD | 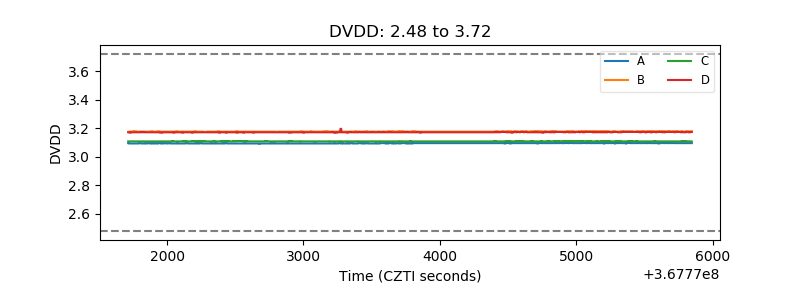 |
| Temperature 1 | 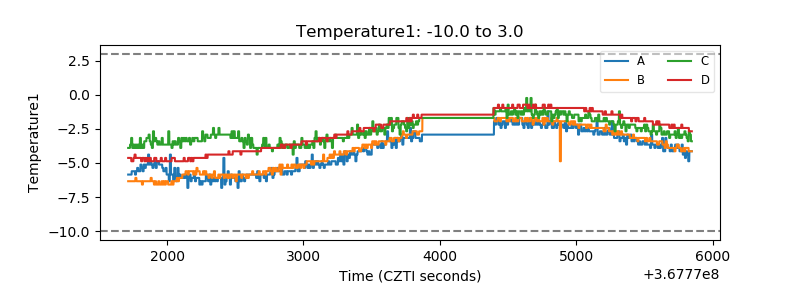 |
| Veto HV Monitor | 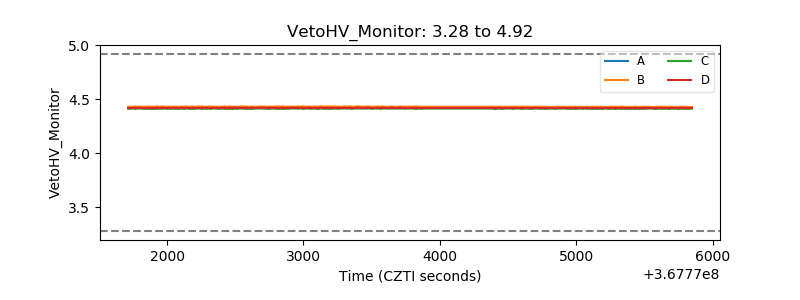 |
| Veto LLD | 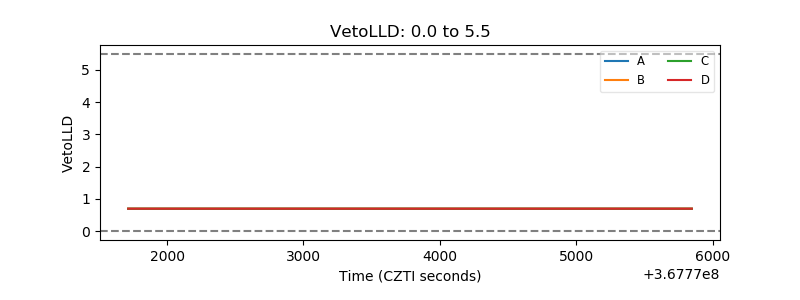 |
| Alpha Counter | 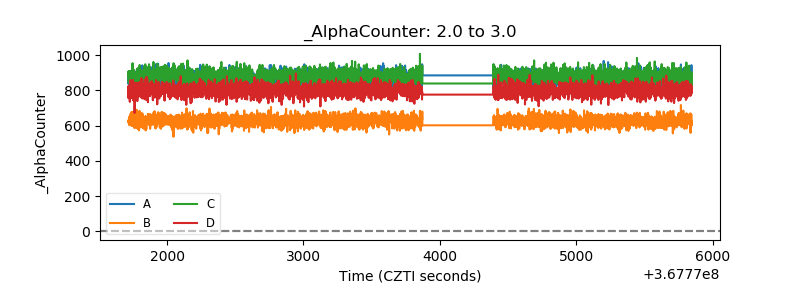 |
| _CPM_Rate | 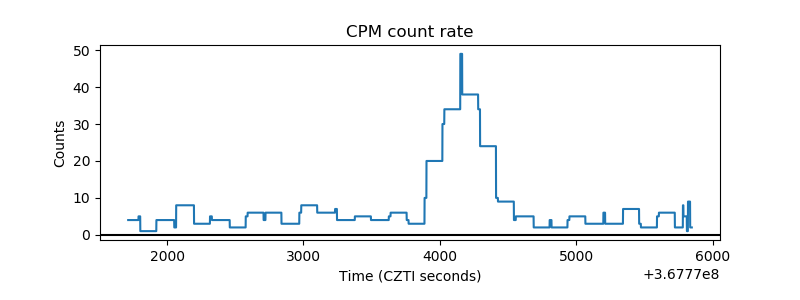 |
| CZT Counter | 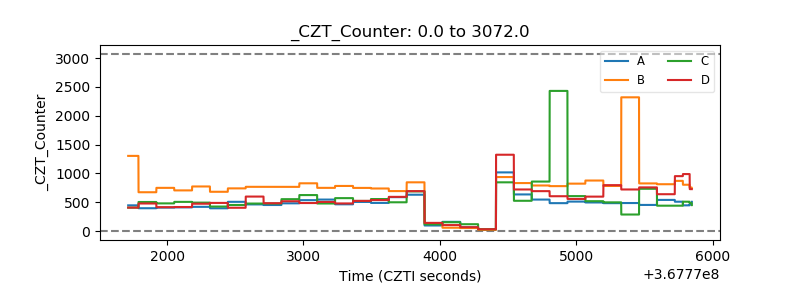 |
| +2.5 Volts monitor |  |
| +5 Volts monitor | 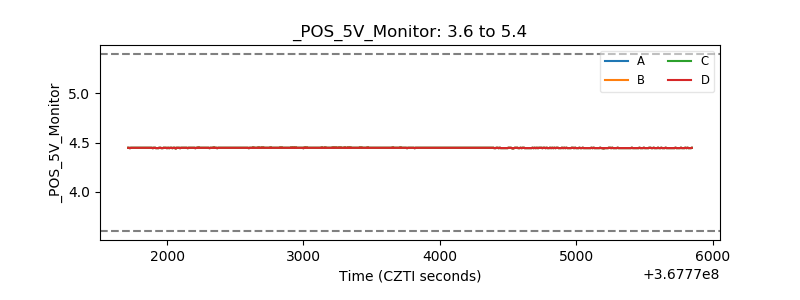 |
| _ROLL_ROT | 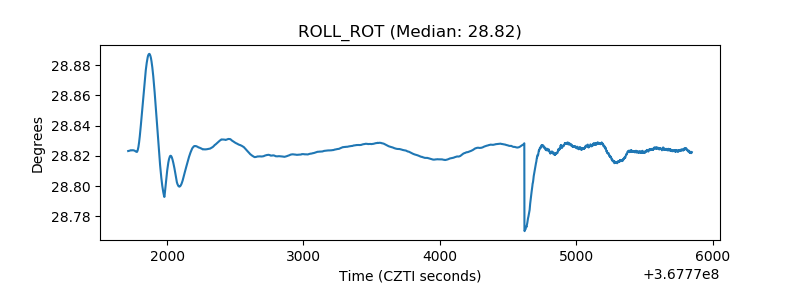 |
| _Roll_DEC | 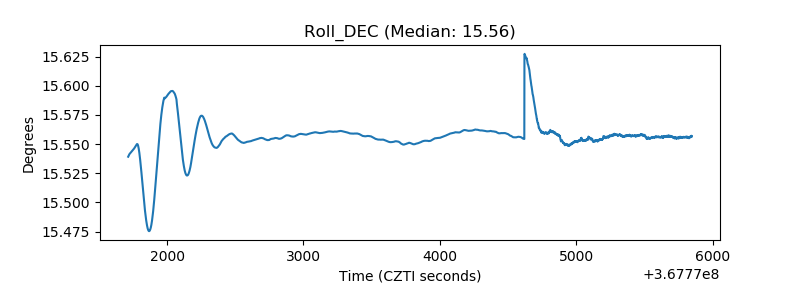 |
| _Roll_RA | 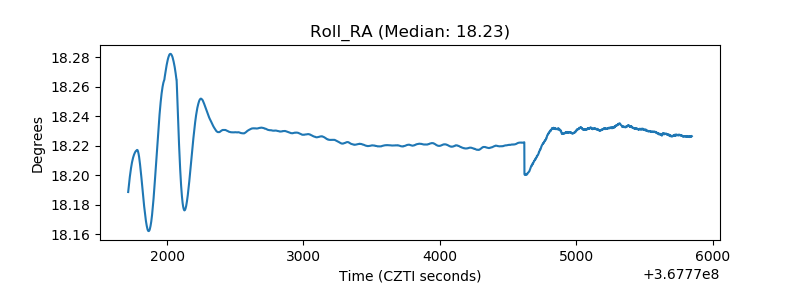 |
| Veto Counter | 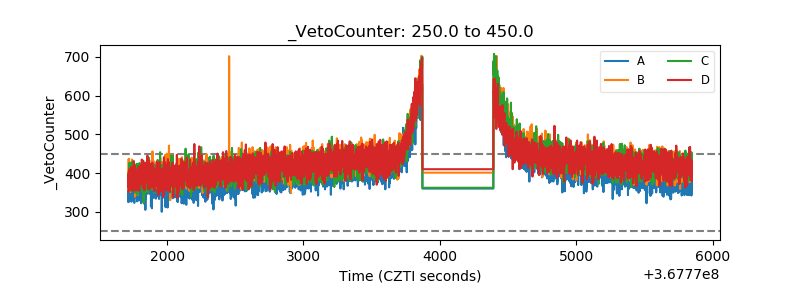 |