| Param | Original file | Final file |
|---|---|---|
| Filename | modeM0/AS1A10_058T12_9000004674_31980cztM0_level2.evt | modeM0/AS1A10_058T12_9000004674_31980cztM0_level2_quad_clean.evt |
| Size (bytes) | 648,354,240 | 86,711,040 |
| Size | 618.3 MB | 82.7 MB |
| Events in quadrant A | 3,640,735 | 550,577 |
| Events in quadrant B | 5,833,057 | 541,690 |
| Events in quadrant C | 4,212,638 | 519,955 |
| Events in quadrant D | 5,448,132 | 498,303 |
| Mode SS | |||
|---|---|---|---|
| Quadrant | BADHDUFLAG | Total packets | Discarded packets |
| A | 0 | 150 | 0 |
| B | 0 | 150 | 0 |
| C | 0 | 150 | 0 |
| D | 0 | 150 | 0 |
| Mode M0 | |||
|---|---|---|---|
| Quadrant | BADHDUFLAG | Total packets | Discarded packets |
| A | 0 | 15397 | 2 |
| B | 0 | 22670 | 2 |
| C | 0 | 17011 | 2 |
| D | 0 | 21290 | 2 |
| Mode M9 | |||
|---|---|---|---|
| Quadrant | BADHDUFLAG | Total packets | Discarded packets |
| A | 0 | 5 | 0 |
| B | 0 | 6 | 0 |
| C | 0 | 6 | 0 |
| D | 0 | 6 | 0 |
| Quadrant | Total seconds | Saturated seconds | Saturation percentage |
|---|---|---|---|
| A | 7404 | 43 | 0.580767% |
| B | 7404 | 163 | 2.201513% |
| C | 7404 | 224 | 3.025392% |
| D | 7404 | 571 | 7.712048% |
Noise dominated data is calculated using 1-second bins in cleaned event files. If a bin has >2000 counts, and if more than 50% of those come from <1% of pixels, then it is considered to be noise-dominated and hence unusable.
| Quadrant | # 1 sec bins | Bins with >0 counts | Bins with >2000 counts | High rate bins dominated by noise | Noise dominated (total time) | Noise dominated (detector-on time) | Marked lightcurve |
|---|---|---|---|---|---|---|---|
| A | 7789 | 7404 | 0 | 0 | 0.00% | 0.00% | 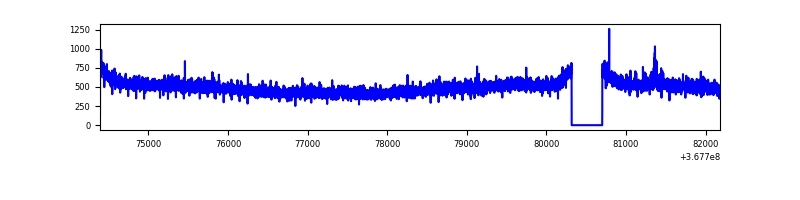 |
| B | 7789 | 7404 | 7 | 7 | 0.09% | 0.09% | 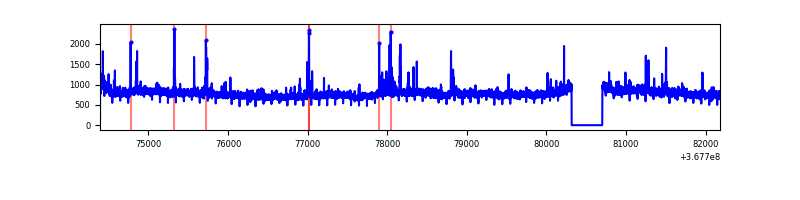 |
| C | 7789 | 7404 | 50 | 50 | 0.64% | 0.68% | 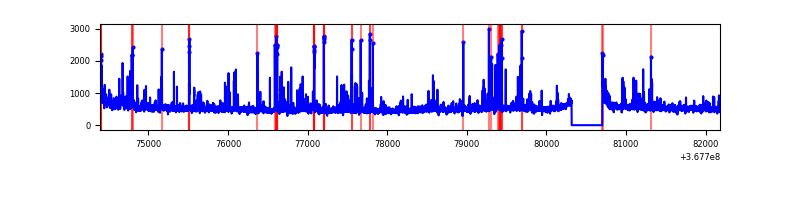 |
| D | 7789 | 7405 | 427 | 427 | 5.48% | 5.77% | 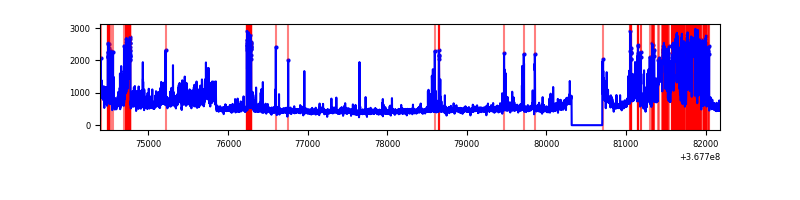 |
Top three noisy pixels from each quadrant. If the there are fewer than three noisy pixels in the level2.evt file, extra rows are filled as -1
| Pixel properties | Quadrant properties | ||||||
|---|---|---|---|---|---|---|---|
| Quadrant | DetID | PixID | Counts | Sigma | Mean | Median | Sigma |
| A | 14 | 238 | 21816 | 110.79 | 937 | 919 | 188.6 |
| A | 13 | 254 | 13234 | 65.29 | 937 | 919 | 188.6 |
| A | 3 | 137 | 9595 | 46.0 | 937 | 919 | 188.6 |
| B | 6 | 159 | 2029583 | 11394.1 | 919 | 893 | 178.0 |
| B | 10 | 245 | 79418 | 441.03 | 919 | 893 | 178.0 |
| B | 15 | 33 | 27566 | 149.81 | 919 | 893 | 178.0 |
| C | 0 | 10 | 482148 | 2299.06 | 882 | 887 | 209.3 |
| C | 14 | 238 | 158386 | 752.4 | 882 | 887 | 209.3 |
| C | 3 | 233 | 50660 | 237.77 | 882 | 887 | 209.3 |
| D | 13 | 249 | 1008071 | 4840.59 | 873 | 849 | 208.1 |
| D | 8 | 195 | 636366 | 3054.22 | 873 | 849 | 208.1 |
| D | 10 | 199 | 161046 | 769.89 | 873 | 849 | 208.1 |
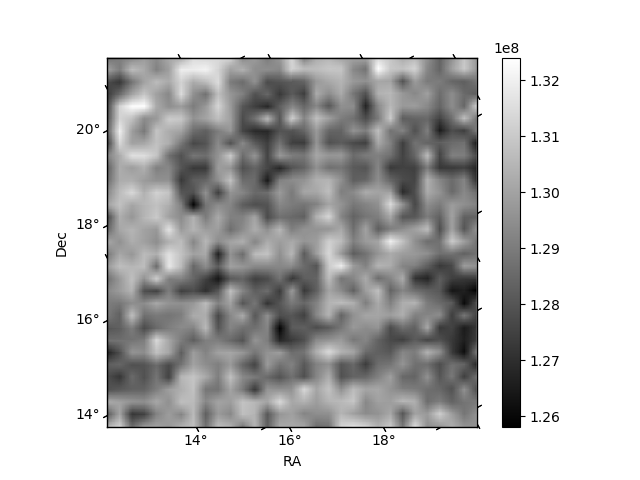
Histogram calculated using DETX and DETY for each event in the final _common_clean file
| Quadrant A | 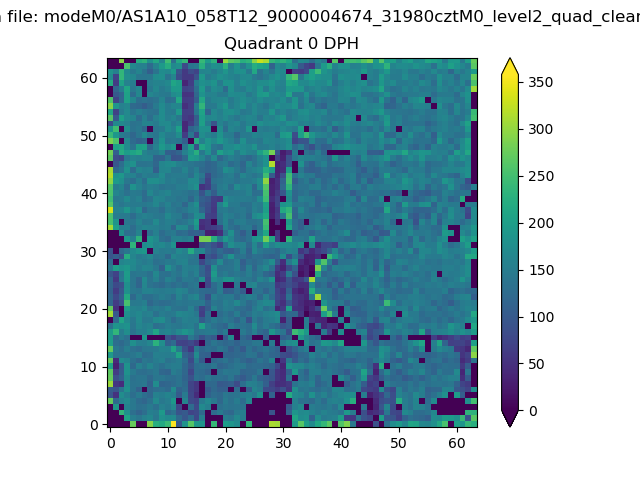 |
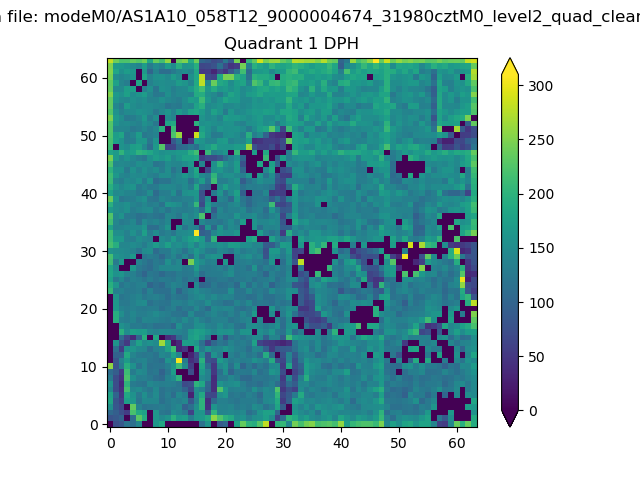 |
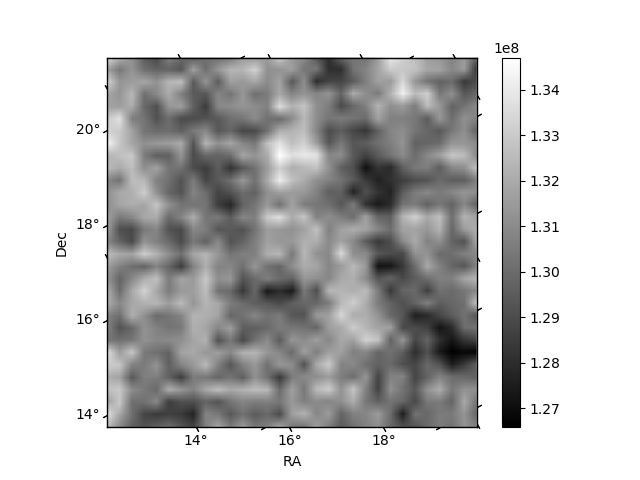
Quadrant B |
|---|---|---|---|
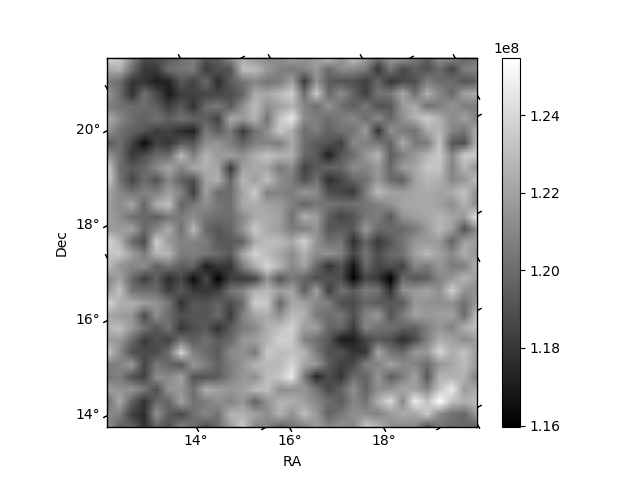
| Quadrant D |  |
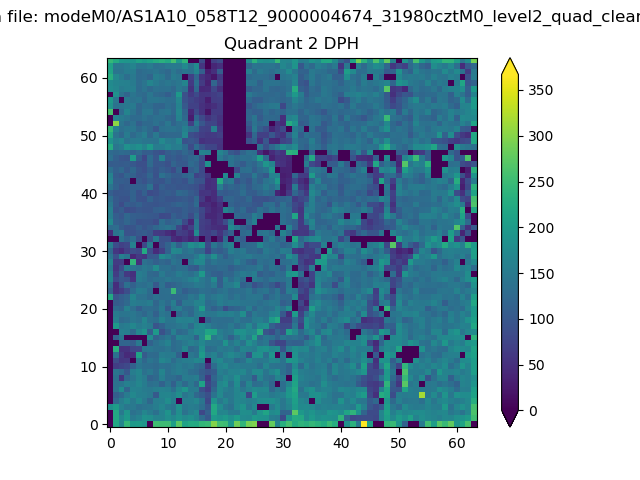 |
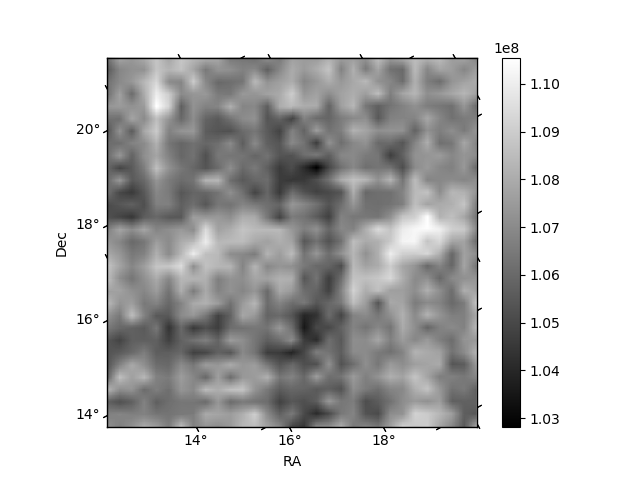
Quadrant C |
| Plot type | Count rate plots | Images |
|---|---|---|
| Comparison with Poisson distribution Blue bars denote a histogram of data divided into 1 sec bins. Red curve is a Poisson curve with rate = median count rate of data. |
 |
 |
| Quadrant-wise count rates Data is divided into 100 sec bins |
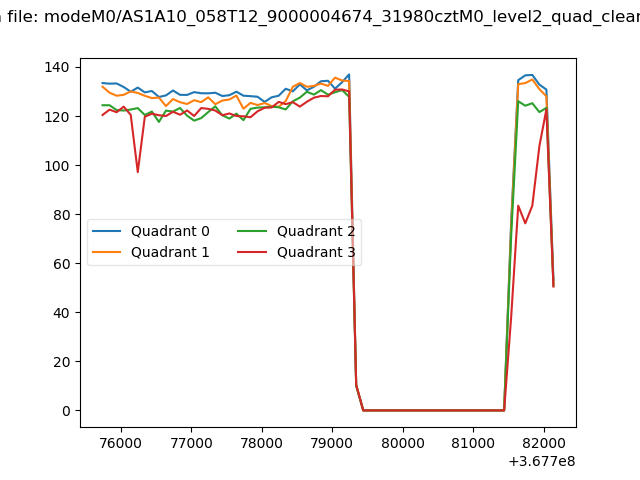 |
|
| Module-wise count rates for Quadrant A Data is divided into 100 sec bins |
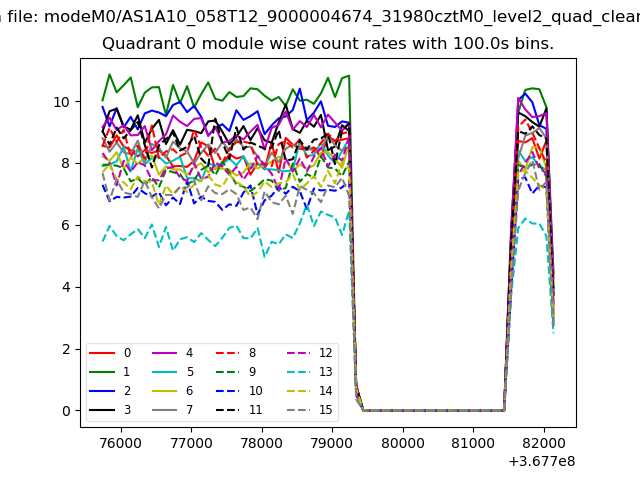 |
 |
| Module-wise count rates for Quadrant B Data is divided into 100 sec bins |
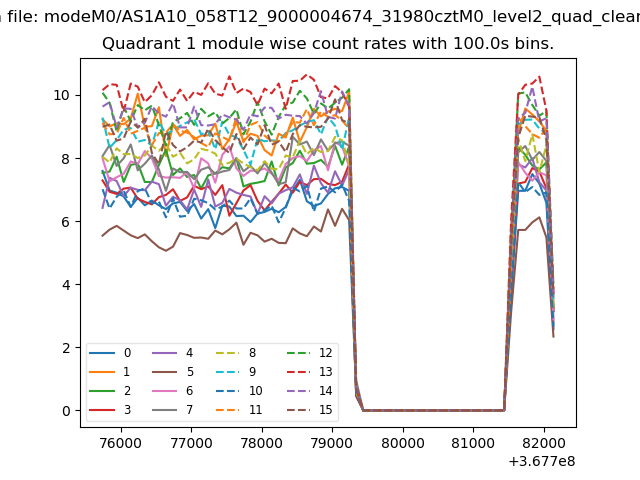 |
 |
| Module-wise count rates for Quadrant C Data is divided into 100 sec bins |
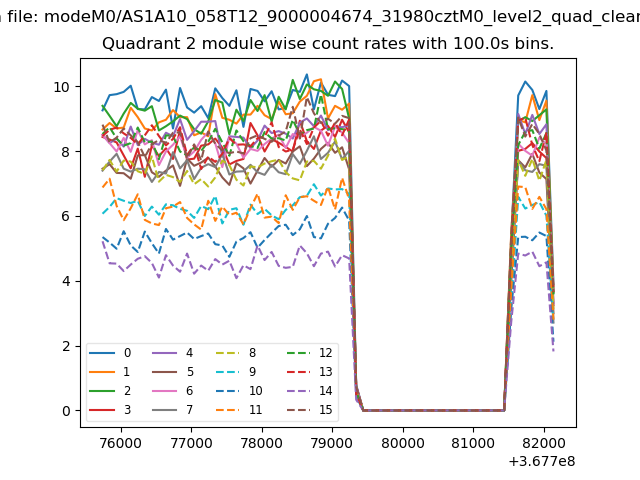 |
 |
| Module-wise count rates for Quadrant D Data is divided into 100 sec bins |
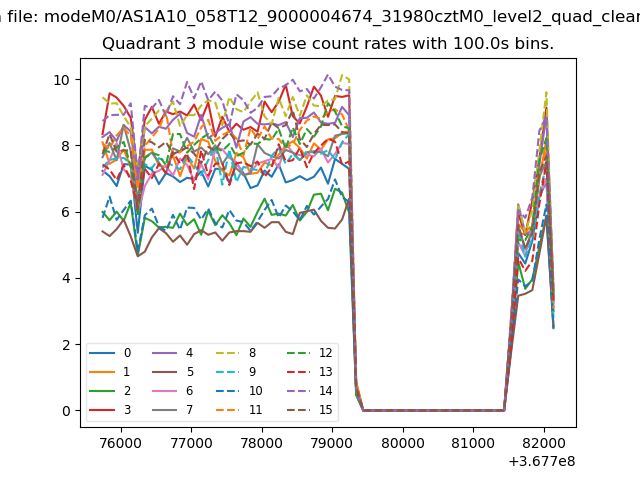 |
 |
| Parameter | Plot |
|---|---|
| CZT HV Monitor | 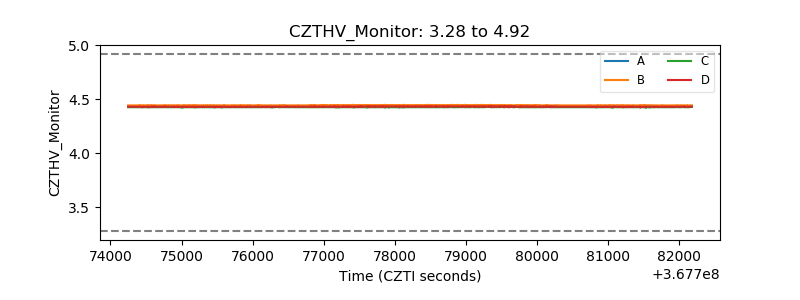 |
| D_VDD | 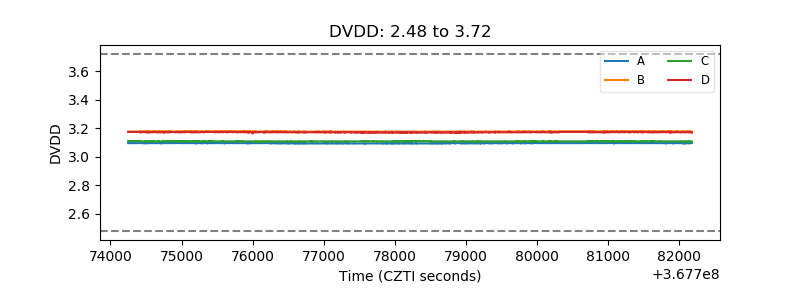 |
| Temperature 1 | 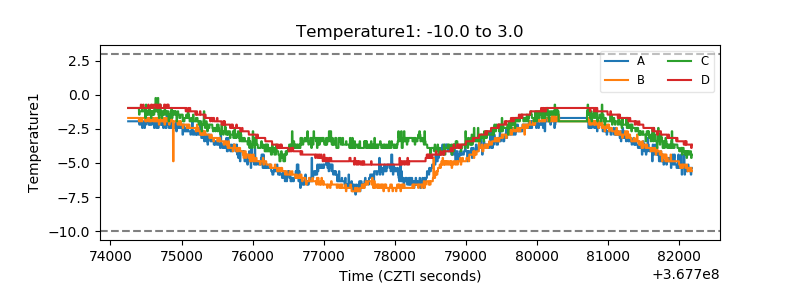 |
| Veto HV Monitor |  |
| Veto LLD | 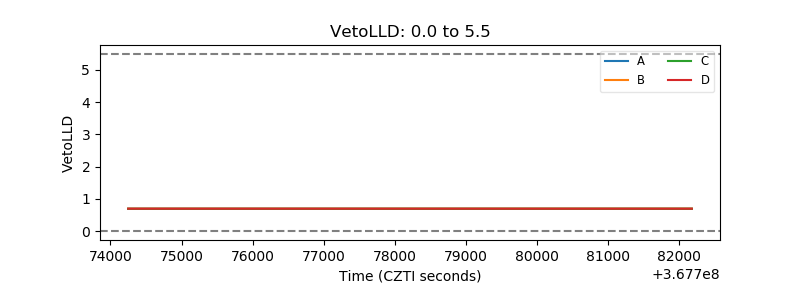 |
| Alpha Counter | 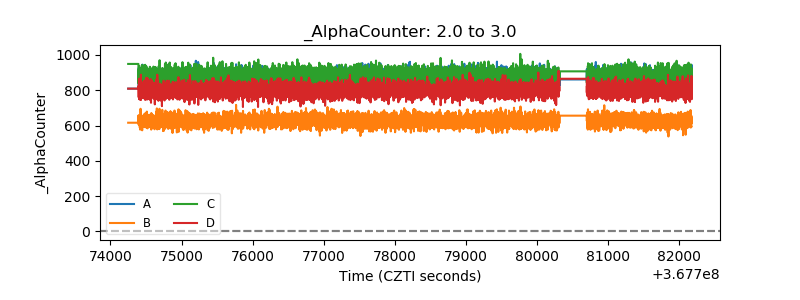 |
| _CPM_Rate | 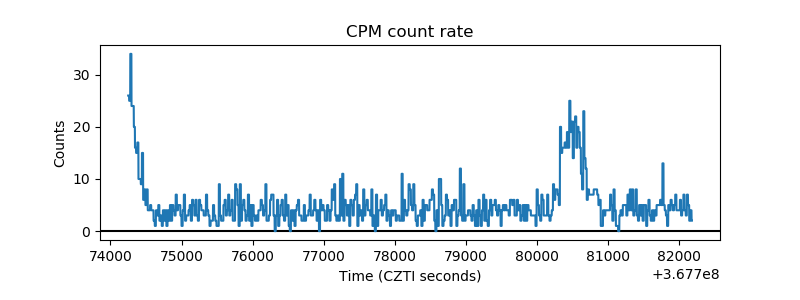 |
| CZT Counter |  |
| +2.5 Volts monitor |  |
| +5 Volts monitor |  |
| _ROLL_ROT |  |
| _Roll_DEC |  |
| _Roll_RA |  |
| Veto Counter | 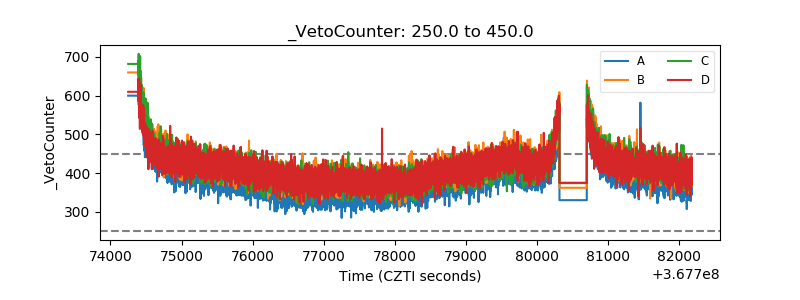 |