| Param | Original file | Final file |
|---|---|---|
| Filename | modeM0/AS1A10_058T12_9000004674_31981cztM0_level2.evt | modeM0/AS1A10_058T12_9000004674_31981cztM0_level2_quad_clean.evt |
| Size (bytes) | 655,712,640 | 93,703,680 |
| Size | 625.3 MB | 89.4 MB |
| Events in quadrant A | 3,651,321 | 605,819 |
| Events in quadrant B | 6,048,218 | 591,272 |
| Events in quadrant C | 4,042,671 | 576,856 |
| Events in quadrant D | 5,611,798 | 545,112 |
| Mode SS | |||
|---|---|---|---|
| Quadrant | BADHDUFLAG | Total packets | Discarded packets |
| A | 0 | 148 | 0 |
| B | 0 | 148 | 0 |
| C | 0 | 148 | 0 |
| D | 0 | 148 | 0 |
| Mode M0 | |||
|---|---|---|---|
| Quadrant | BADHDUFLAG | Total packets | Discarded packets |
| A | 0 | 15532 | 1 |
| B | 0 | 23415 | 1 |
| C | 0 | 16574 | 1 |
| D | 0 | 21779 | 1 |
| Mode M9 | |||
|---|---|---|---|
| Quadrant | BADHDUFLAG | Total packets | Discarded packets |
| A | 0 | 4 | 0 |
| B | 0 | 4 | 0 |
| C | 0 | 4 | 0 |
| D | 0 | 4 | 0 |
| Quadrant | Total seconds | Saturated seconds | Saturation percentage |
|---|---|---|---|
| A | 7460 | 87 | 1.166220% |
| B | 7461 | 308 | 4.128133% |
| C | 7461 | 248 | 3.323951% |
| D | 7461 | 692 | 9.274896% |
Noise dominated data is calculated using 1-second bins in cleaned event files. If a bin has >2000 counts, and if more than 50% of those come from <1% of pixels, then it is considered to be noise-dominated and hence unusable.
| Quadrant | # 1 sec bins | Bins with >0 counts | Bins with >2000 counts | High rate bins dominated by noise | Noise dominated (total time) | Noise dominated (detector-on time) | Marked lightcurve |
|---|---|---|---|---|---|---|---|
| A | 7770 | 7461 | 0 | 0 | 0.00% | 0.00% | 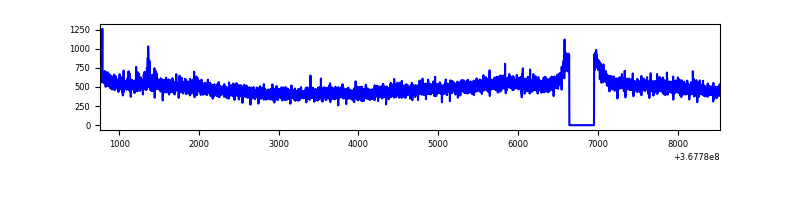 |
| B | 7771 | 7461 | 101 | 101 | 1.30% | 1.35% | 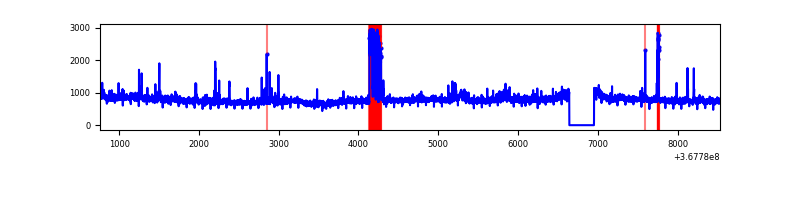 |
| C | 7771 | 7461 | 22 | 22 | 0.28% | 0.29% | 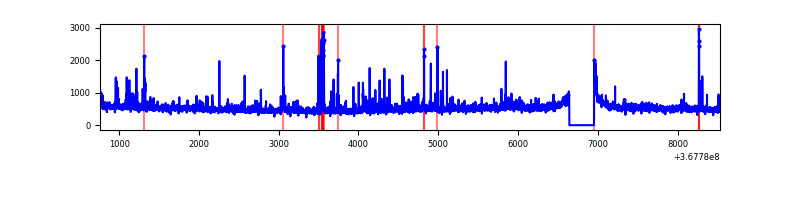 |
| D | 7771 | 7461 | 517 | 517 | 6.65% | 6.93% | 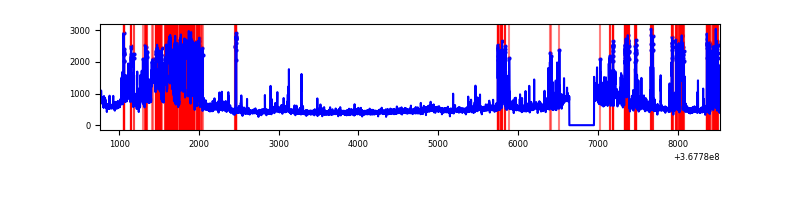 |
Top three noisy pixels from each quadrant. If the there are fewer than three noisy pixels in the level2.evt file, extra rows are filled as -1
| Pixel properties | Quadrant properties | ||||||
|---|---|---|---|---|---|---|---|
| Quadrant | DetID | PixID | Counts | Sigma | Mean | Median | Sigma |
| A | 14 | 238 | 20771 | 104.31 | 938 | 917 | 190.3 |
| A | 13 | 254 | 13506 | 66.14 | 938 | 917 | 190.3 |
| A | 3 | 137 | 9683 | 46.05 | 938 | 917 | 190.3 |
| B | 6 | 159 | 2025245 | 11293.79 | 917 | 892 | 179.2 |
| B | 10 | 245 | 270575 | 1504.55 | 917 | 892 | 179.2 |
| B | 0 | 190 | 47390 | 259.41 | 917 | 892 | 179.2 |
| C | 0 | 10 | 282048 | 1326.06 | 893 | 899 | 212.0 |
| C | 14 | 238 | 159898 | 749.93 | 893 | 899 | 212.0 |
| C | 3 | 233 | 71561 | 333.28 | 893 | 899 | 212.0 |
| D | 13 | 249 | 1357649 | 6381.64 | 875 | 852 | 212.6 |
| D | 8 | 195 | 388743 | 1824.43 | 875 | 852 | 212.6 |
| D | 2 | 250 | 231151 | 1083.2 | 875 | 852 | 212.6 |
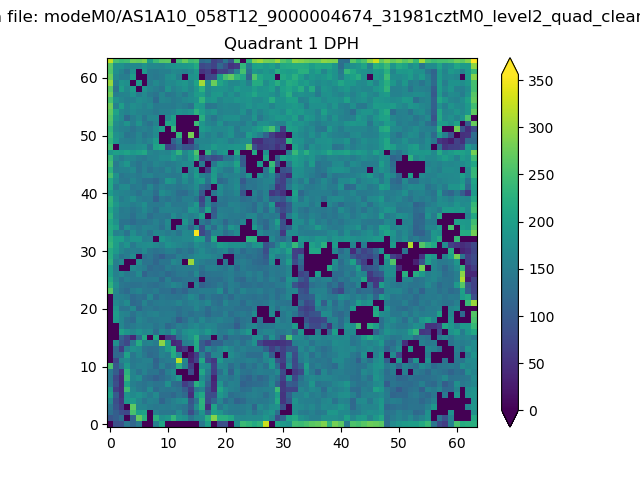
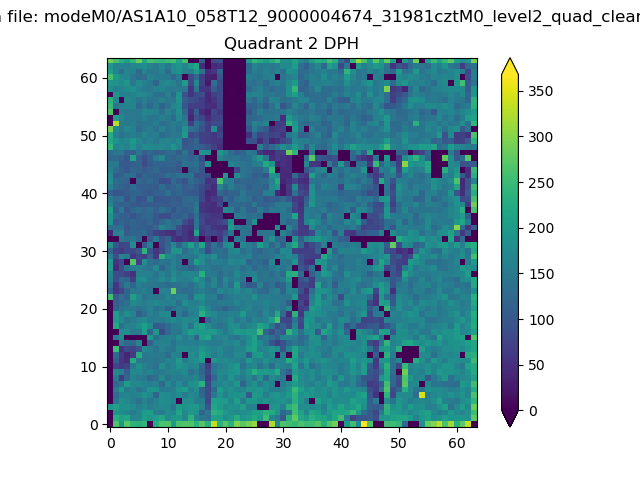
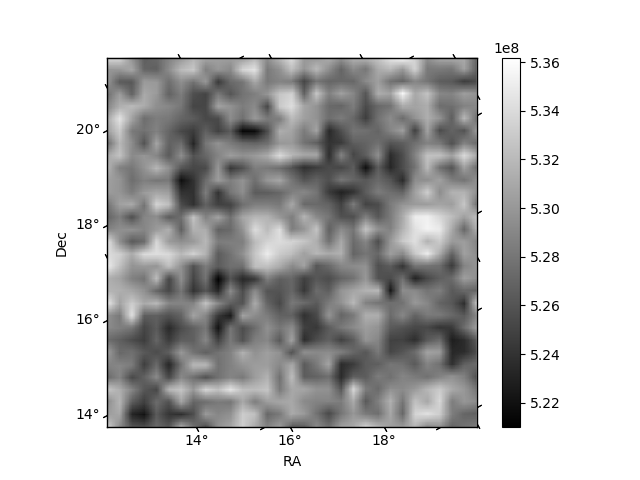
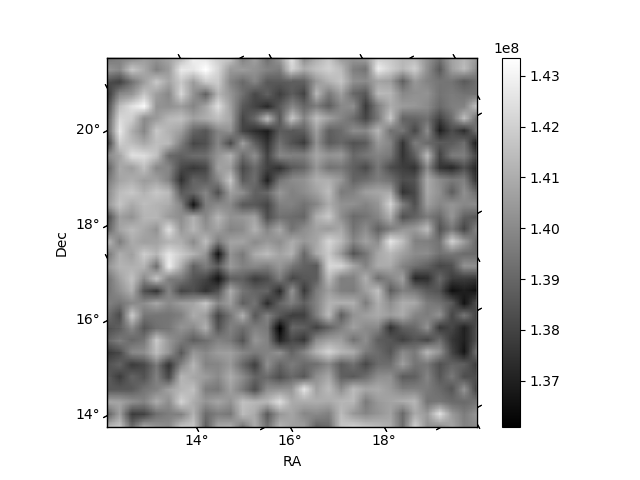
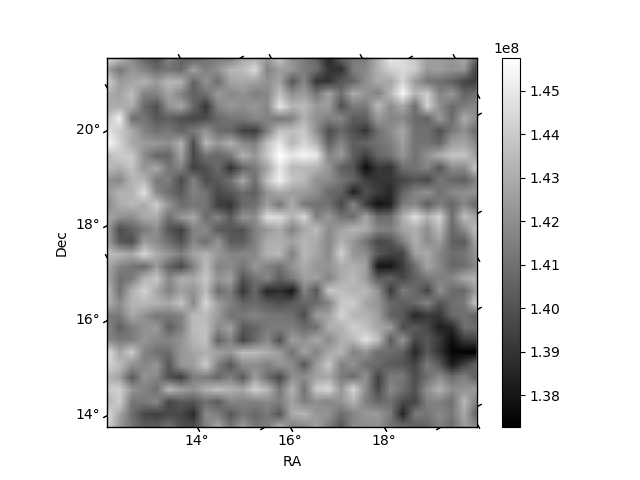
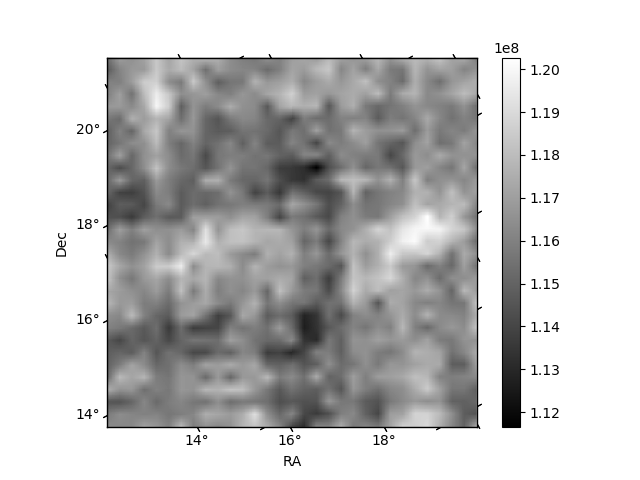
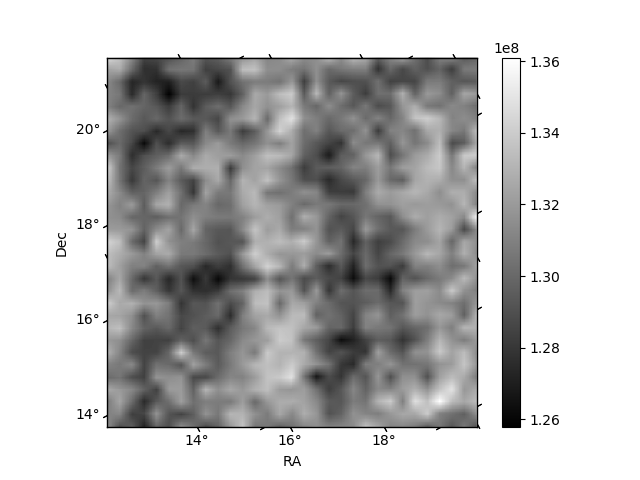
Histogram calculated using DETX and DETY for each event in the final _common_clean file
| Quadrant A |  |
 |
Quadrant B |
|---|---|---|---|
| Quadrant D | 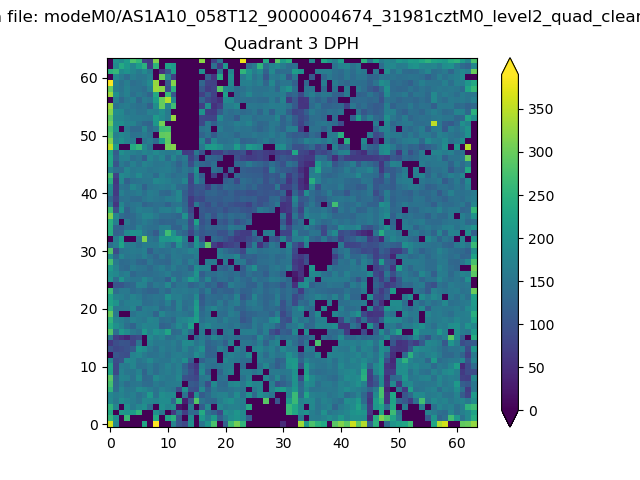 |
 |
Quadrant C |
| Plot type | Count rate plots | Images |
|---|---|---|
| Comparison with Poisson distribution Blue bars denote a histogram of data divided into 1 sec bins. Red curve is a Poisson curve with rate = median count rate of data. |
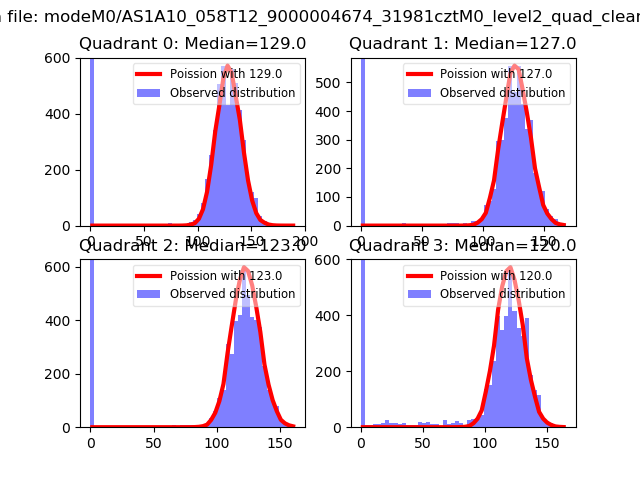 |
 |
| Quadrant-wise count rates Data is divided into 100 sec bins |
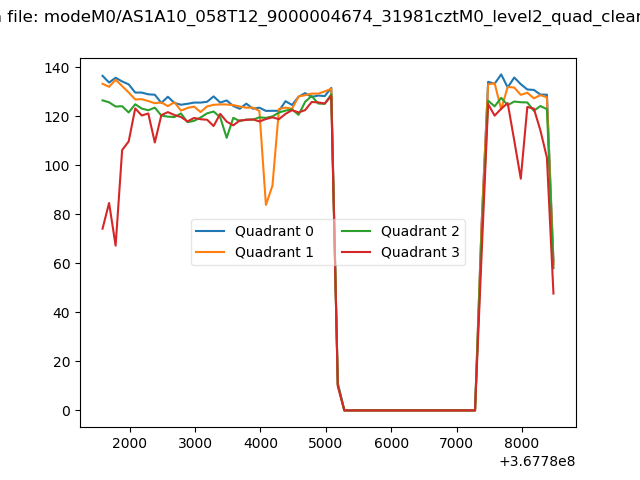 |
|
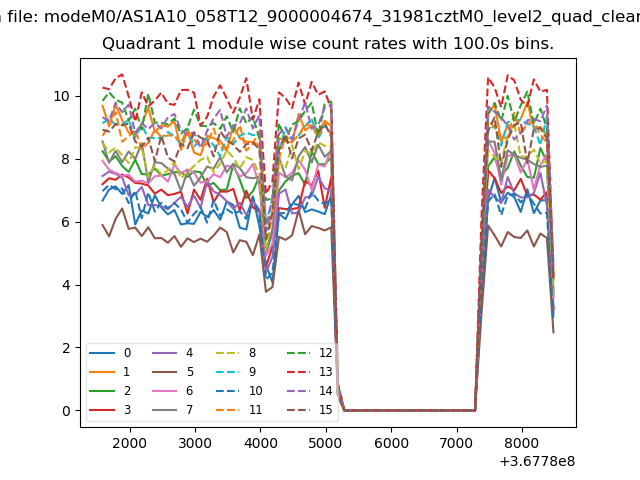
| Module-wise count rates for Quadrant A Data is divided into 100 sec bins |
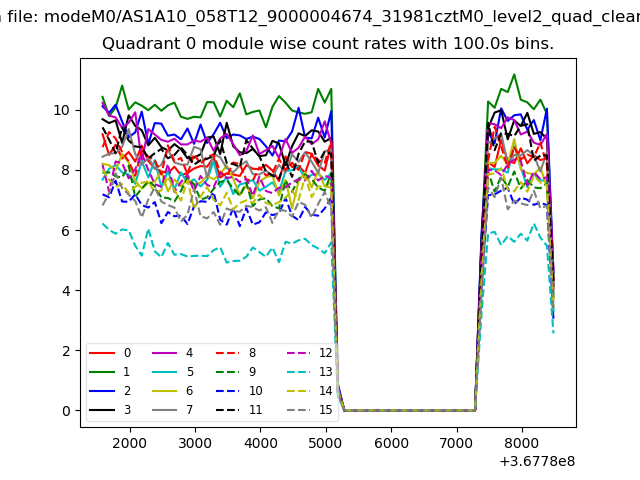 |
 |
| Module-wise count rates for Quadrant B Data is divided into 100 sec bins |
 |
 |
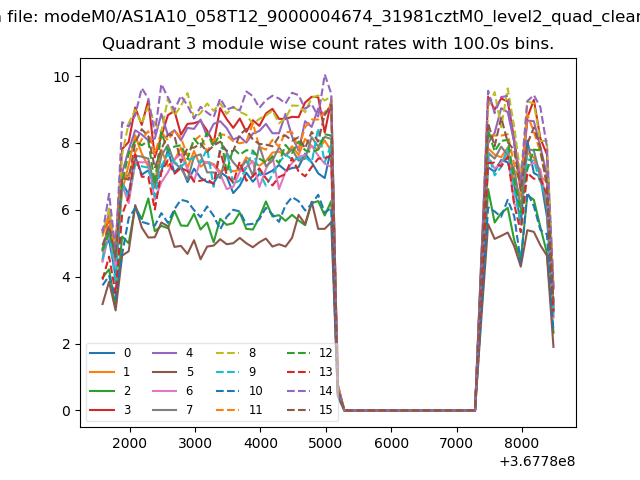
| Module-wise count rates for Quadrant C Data is divided into 100 sec bins |
 |
 |
| Module-wise count rates for Quadrant D Data is divided into 100 sec bins |
 |
 |
| Parameter | Plot |
|---|---|
| CZT HV Monitor | 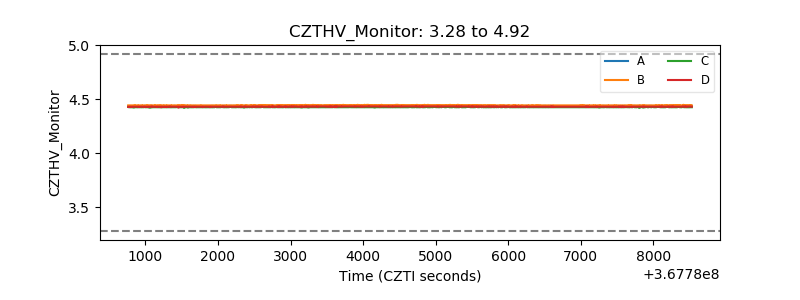 |
| D_VDD | 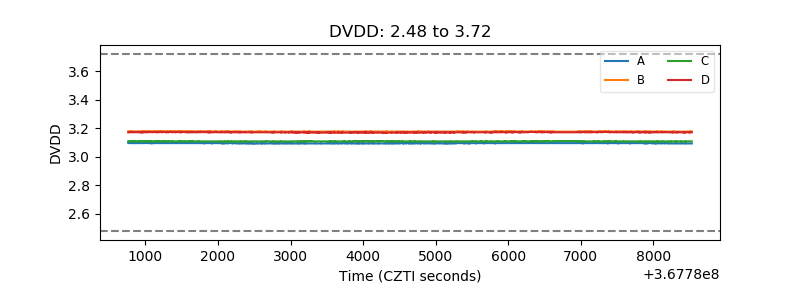 |
| Temperature 1 | 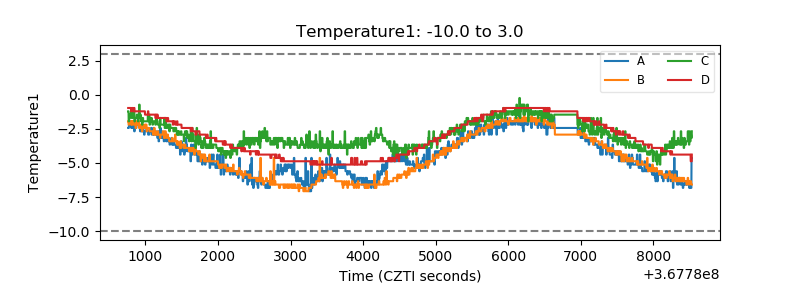 |
| Veto HV Monitor | 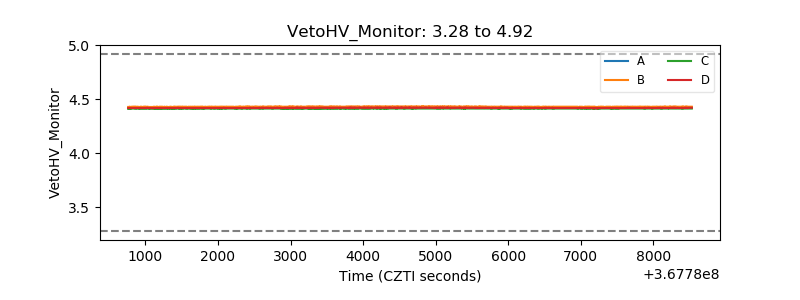 |
| Veto LLD | 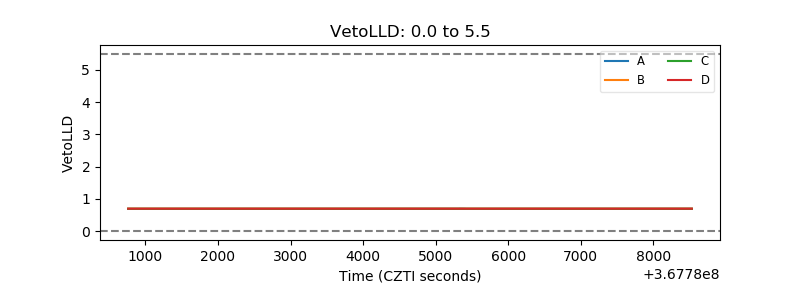 |
| Alpha Counter | 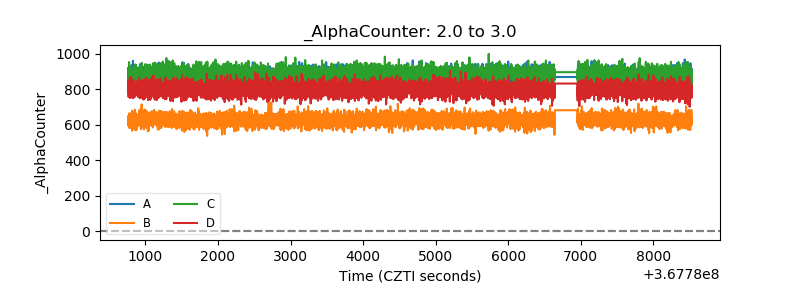 |
| _CPM_Rate | 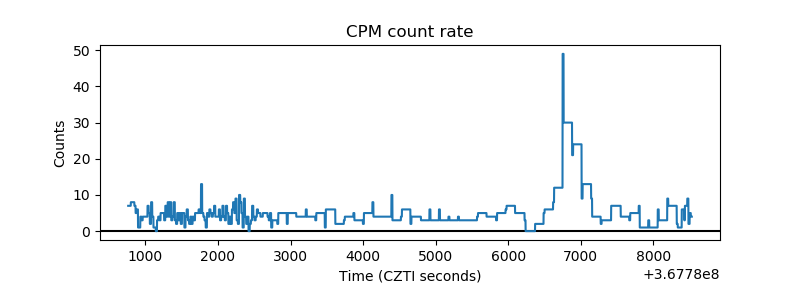 |
| CZT Counter | 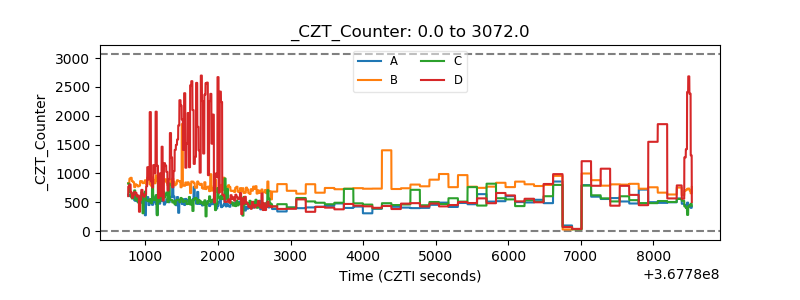 |
| +2.5 Volts monitor |  |
| +5 Volts monitor |  |
| _ROLL_ROT | 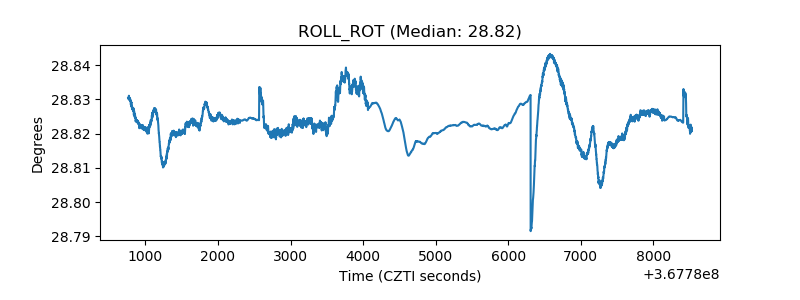 |
| _Roll_DEC | 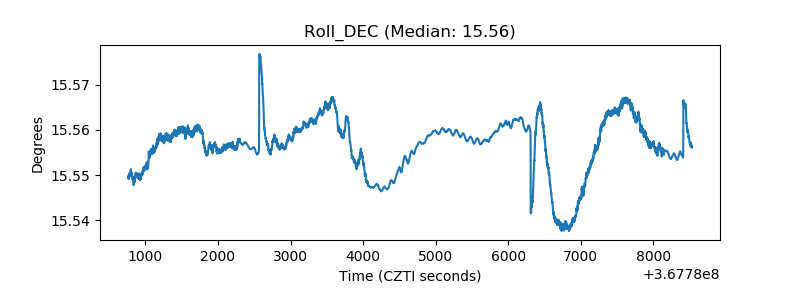 |
| _Roll_RA | 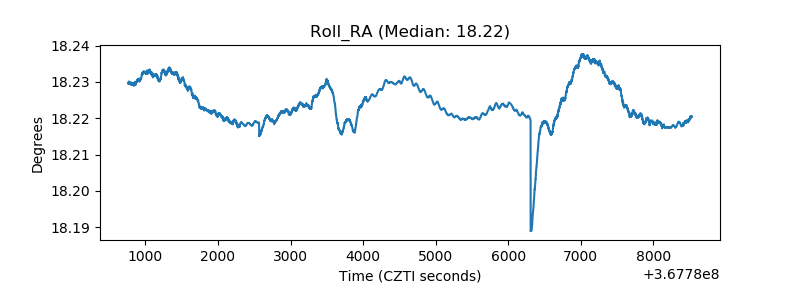 |
| Veto Counter | 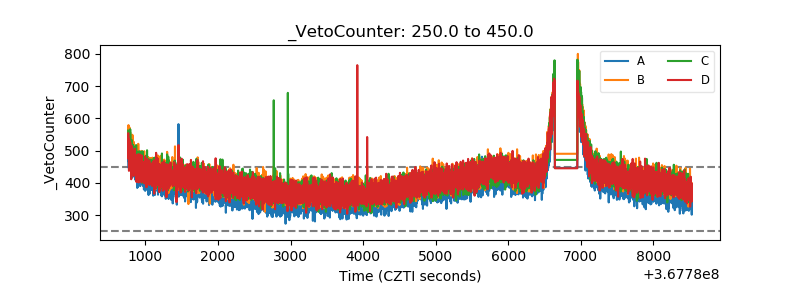 |