| Param | Original file | Final file |
|---|---|---|
| Filename | modeM0/AS1A10_058T12_9000004674_31985cztM0_level2.evt | modeM0/AS1A10_058T12_9000004674_31985cztM0_level2_quad_clean.evt |
| Size (bytes) | 540,000,000 | 91,278,720 |
| Size | 515.0 MB | 87.1 MB |
| Events in quadrant A | 3,155,964 | 592,883 |
| Events in quadrant B | 4,954,405 | 589,391 |
| Events in quadrant C | 3,422,813 | 565,805 |
| Events in quadrant D | 4,371,358 | 553,607 |
| Mode SS | |||
|---|---|---|---|
| Quadrant | BADHDUFLAG | Total packets | Discarded packets |
| A | 0 | 134 | 0 |
| B | 0 | 134 | 0 |
| C | 0 | 134 | 0 |
| D | 0 | 134 | 0 |
| Mode M0 | |||
|---|---|---|---|
| Quadrant | BADHDUFLAG | Total packets | Discarded packets |
| A | 0 | 13604 | 1 |
| B | 0 | 20038 | 3 |
| C | 0 | 14293 | 1 |
| D | 0 | 17370 | 1 |
| Mode M9 | |||
|---|---|---|---|
| Quadrant | BADHDUFLAG | Total packets | Discarded packets |
| A | 0 | 10 | 0 |
| B | 0 | 10 | 0 |
| C | 0 | 10 | 0 |
| D | 0 | 10 | 0 |
| Quadrant | Total seconds | Saturated seconds | Saturation percentage |
|---|---|---|---|
| A | 6637 | 47 | 0.708151% |
| B | 6636 | 106 | 1.597348% |
| C | 6636 | 146 | 2.200121% |
| D | 6636 | 100 | 1.506932% |
Noise dominated data is calculated using 1-second bins in cleaned event files. If a bin has >2000 counts, and if more than 50% of those come from <1% of pixels, then it is considered to be noise-dominated and hence unusable.
| Quadrant | # 1 sec bins | Bins with >0 counts | Bins with >2000 counts | High rate bins dominated by noise | Noise dominated (total time) | Noise dominated (detector-on time) | Marked lightcurve |
|---|---|---|---|---|---|---|---|
| A | 7607 | 6637 | 0 | 0 | 0.00% | 0.00% | 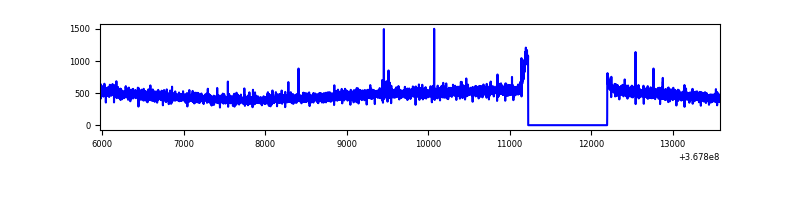 |
| B | 7606 | 6636 | 6 | 6 | 0.08% | 0.09% | 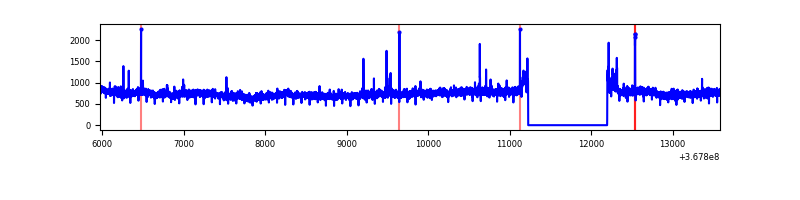 |
| C | 7606 | 6636 | 12 | 12 | 0.16% | 0.18% | 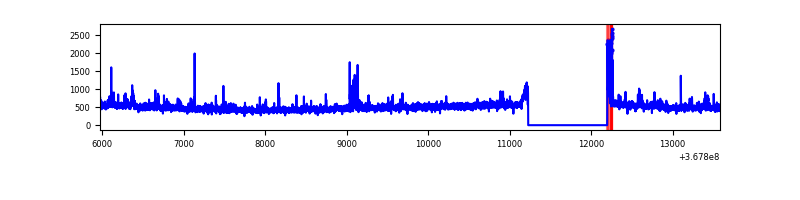 |
| D | 7606 | 6636 | 46 | 46 | 0.60% | 0.69% | 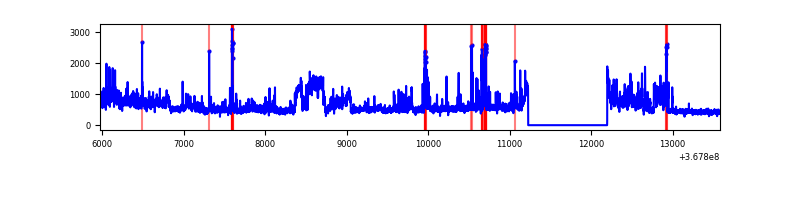 |
Top three noisy pixels from each quadrant. If the there are fewer than three noisy pixels in the level2.evt file, extra rows are filled as -1
| Pixel properties | Quadrant properties | ||||||
|---|---|---|---|---|---|---|---|
| Quadrant | DetID | PixID | Counts | Sigma | Mean | Median | Sigma |
| A | 13 | 254 | 12668 | 72.28 | 815 | 801 | 164.2 |
| A | 14 | 238 | 9462 | 52.75 | 815 | 801 | 164.2 |
| A | 3 | 137 | 8526 | 47.05 | 815 | 801 | 164.2 |
| B | 6 | 159 | 1698714 | 10954.21 | 806 | 785 | 155.0 |
| B | 0 | 190 | 29309 | 184.02 | 806 | 785 | 155.0 |
| B | 0 | 213 | 21274 | 132.18 | 806 | 785 | 155.0 |
| C | 14 | 238 | 131261 | 710.8 | 778 | 781 | 183.6 |
| C | 3 | 233 | 112509 | 608.65 | 778 | 781 | 183.6 |
| C | 0 | 207 | 75632 | 407.76 | 778 | 781 | 183.6 |
| D | 8 | 195 | 934335 | 4989.51 | 781 | 761 | 187.1 |
| D | 2 | 250 | 238413 | 1270.14 | 781 | 761 | 187.1 |
| D | 7 | 238 | 133509 | 709.48 | 781 | 761 | 187.1 |
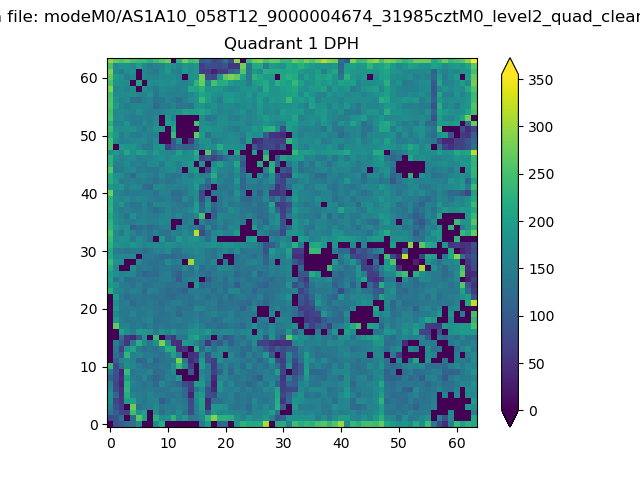
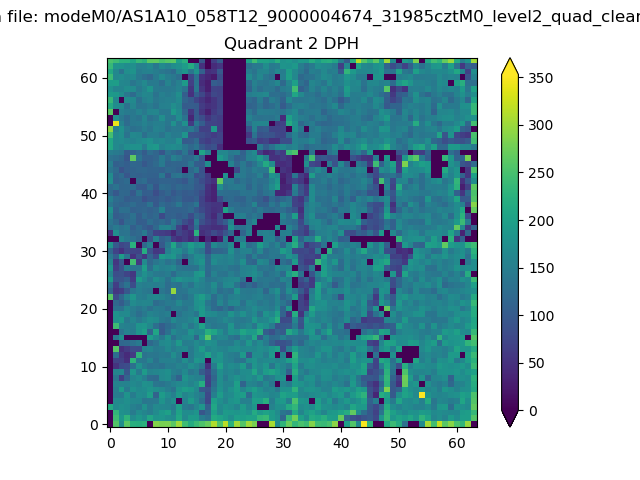
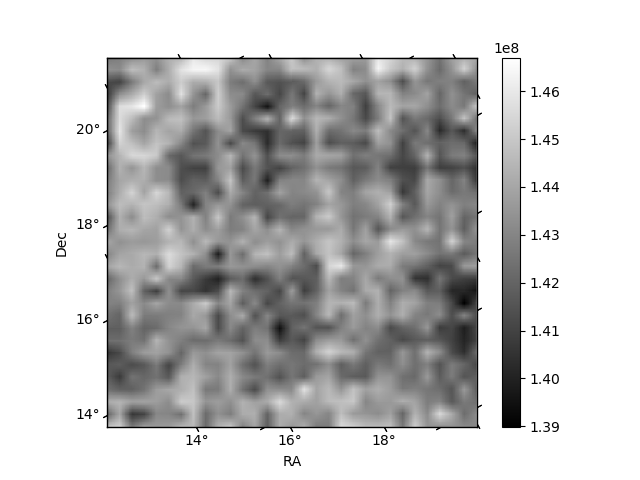
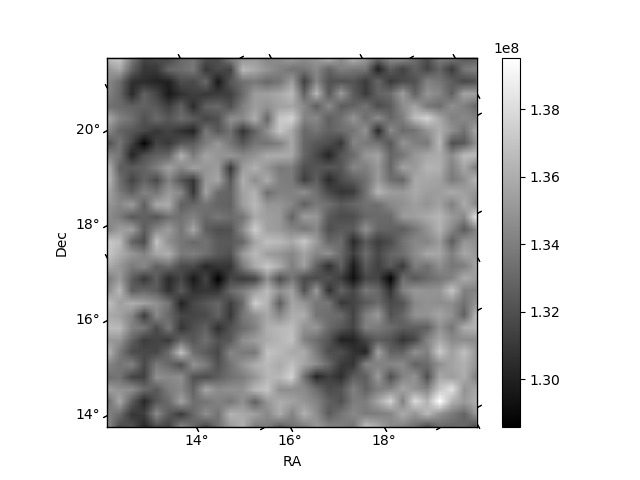
Histogram calculated using DETX and DETY for each event in the final _common_clean file
| Quadrant A |  |
 |
Quadrant B |
|---|---|---|---|
| Quadrant D | 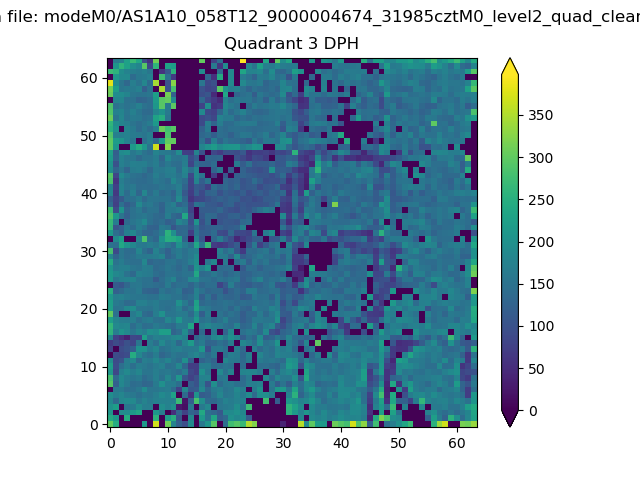 |
 |
Quadrant C |
| Plot type | Count rate plots | Images |
|---|---|---|
| Comparison with Poisson distribution Blue bars denote a histogram of data divided into 1 sec bins. Red curve is a Poisson curve with rate = median count rate of data. |
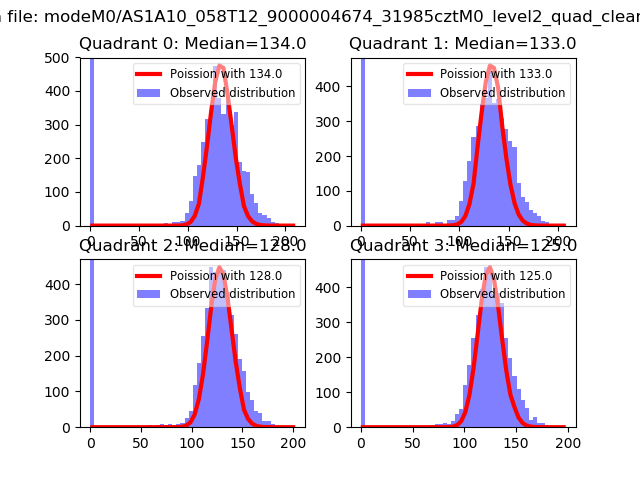 |
 |
| Quadrant-wise count rates Data is divided into 100 sec bins |
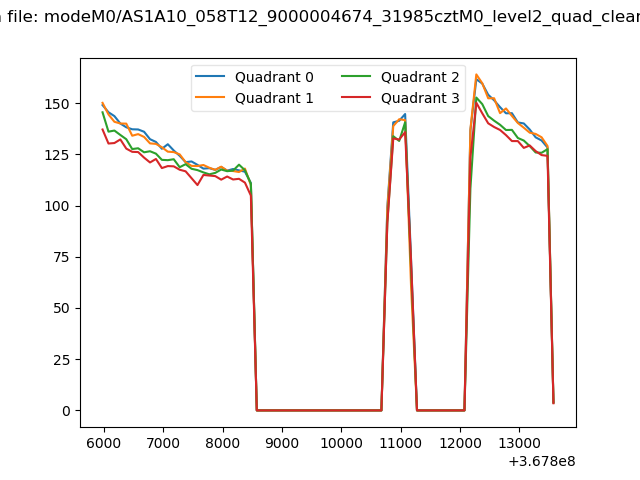 |
|
| Module-wise count rates for Quadrant A Data is divided into 100 sec bins |
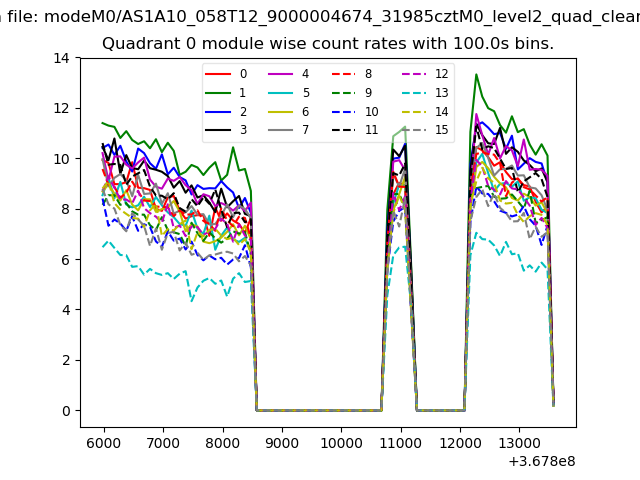 |
 |
| Module-wise count rates for Quadrant B Data is divided into 100 sec bins |
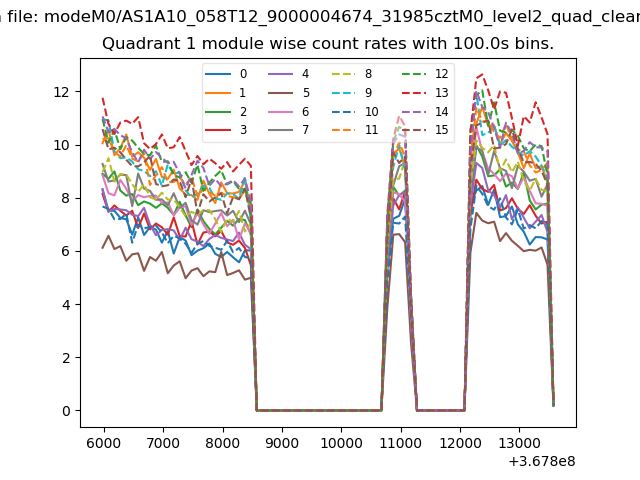 |
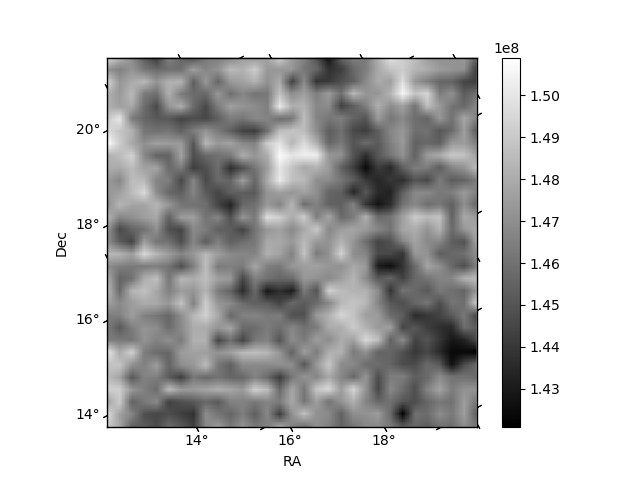 |
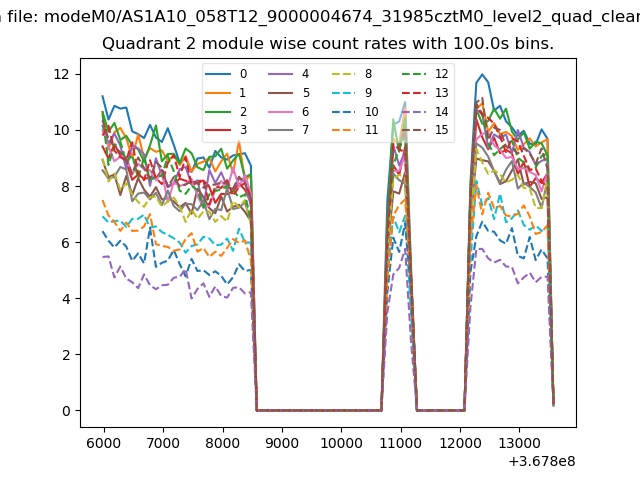
| Module-wise count rates for Quadrant C Data is divided into 100 sec bins |
 |
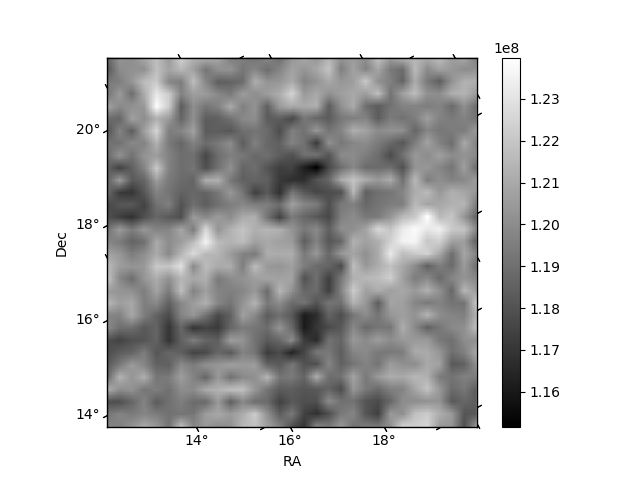 |
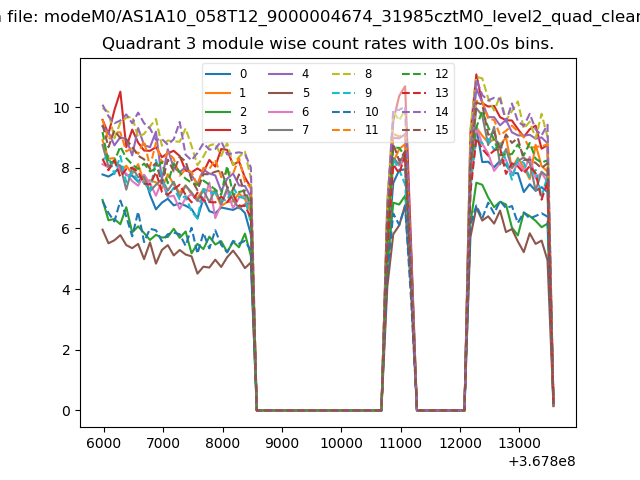
| Module-wise count rates for Quadrant D Data is divided into 100 sec bins |
 |
 |
| Parameter | Plot |
|---|---|
| CZT HV Monitor | 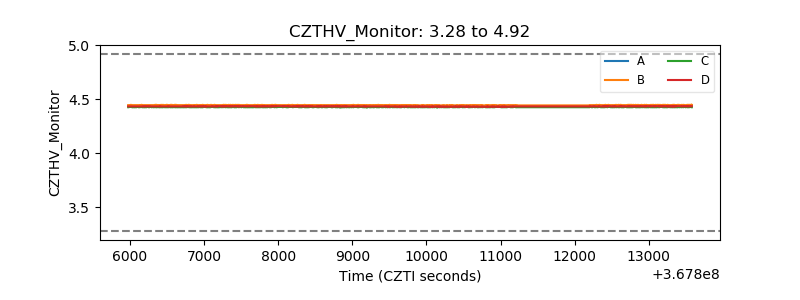 |
| D_VDD | 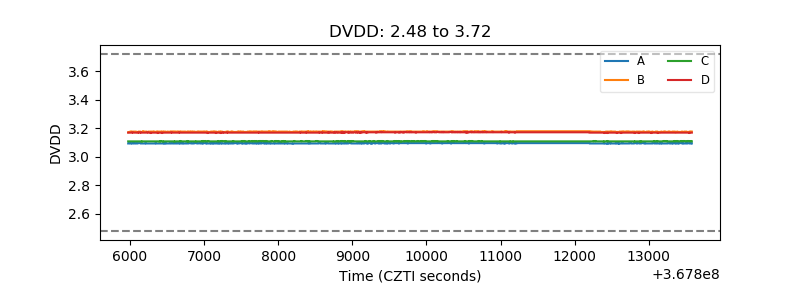 |
| Temperature 1 | 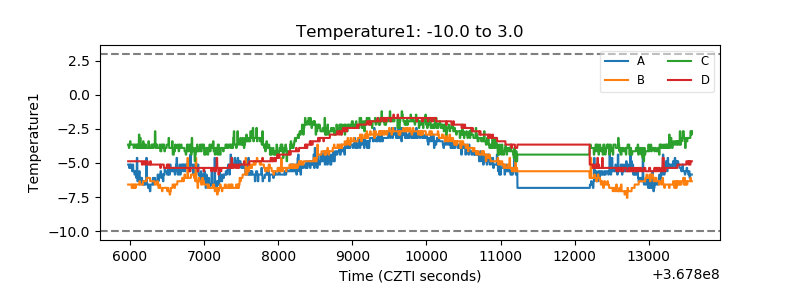 |
| Veto HV Monitor | 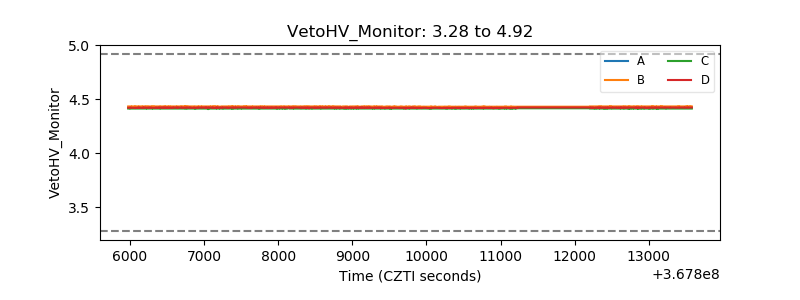 |
| Veto LLD | 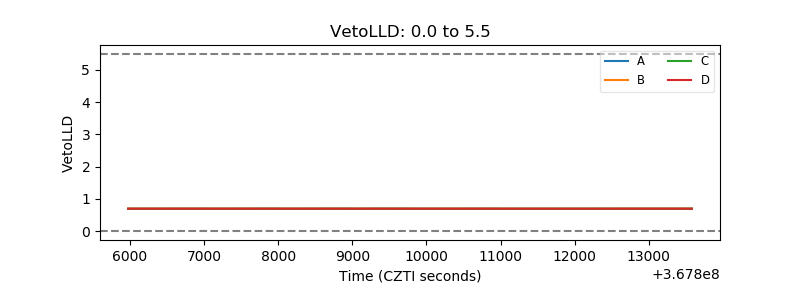 |
| Alpha Counter | 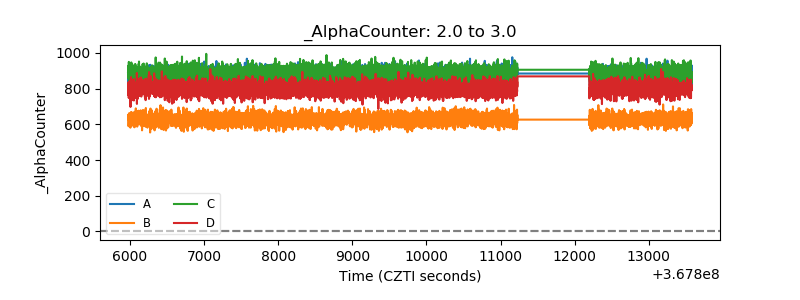 |
| _CPM_Rate | 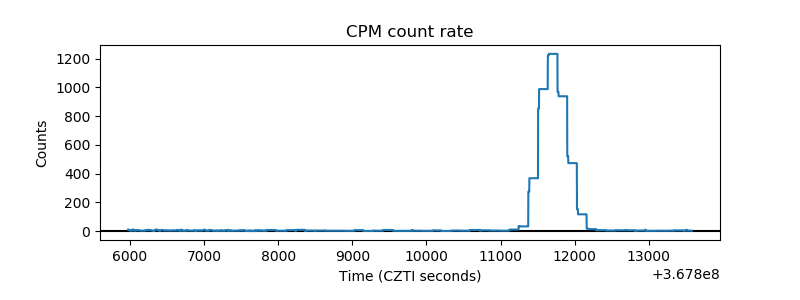 |
| CZT Counter | 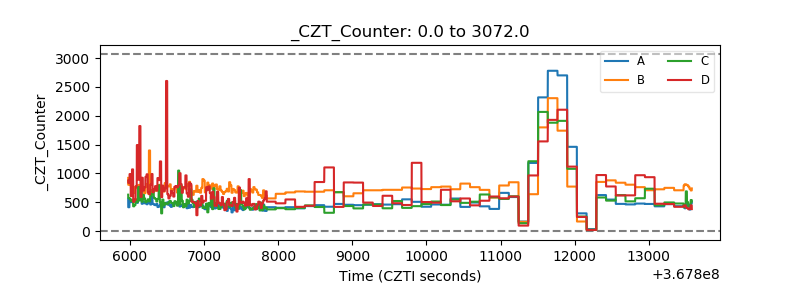 |
| +2.5 Volts monitor |  |
| +5 Volts monitor |  |
| _ROLL_ROT | 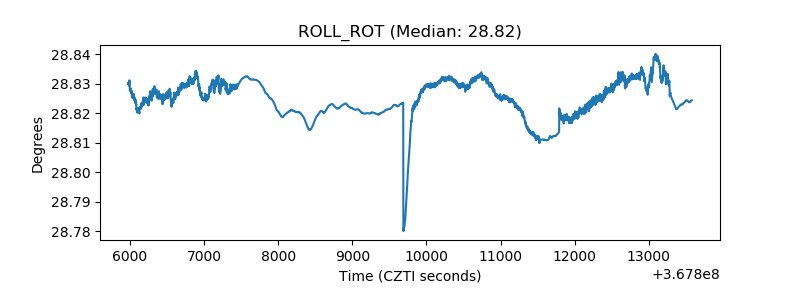 |
| _Roll_DEC | 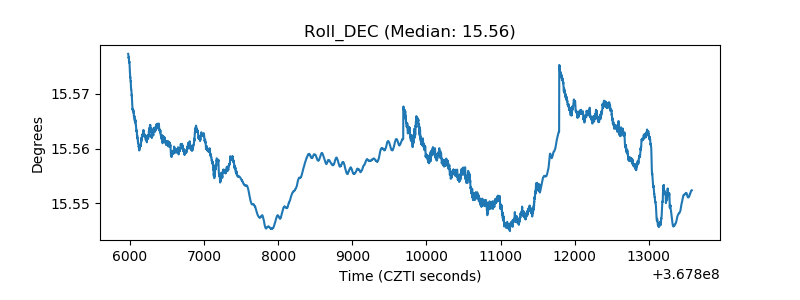 |
| _Roll_RA |  |
| Veto Counter | 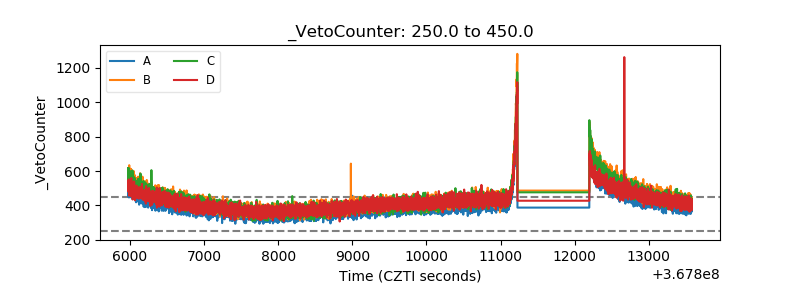 |