| Param | Original file | Final file |
|---|---|---|
| Filename | modeM0/AS1A10_058T12_9000004674_31988cztM0_level2.evt | modeM0/AS1A10_058T12_9000004674_31988cztM0_level2_quad_clean.evt |
| Size (bytes) | 974,776,320 | 163,952,640 |
| Size | 929.6 MB | 156.4 MB |
| Events in quadrant A | 5,959,882 | 1,072,787 |
| Events in quadrant B | 9,439,764 | 1,062,676 |
| Events in quadrant C | 6,723,444 | 1,007,964 |
| Events in quadrant D | 6,600,392 | 1,004,710 |
| Mode SS | |||
|---|---|---|---|
| Quadrant | BADHDUFLAG | Total packets | Discarded packets |
| A | 0 | 240 | 0 |
| B | 0 | 240 | 0 |
| C | 0 | 240 | 0 |
| D | 0 | 240 | 0 |
| Mode M0 | |||
|---|---|---|---|
| Quadrant | BADHDUFLAG | Total packets | Discarded packets |
| A | 0 | 24649 | 3 |
| B | 0 | 36689 | 3 |
| C | 0 | 27208 | 4 |
| D | 0 | 26860 | 3 |
| Mode M9 | |||
|---|---|---|---|
| Quadrant | BADHDUFLAG | Total packets | Discarded packets |
| A | 0 | 23 | 0 |
| B | 0 | 23 | 0 |
| C | 0 | 23 | 0 |
| D | 0 | 23 | 0 |
| Quadrant | Total seconds | Saturated seconds | Saturation percentage |
|---|---|---|---|
| A | 11820 | 64 | 0.541455% |
| B | 11821 | 246 | 2.081042% |
| C | 11820 | 322 | 2.724196% |
| D | 11820 | 52 | 0.439932% |
Noise dominated data is calculated using 1-second bins in cleaned event files. If a bin has >2000 counts, and if more than 50% of those come from <1% of pixels, then it is considered to be noise-dominated and hence unusable.
| Quadrant | # 1 sec bins | Bins with >0 counts | Bins with >2000 counts | High rate bins dominated by noise | Noise dominated (total time) | Noise dominated (detector-on time) | Marked lightcurve |
|---|---|---|---|---|---|---|---|
| A | 14120 | 11820 | 0 | 0 | 0.00% | 0.00% | 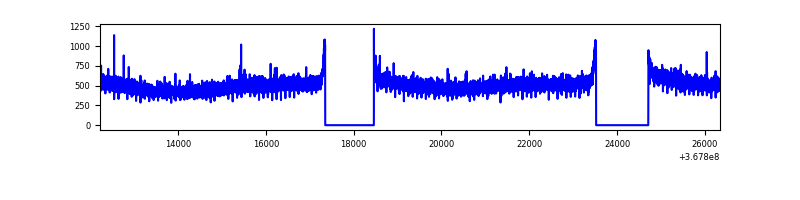 |
| B | 14121 | 11821 | 74 | 74 | 0.52% | 0.63% | 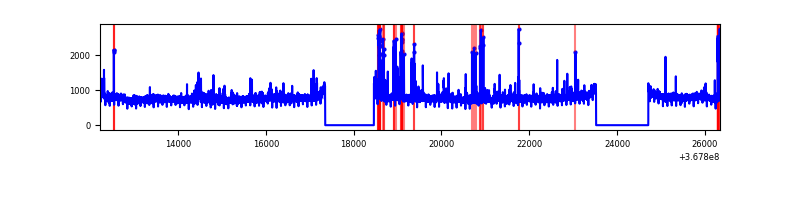 |
| C | 14120 | 11820 | 54 | 54 | 0.38% | 0.46% | 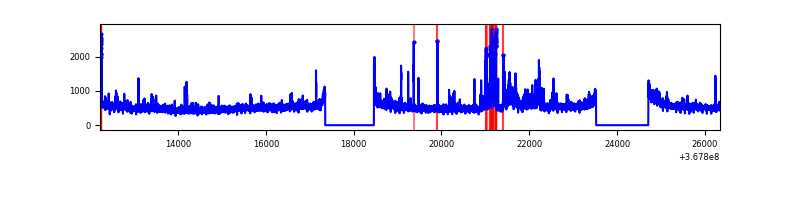 |
| D | 14120 | 11820 | 17 | 17 | 0.12% | 0.14% | 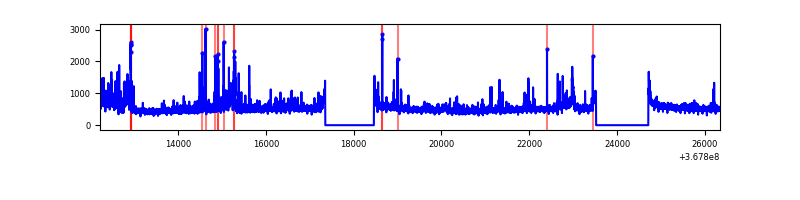 |
Top three noisy pixels from each quadrant. If the there are fewer than three noisy pixels in the level2.evt file, extra rows are filled as -1
| Pixel properties | Quadrant properties | ||||||
|---|---|---|---|---|---|---|---|
| Quadrant | DetID | PixID | Counts | Sigma | Mean | Median | Sigma |
| A | 13 | 254 | 21754 | 66.47 | 1542 | 1516 | 304.5 |
| A | 3 | 137 | 15394 | 45.58 | 1542 | 1516 | 304.5 |
| A | 0 | 226 | 12875 | 37.31 | 1542 | 1516 | 304.5 |
| B | 6 | 159 | 3016891 | 10642.46 | 1504 | 1470 | 283.3 |
| B | 10 | 245 | 351280 | 1234.6 | 1504 | 1470 | 283.3 |
| B | 0 | 190 | 67021 | 231.35 | 1504 | 1470 | 283.3 |
| C | 10 | 22 | 446755 | 1336.95 | 1439 | 1452 | 333.1 |
| C | 14 | 238 | 273068 | 815.48 | 1439 | 1452 | 333.1 |
| C | 3 | 233 | 138642 | 411.89 | 1439 | 1452 | 333.1 |
| D | 8 | 195 | 654034 | 1890.14 | 1474 | 1436 | 345.3 |
| D | 7 | 238 | 142343 | 408.11 | 1474 | 1436 | 345.3 |
| D | 12 | 233 | 96883 | 276.45 | 1474 | 1436 | 345.3 |
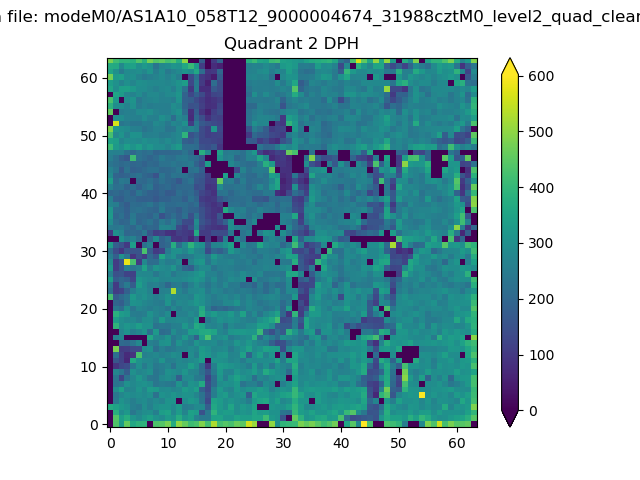
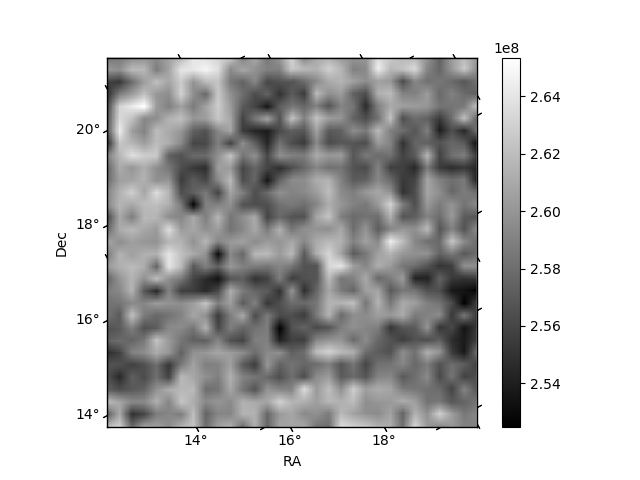
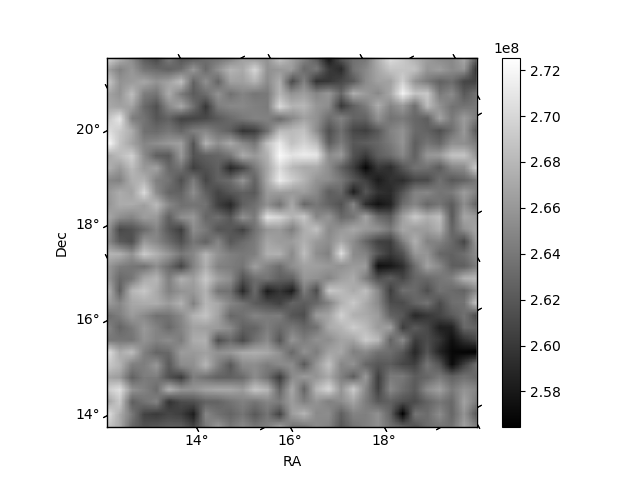
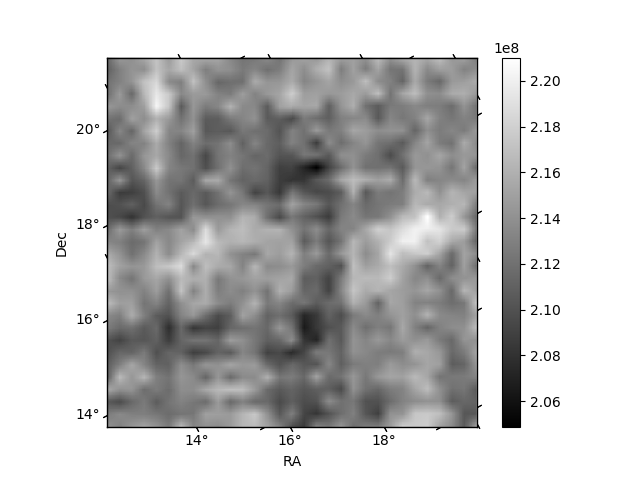
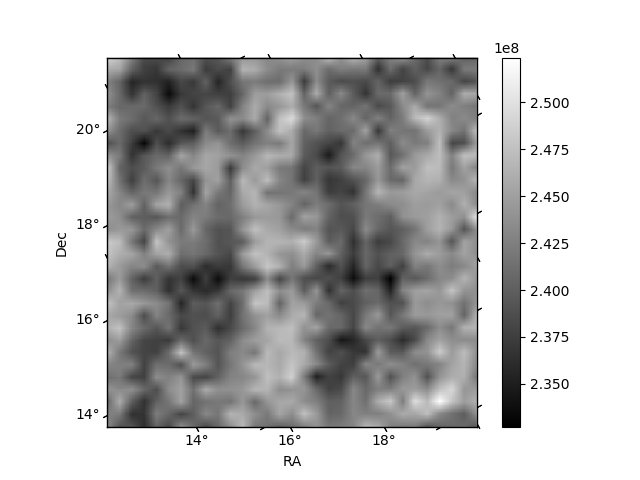
Histogram calculated using DETX and DETY for each event in the final _common_clean file
| Quadrant A | 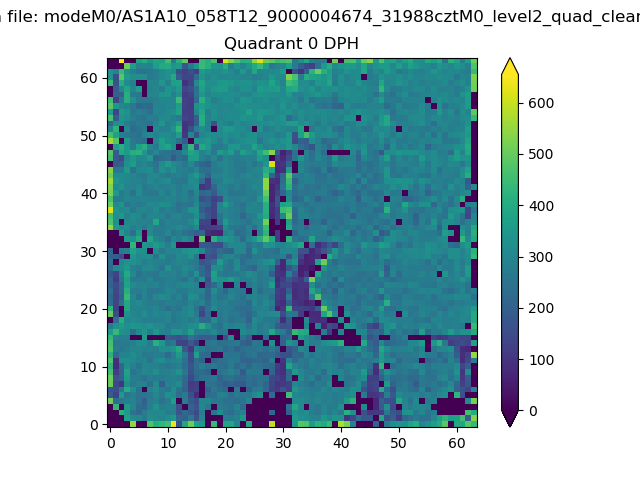 |
 |
Quadrant B |
|---|---|---|---|
| Quadrant D |  |
 |
Quadrant C |
| Plot type | Count rate plots | Images |
|---|---|---|
| Comparison with Poisson distribution Blue bars denote a histogram of data divided into 1 sec bins. Red curve is a Poisson curve with rate = median count rate of data. |
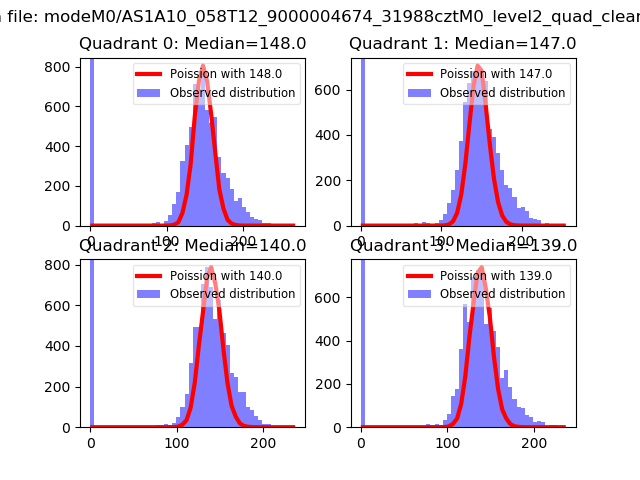 |
 |
| Quadrant-wise count rates Data is divided into 100 sec bins |
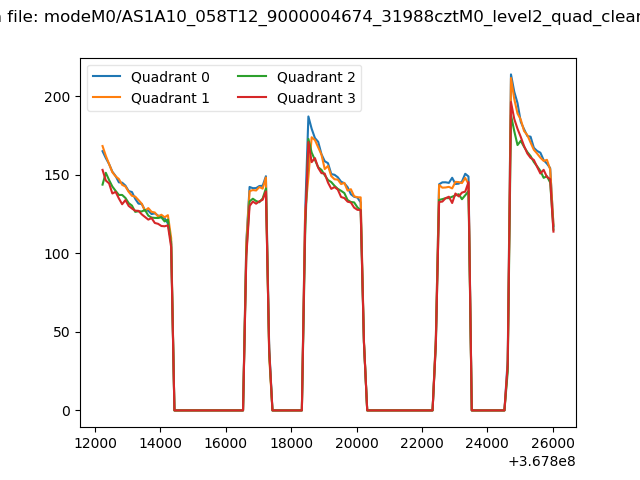 |
|
| Module-wise count rates for Quadrant A Data is divided into 100 sec bins |
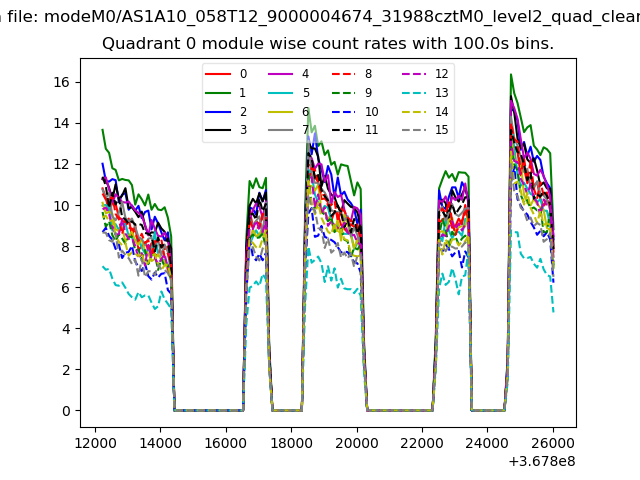 |
 |
| Module-wise count rates for Quadrant B Data is divided into 100 sec bins |
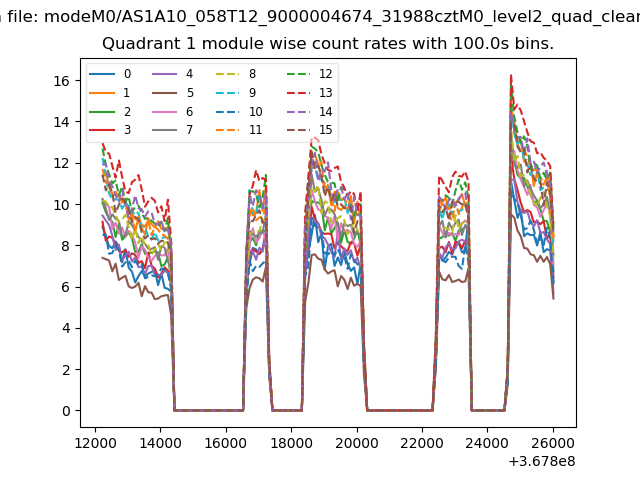 |
 |
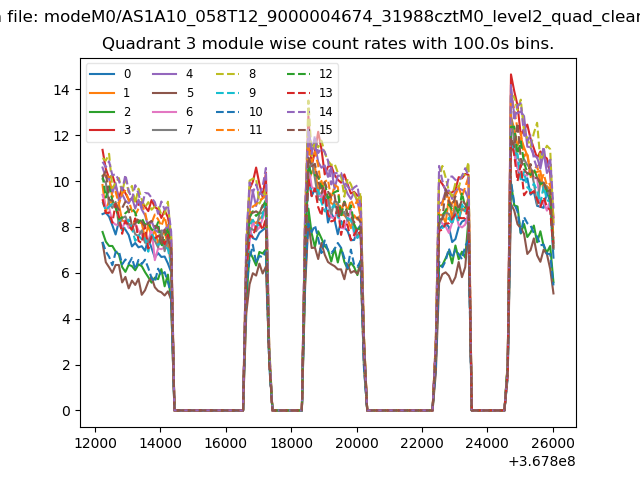
| Module-wise count rates for Quadrant C Data is divided into 100 sec bins |
 |
 |
| Module-wise count rates for Quadrant D Data is divided into 100 sec bins |
 |
 |
| Parameter | Plot |
|---|---|
| CZT HV Monitor | 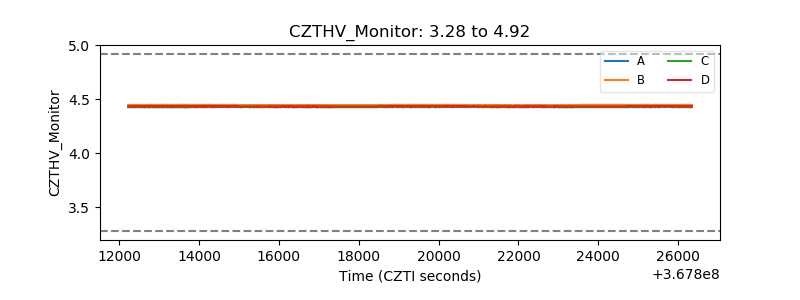 |
| D_VDD | 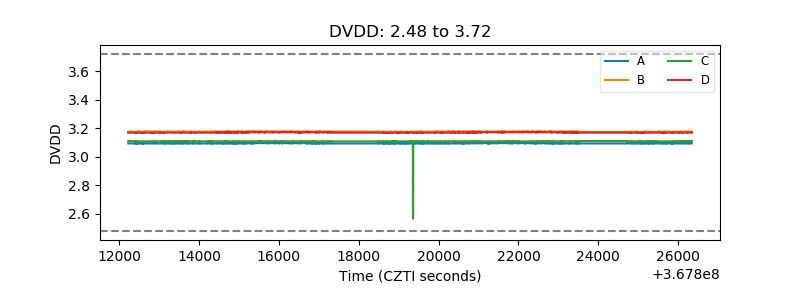 |
| Temperature 1 | 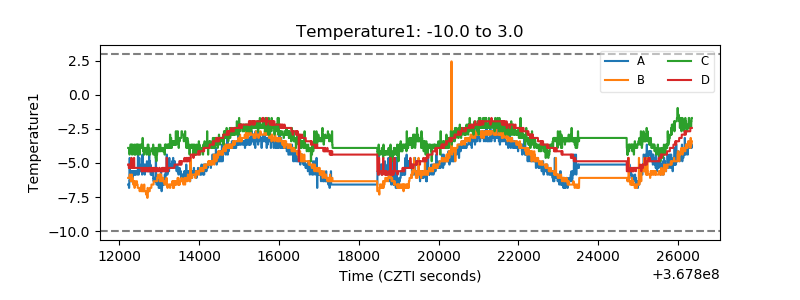 |
| Veto HV Monitor | 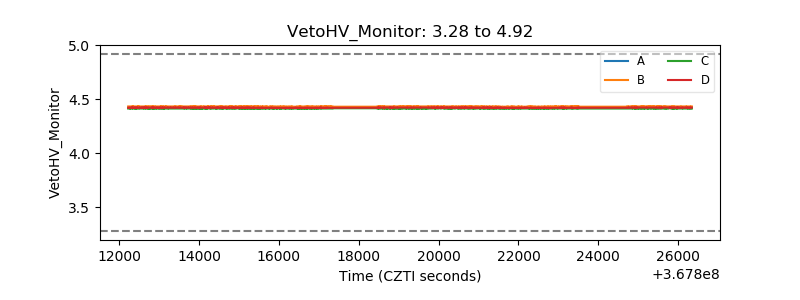 |
| Veto LLD | 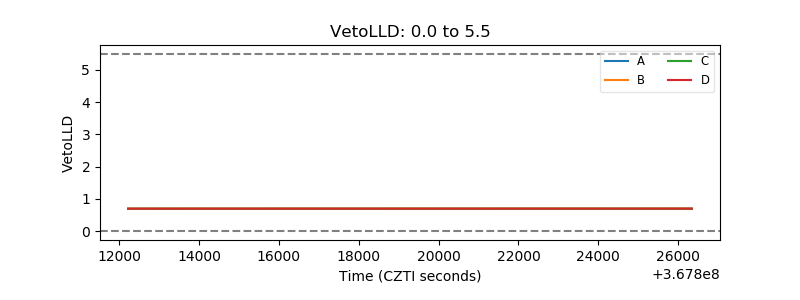 |
| Alpha Counter | 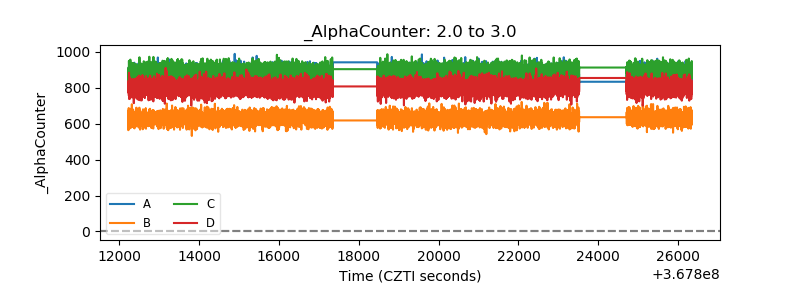 |
| _CPM_Rate | 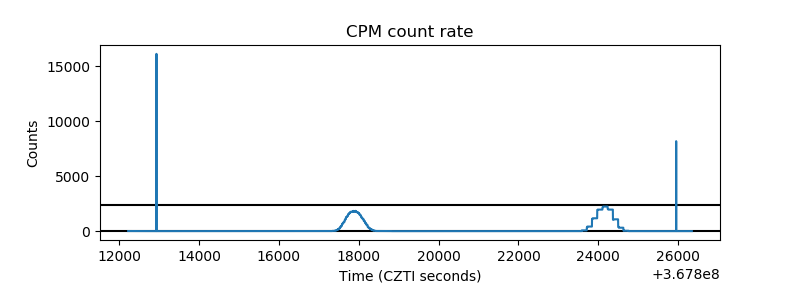 |
| CZT Counter | 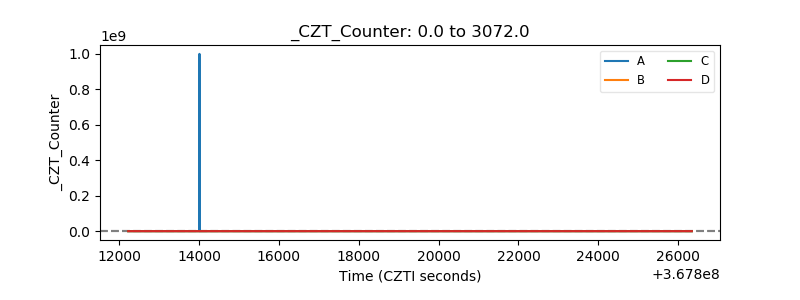 |
| +2.5 Volts monitor |  |
| +5 Volts monitor | 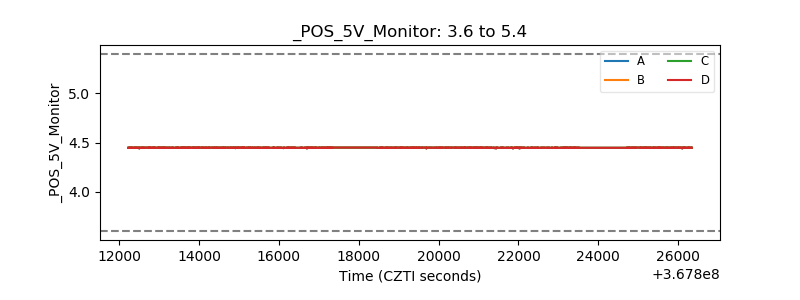 |
| _ROLL_ROT | 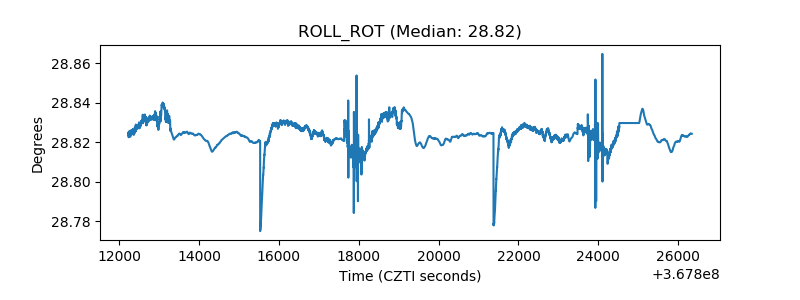 |
| _Roll_DEC | 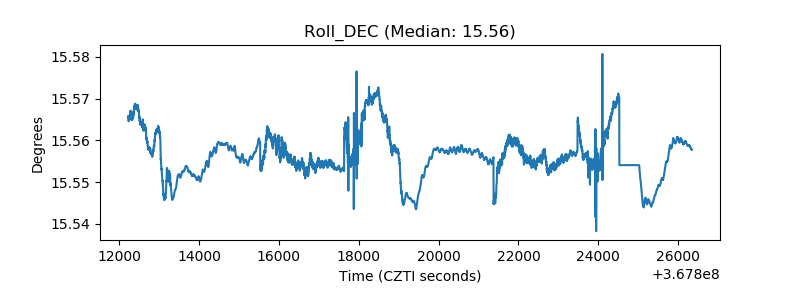 |
| _Roll_RA | 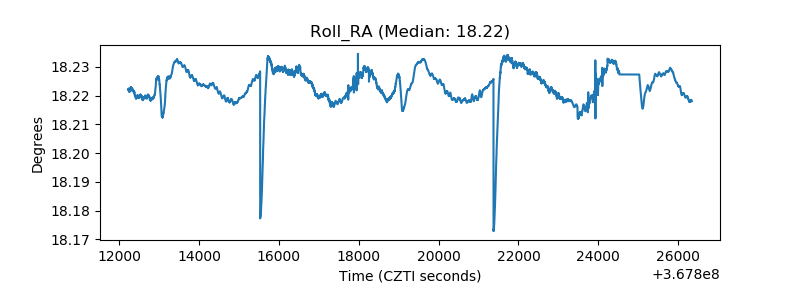 |
| Veto Counter |  |