| Param | Original file | Final file |
|---|---|---|
| Filename | modeM0/AS1A10_058T12_9000004674_31990cztM0_level2.evt | modeM0/AS1A10_058T12_9000004674_31990cztM0_level2_quad_clean.evt |
| Size (bytes) | 527,633,280 | 72,884,160 |
| Size | 503.2 MB | 69.5 MB |
| Events in quadrant A | 3,293,022 | 464,912 |
| Events in quadrant B | 5,072,423 | 456,137 |
| Events in quadrant C | 3,676,181 | 430,507 |
| Events in quadrant D | 3,532,739 | 437,412 |
| Mode SS | |||
|---|---|---|---|
| Quadrant | BADHDUFLAG | Total packets | Discarded packets |
| A | 0 | 120 | 0 |
| B | 0 | 120 | 0 |
| C | 0 | 120 | 0 |
| D | 0 | 120 | 0 |
| Mode M0 | |||
|---|---|---|---|
| Quadrant | BADHDUFLAG | Total packets | Discarded packets |
| A | 0 | 13097 | 1 |
| B | 0 | 18963 | 2 |
| C | 0 | 14659 | 1 |
| D | 0 | 13917 | 1 |
| Mode M9 | |||
|---|---|---|---|
| Quadrant | BADHDUFLAG | Total packets | Discarded packets |
| A | 0 | 13 | 0 |
| B | 0 | 13 | 0 |
| C | 0 | 13 | 0 |
| D | 0 | 13 | 0 |
| Quadrant | Total seconds | Saturated seconds | Saturation percentage |
|---|---|---|---|
| A | 5986 | 90 | 1.503508% |
| B | 5986 | 212 | 3.541597% |
| C | 5986 | 173 | 2.890077% |
| D | 5986 | 137 | 2.288674% |
Noise dominated data is calculated using 1-second bins in cleaned event files. If a bin has >2000 counts, and if more than 50% of those come from <1% of pixels, then it is considered to be noise-dominated and hence unusable.
| Quadrant | # 1 sec bins | Bins with >0 counts | Bins with >2000 counts | High rate bins dominated by noise | Noise dominated (total time) | Noise dominated (detector-on time) | Marked lightcurve |
|---|---|---|---|---|---|---|---|
| A | 7251 | 5986 | 0 | 0 | 0.00% | 0.00% | 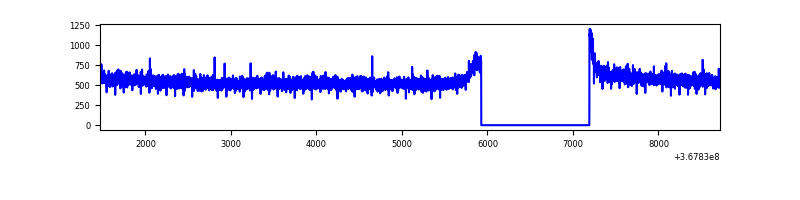 |
| B | 7251 | 5986 | 42 | 42 | 0.58% | 0.70% | 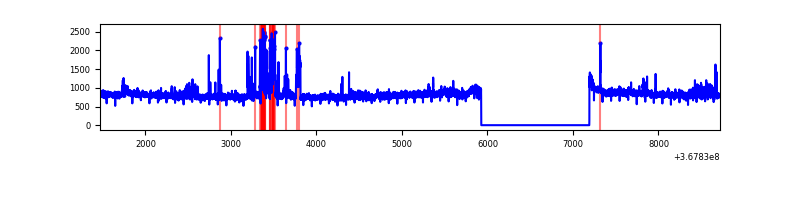 |
| C | 7251 | 5986 | 1 | 1 | 0.01% | 0.02% | 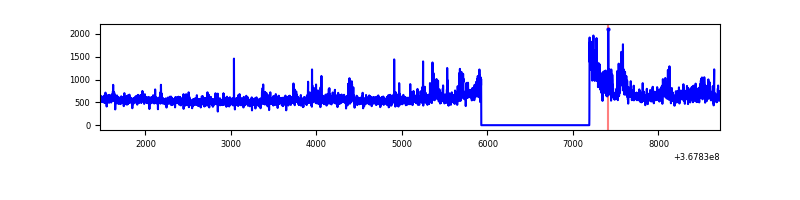 |
| D | 7251 | 5986 | 67 | 67 | 0.92% | 1.12% | 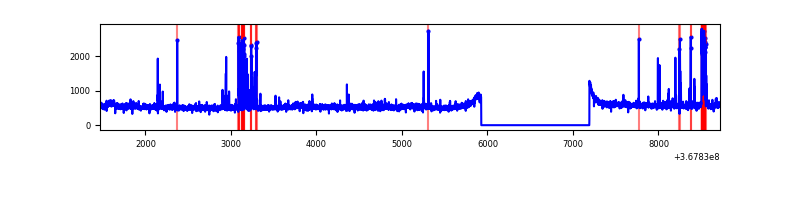 |
Top three noisy pixels from each quadrant. If the there are fewer than three noisy pixels in the level2.evt file, extra rows are filled as -1
| Pixel properties | Quadrant properties | ||||||
|---|---|---|---|---|---|---|---|
| Quadrant | DetID | PixID | Counts | Sigma | Mean | Median | Sigma |
| A | 13 | 254 | 11023 | 60.3 | 852 | 838 | 168.9 |
| A | 3 | 137 | 7964 | 42.19 | 852 | 838 | 168.9 |
| A | 0 | 226 | 7276 | 38.11 | 852 | 838 | 168.9 |
| B | 6 | 159 | 1541065 | 9975.97 | 820 | 804 | 154.4 |
| B | 10 | 245 | 113690 | 731.14 | 820 | 804 | 154.4 |
| B | 15 | 201 | 101248 | 650.56 | 820 | 804 | 154.4 |
| C | 3 | 233 | 401455 | 2192.08 | 789 | 797 | 182.8 |
| C | 14 | 238 | 130757 | 711.04 | 789 | 797 | 182.8 |
| C | 0 | 10 | 15626 | 81.13 | 789 | 797 | 182.8 |
| D | 2 | 250 | 157905 | 813.8 | 817 | 797 | 193.1 |
| D | 8 | 195 | 156770 | 807.92 | 817 | 797 | 193.1 |
| D | 12 | 233 | 102301 | 525.78 | 817 | 797 | 193.1 |
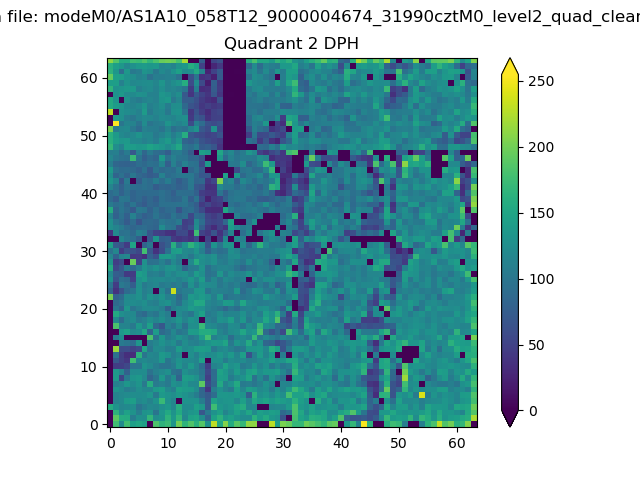
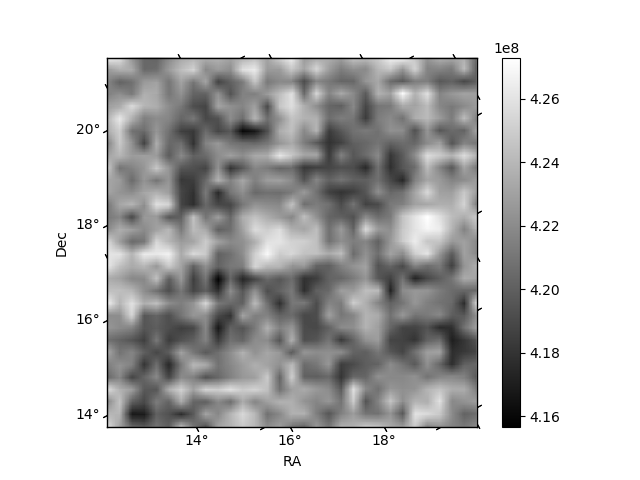
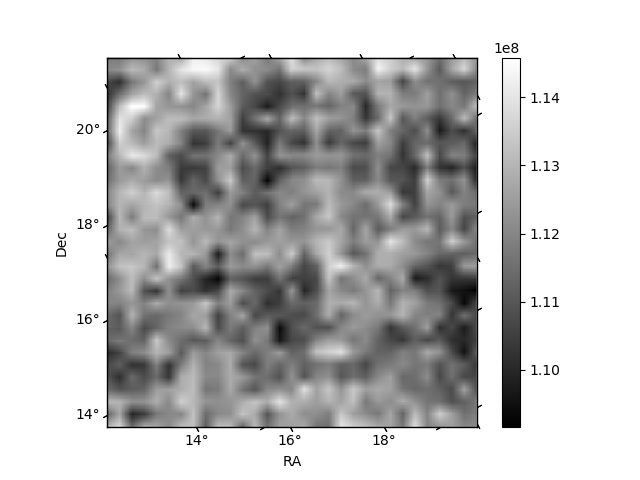
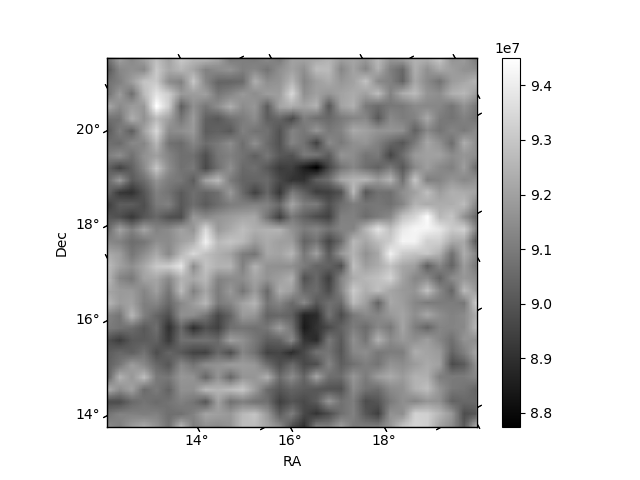
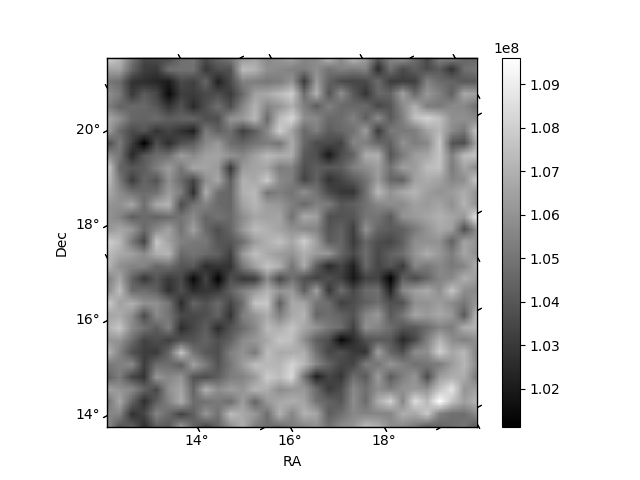
Histogram calculated using DETX and DETY for each event in the final _common_clean file
| Quadrant A | 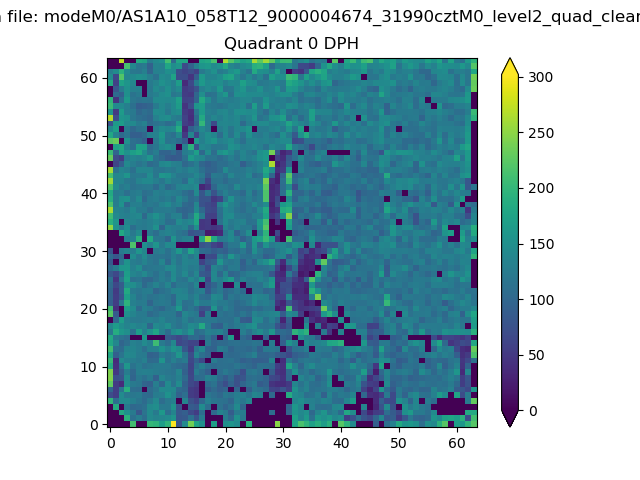 |
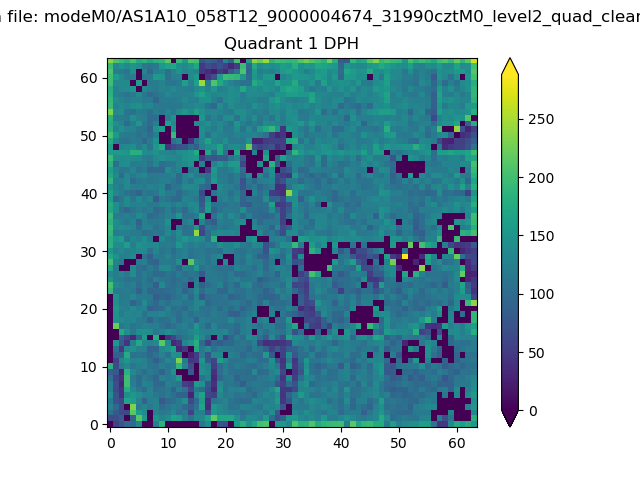 |
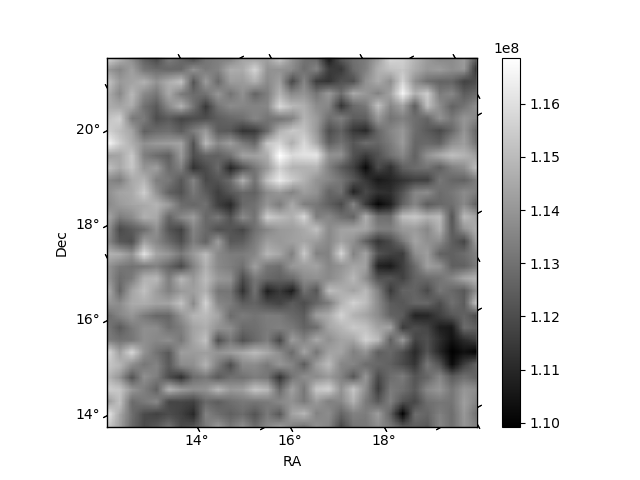
Quadrant B |
|---|---|---|---|
| Quadrant D | 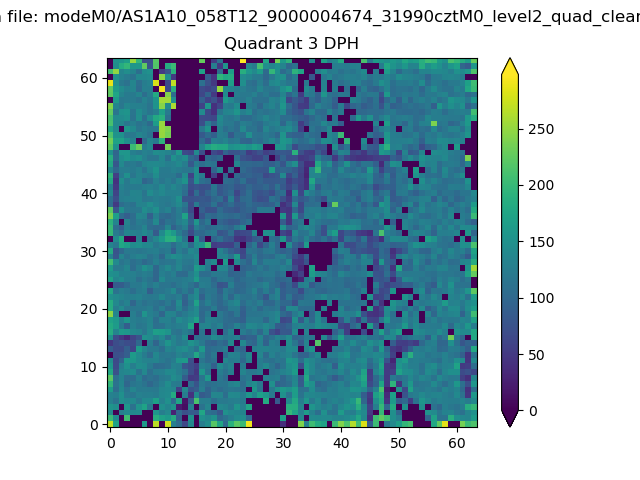 |
 |
Quadrant C |
| Plot type | Count rate plots | Images |
|---|---|---|
| Comparison with Poisson distribution Blue bars denote a histogram of data divided into 1 sec bins. Red curve is a Poisson curve with rate = median count rate of data. |
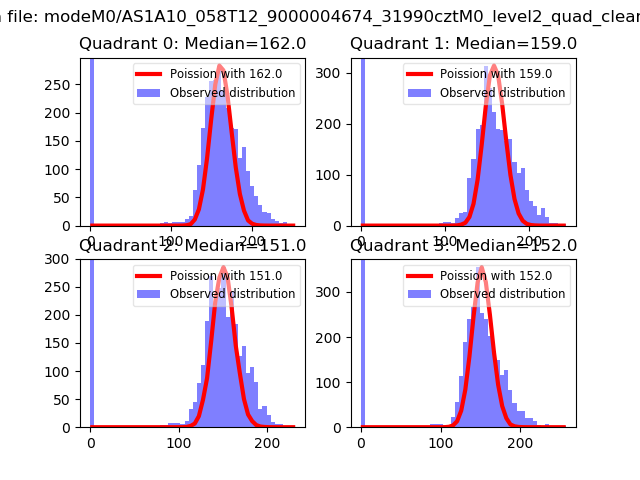 |
 |
| Quadrant-wise count rates Data is divided into 100 sec bins |
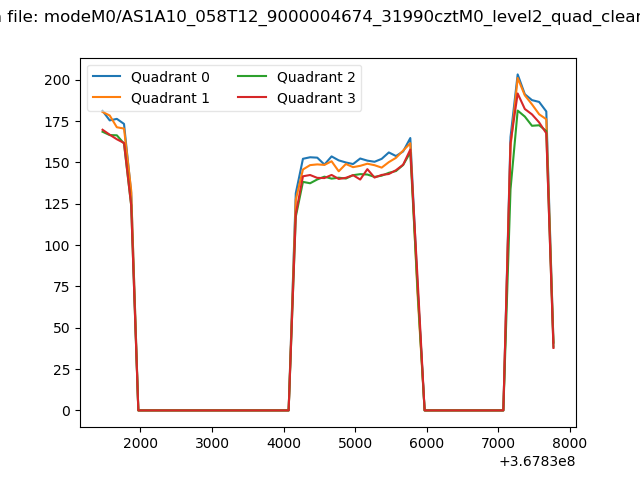 |
|
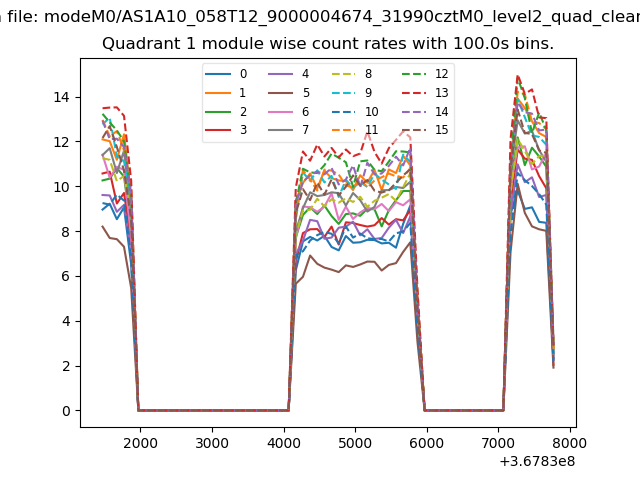
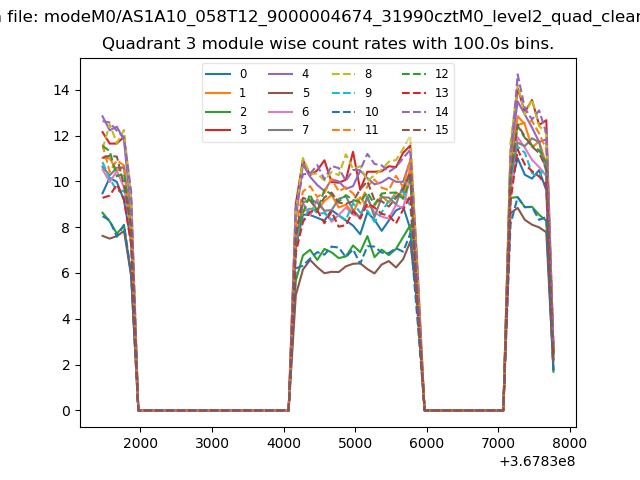
| Module-wise count rates for Quadrant A Data is divided into 100 sec bins |
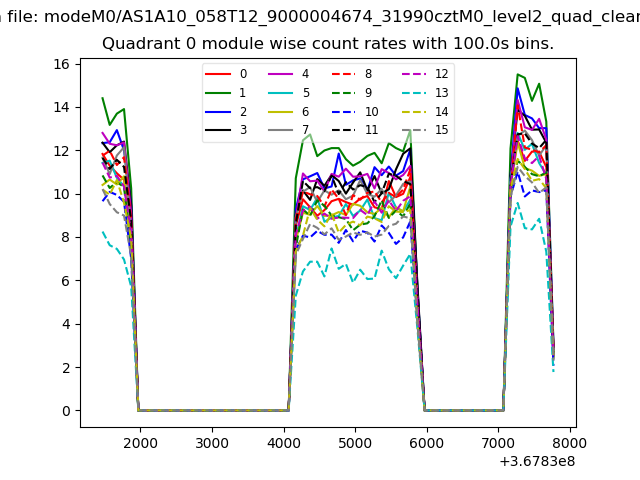 |
 |
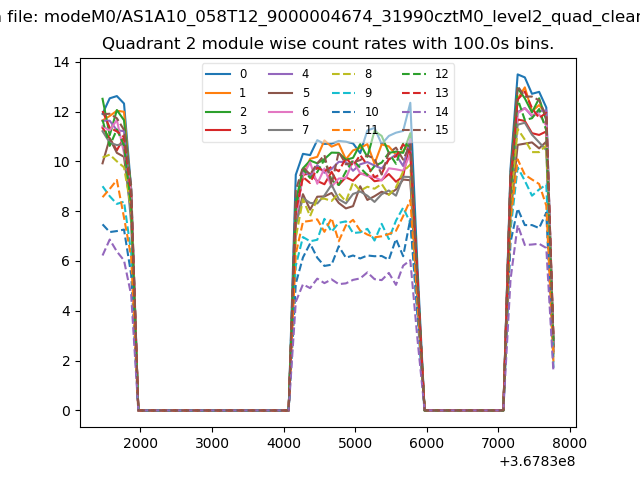
| Module-wise count rates for Quadrant B Data is divided into 100 sec bins |
 |
 |
| Module-wise count rates for Quadrant C Data is divided into 100 sec bins |
 |
 |
| Module-wise count rates for Quadrant D Data is divided into 100 sec bins |
 |
 |
| Parameter | Plot |
|---|---|
| CZT HV Monitor | 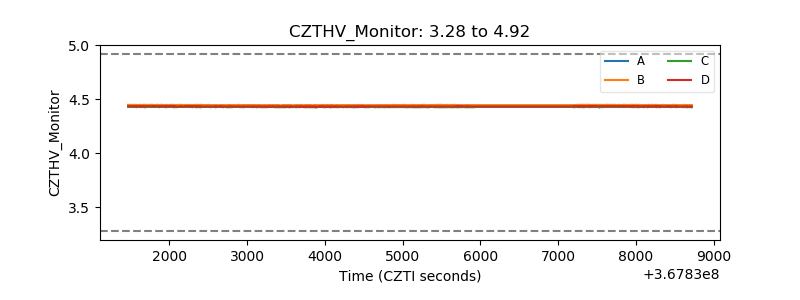 |
| D_VDD | 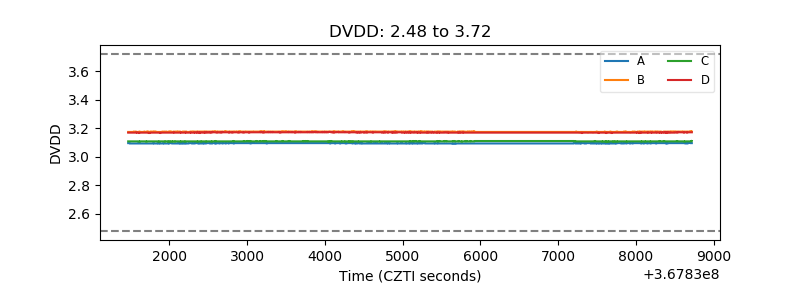 |
| Temperature 1 |  |
| Veto HV Monitor | 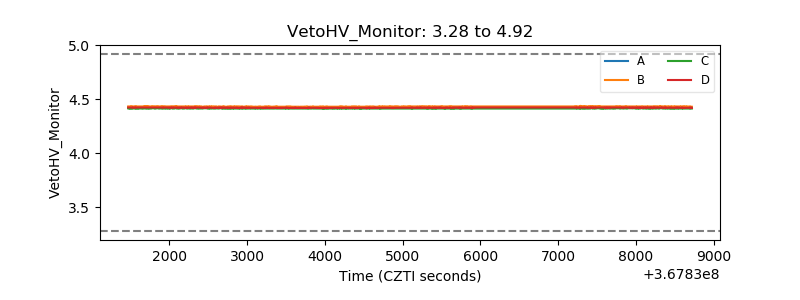 |
| Veto LLD |  |
| Alpha Counter | 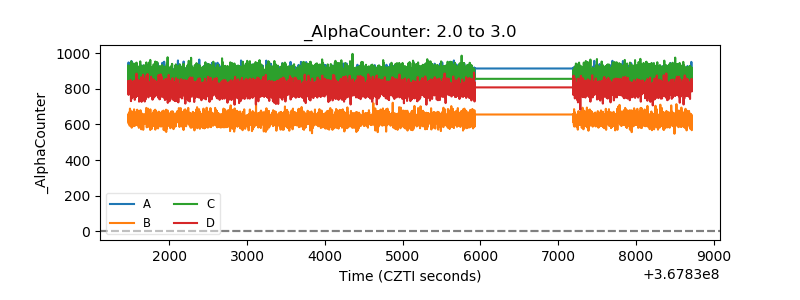 |
| _CPM_Rate | 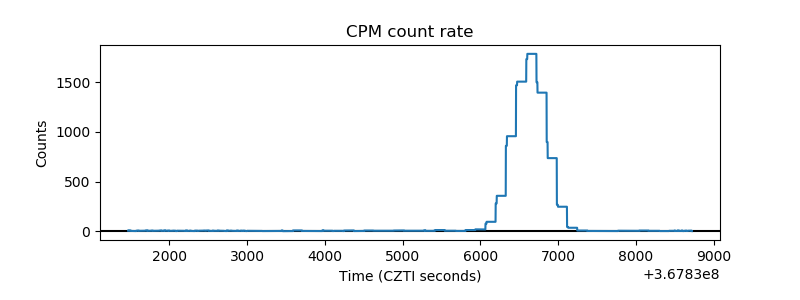 |
| CZT Counter | 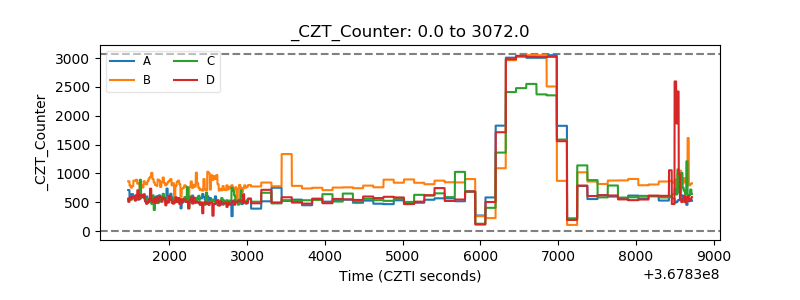 |
| +2.5 Volts monitor |  |
| +5 Volts monitor | 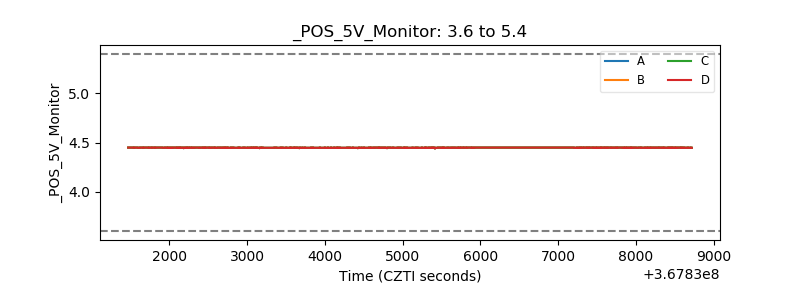 |
| _ROLL_ROT | 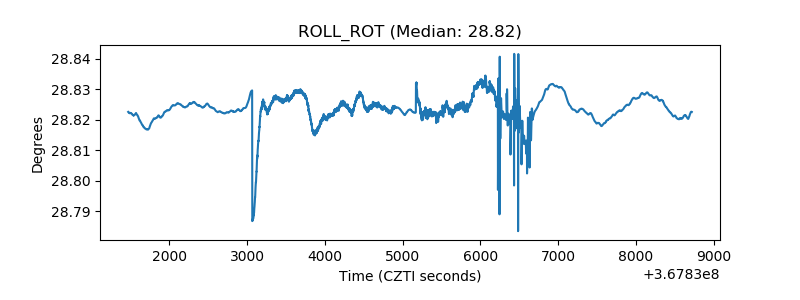 |
| _Roll_DEC | 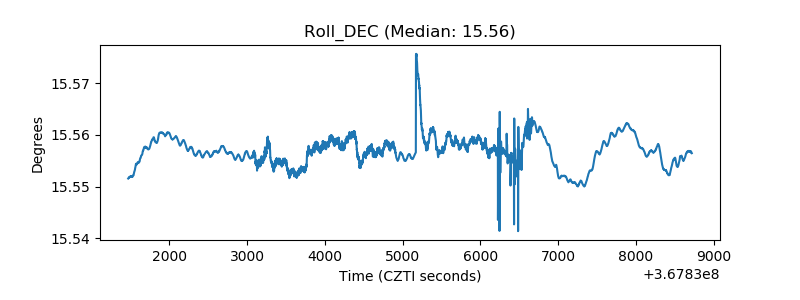 |
| _Roll_RA | 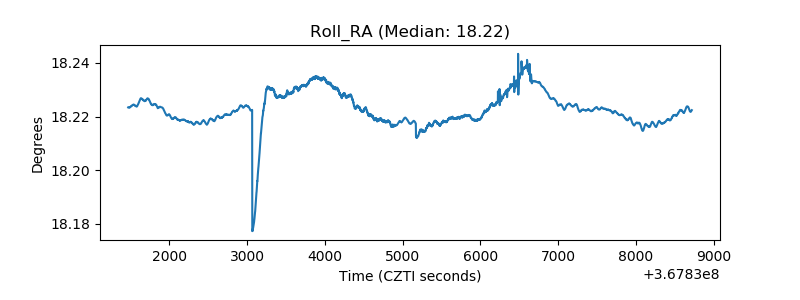 |
| Veto Counter | 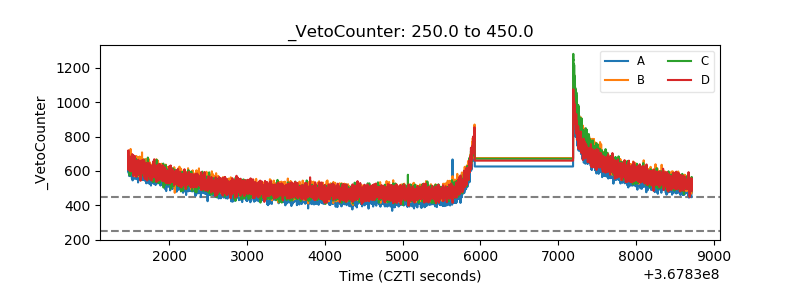 |