| Param | Original file | Final file |
|---|---|---|
| Filename | modeM0/AS1A10_058T12_9000004674_31992cztM0_level2.evt | modeM0/AS1A10_058T12_9000004674_31992cztM0_level2_quad_clean.evt |
| Size (bytes) | 571,893,120 | 70,937,280 |
| Size | 545.4 MB | 67.7 MB |
| Events in quadrant A | 3,518,751 | 434,461 |
| Events in quadrant B | 5,272,654 | 427,452 |
| Events in quadrant C | 4,194,961 | 407,308 |
| Events in quadrant D | 3,880,220 | 411,796 |
| Mode SS | |||
|---|---|---|---|
| Quadrant | BADHDUFLAG | Total packets | Discarded packets |
| A | 0 | 136 | 0 |
| B | 0 | 136 | 0 |
| C | 0 | 136 | 0 |
| D | 0 | 136 | 0 |
| Mode M0 | |||
|---|---|---|---|
| Quadrant | BADHDUFLAG | Total packets | Discarded packets |
| A | 0 | 14235 | 2 |
| B | 0 | 20458 | 2 |
| C | 0 | 16704 | 4 |
| D | 0 | 15634 | 2 |
| Mode M9 | |||
|---|---|---|---|
| Quadrant | BADHDUFLAG | Total packets | Discarded packets |
| A | 0 | 15 | 0 |
| B | 0 | 16 | 0 |
| C | 0 | 16 | 0 |
| D | 0 | 16 | 0 |
| Quadrant | Total seconds | Saturated seconds | Saturation percentage |
|---|---|---|---|
| A | 6696 | 77 | 1.149940% |
| B | 6696 | 149 | 2.225209% |
| C | 6695 | 213 | 3.181479% |
| D | 6695 | 85 | 1.269604% |
Noise dominated data is calculated using 1-second bins in cleaned event files. If a bin has >2000 counts, and if more than 50% of those come from <1% of pixels, then it is considered to be noise-dominated and hence unusable.
| Quadrant | # 1 sec bins | Bins with >0 counts | Bins with >2000 counts | High rate bins dominated by noise | Noise dominated (total time) | Noise dominated (detector-on time) | Marked lightcurve |
|---|---|---|---|---|---|---|---|
| A | 7751 | 6696 | 0 | 0 | 0.00% | 0.00% | 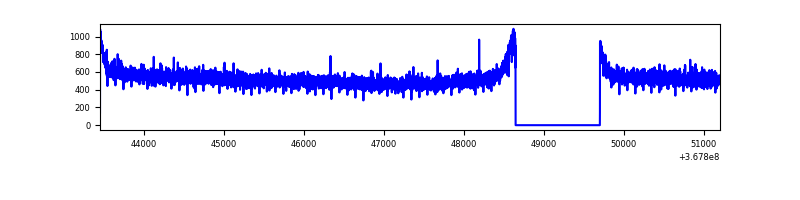 |
| B | 7751 | 6696 | 0 | 0 | 0.00% | 0.00% | 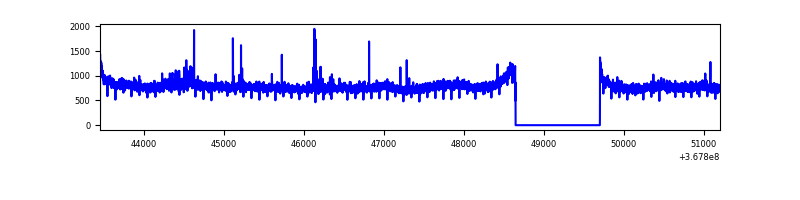 |
| C | 7750 | 6695 | 14 | 14 | 0.18% | 0.21% | 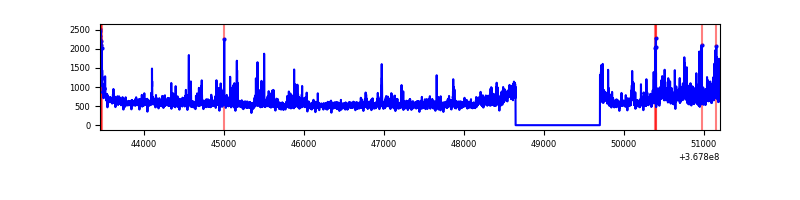 |
| D | 7750 | 6695 | 32 | 32 | 0.41% | 0.48% | 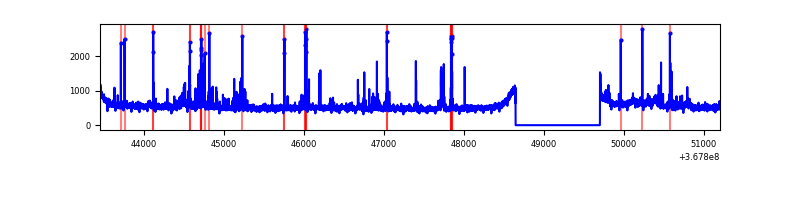 |
Top three noisy pixels from each quadrant. If the there are fewer than three noisy pixels in the level2.evt file, extra rows are filled as -1
| Pixel properties | Quadrant properties | ||||||
|---|---|---|---|---|---|---|---|
| Quadrant | DetID | PixID | Counts | Sigma | Mean | Median | Sigma |
| A | 13 | 6 | 15479 | 80.71 | 908 | 890 | 180.8 |
| A | 13 | 254 | 12177 | 62.44 | 908 | 890 | 180.8 |
| A | 3 | 137 | 8963 | 44.66 | 908 | 890 | 180.8 |
| B | 6 | 159 | 1718181 | 10161.17 | 882 | 859 | 169.0 |
| B | 0 | 190 | 54908 | 319.8 | 882 | 859 | 169.0 |
| B | 12 | 111 | 20966 | 118.97 | 882 | 859 | 169.0 |
| C | 3 | 233 | 534651 | 2696.69 | 849 | 856 | 197.9 |
| C | 14 | 238 | 148997 | 748.4 | 849 | 856 | 197.9 |
| C | 2 | 16 | 55757 | 277.36 | 849 | 856 | 197.9 |
| D | 8 | 195 | 254711 | 1225.14 | 876 | 856 | 207.2 |
| D | 12 | 233 | 120712 | 578.44 | 876 | 856 | 207.2 |
| D | 2 | 250 | 89170 | 426.21 | 876 | 856 | 207.2 |
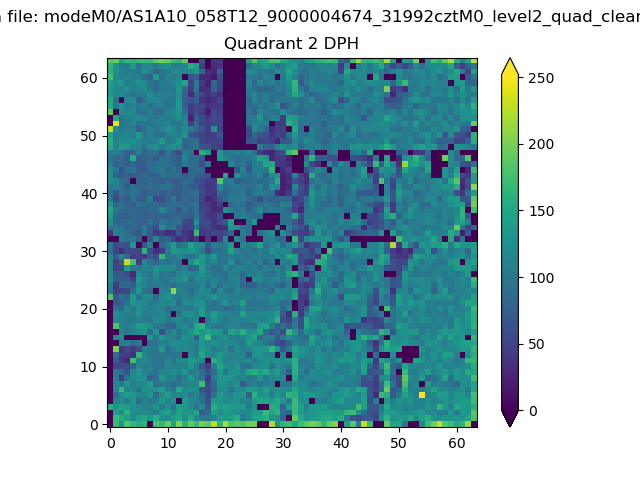
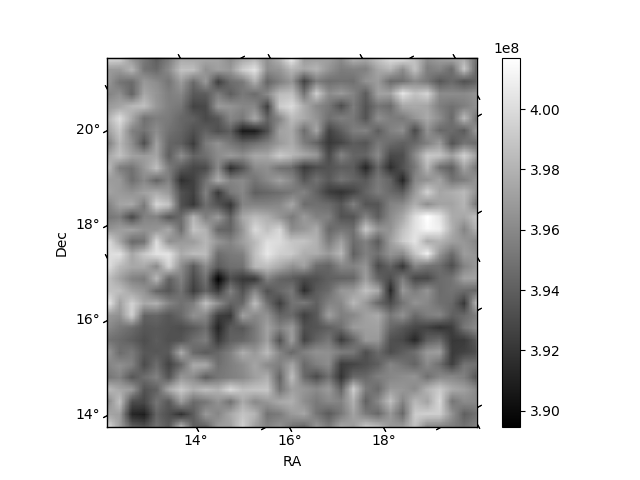
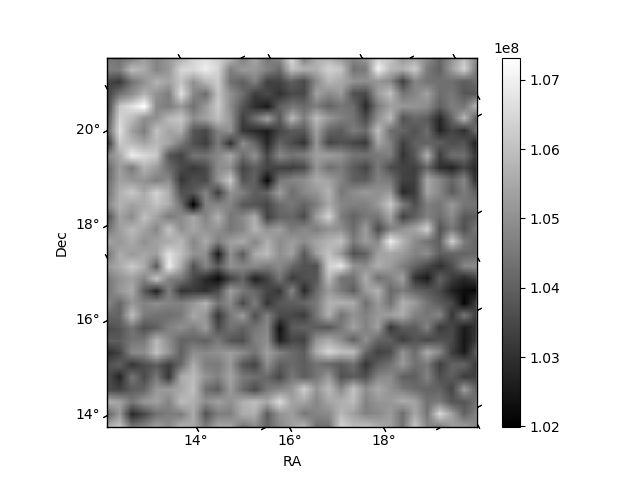
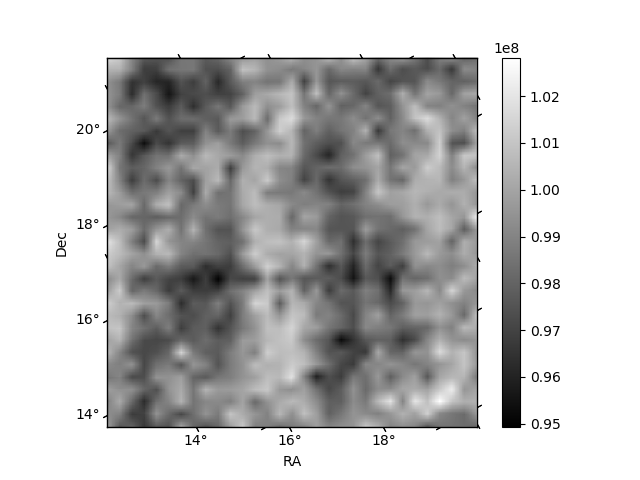
Histogram calculated using DETX and DETY for each event in the final _common_clean file
| Quadrant A | 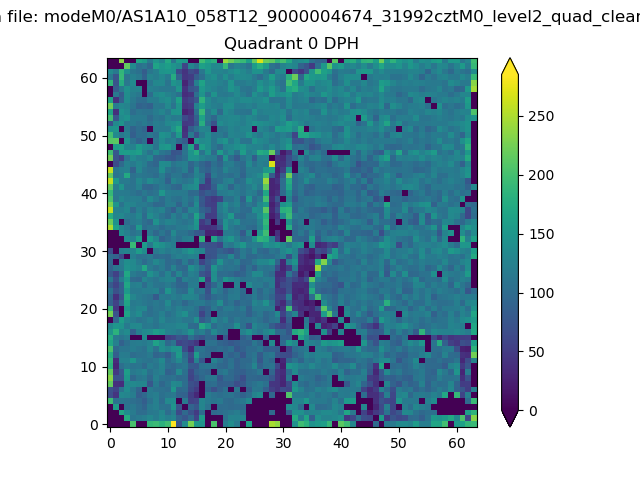 |
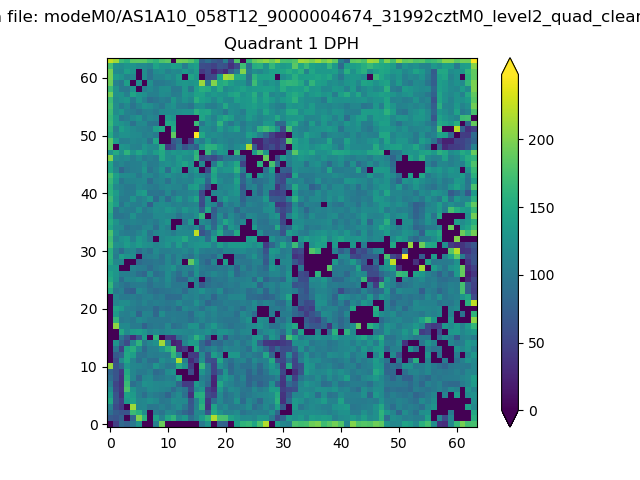 |
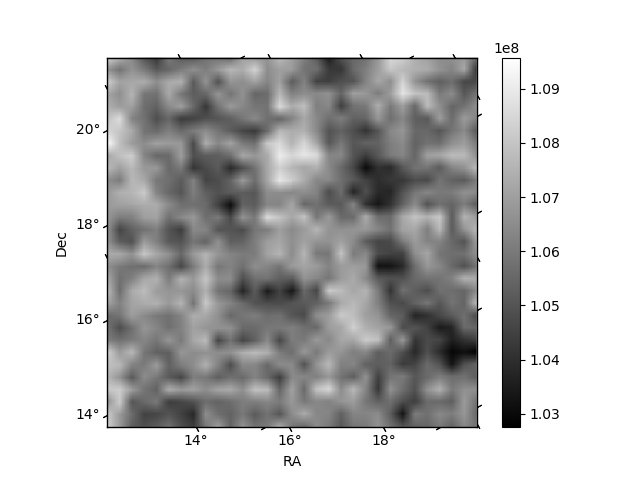
Quadrant B |
|---|---|---|---|
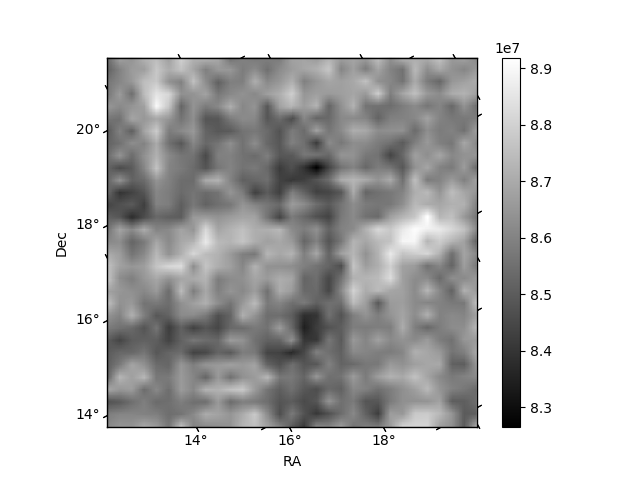
| Quadrant D | 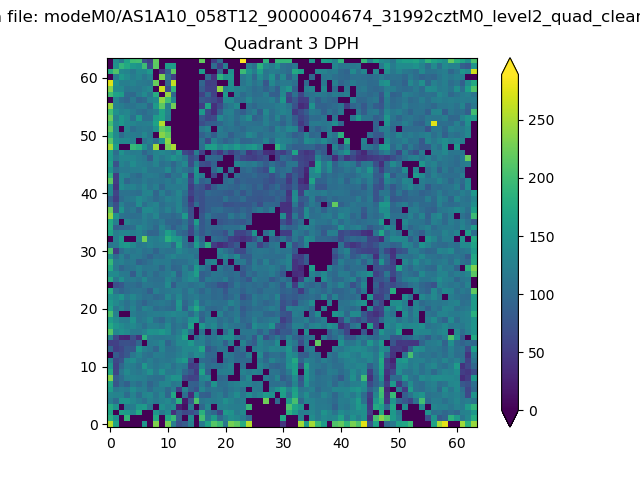 |
 |
Quadrant C |
| Plot type | Count rate plots | Images |
|---|---|---|
| Comparison with Poisson distribution Blue bars denote a histogram of data divided into 1 sec bins. Red curve is a Poisson curve with rate = median count rate of data. |
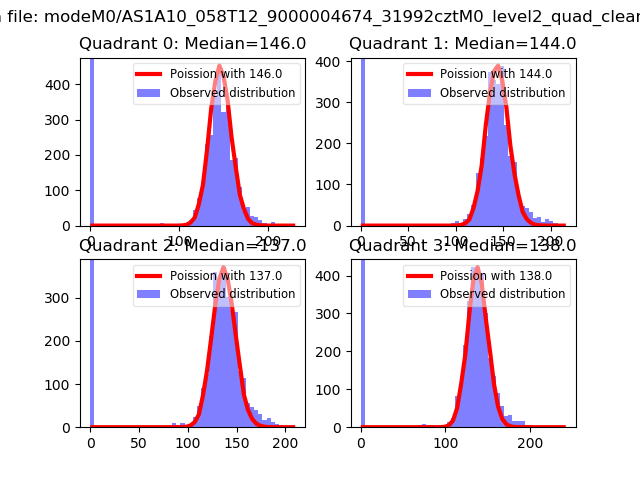 |
 |
| Quadrant-wise count rates Data is divided into 100 sec bins |
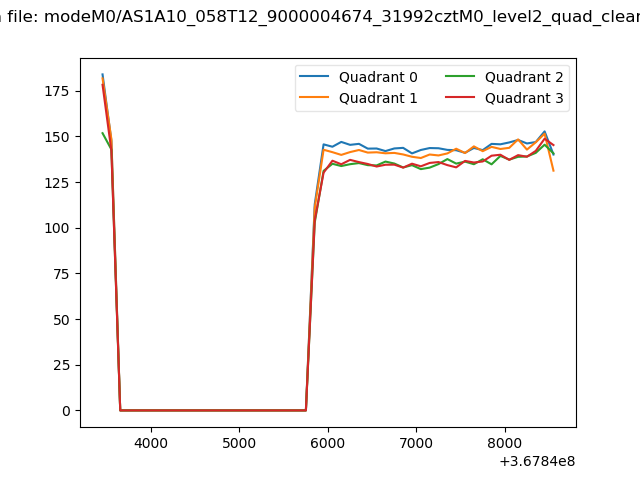 |
|
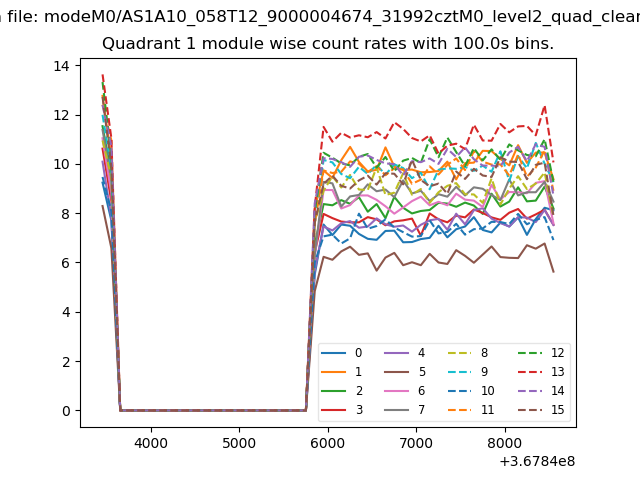
| Module-wise count rates for Quadrant A Data is divided into 100 sec bins |
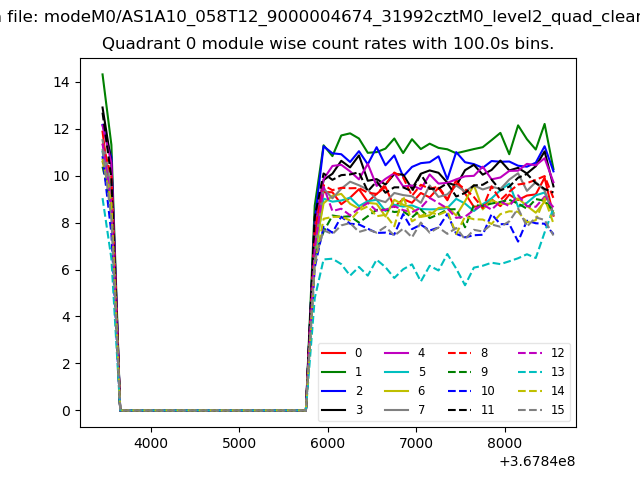 |
 |
| Module-wise count rates for Quadrant B Data is divided into 100 sec bins |
 |
 |
| Module-wise count rates for Quadrant C Data is divided into 100 sec bins |
 |
 |
| Module-wise count rates for Quadrant D Data is divided into 100 sec bins |
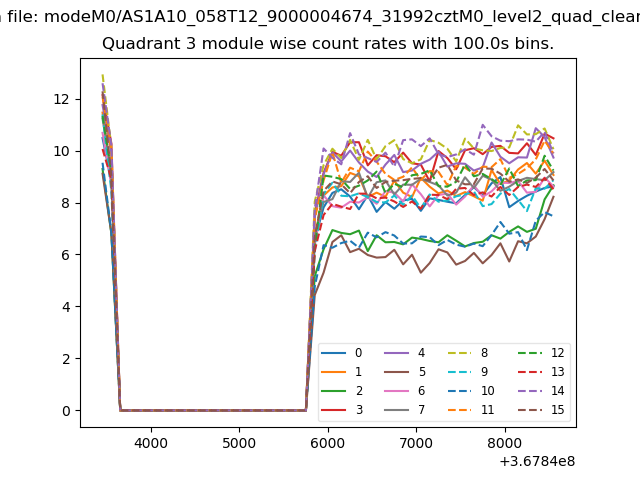 |
 |
| Parameter | Plot |
|---|---|
| CZT HV Monitor | 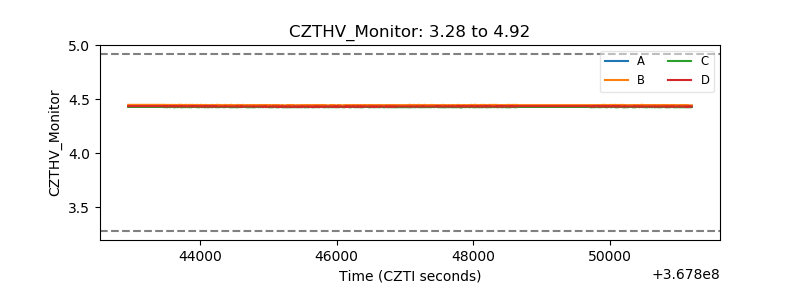 |
| D_VDD | 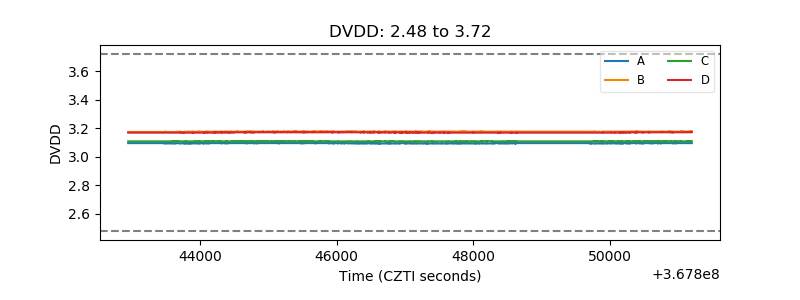 |
| Temperature 1 | 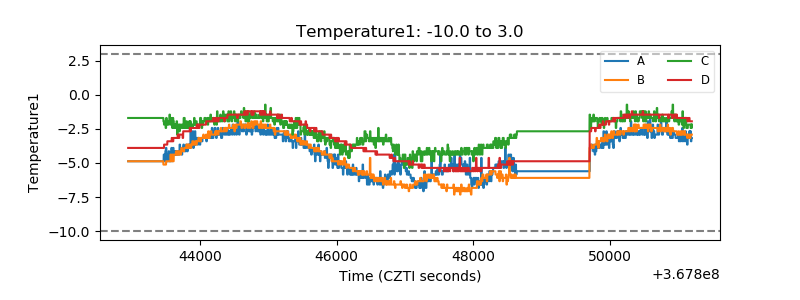 |
| Veto HV Monitor | 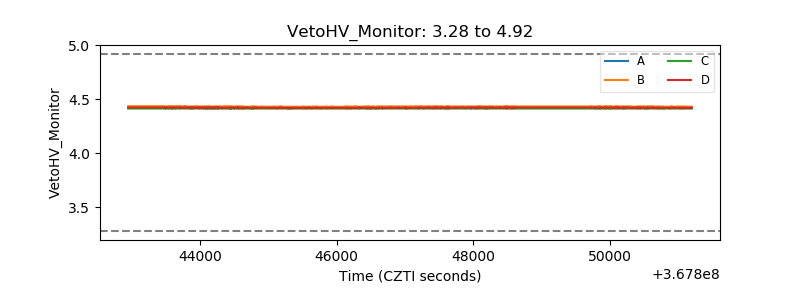 |
| Veto LLD | 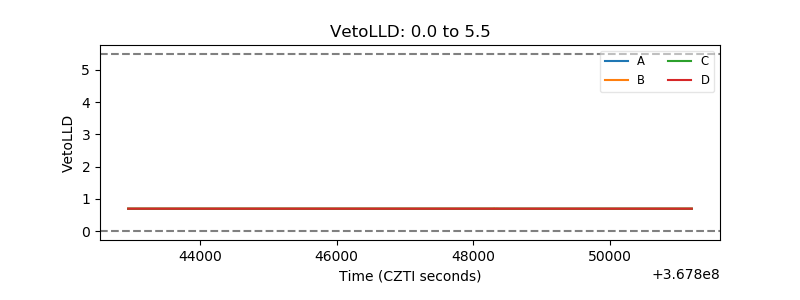 |
| Alpha Counter | 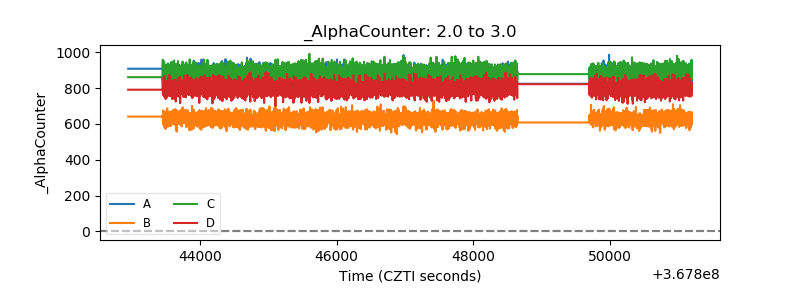 |
| _CPM_Rate | 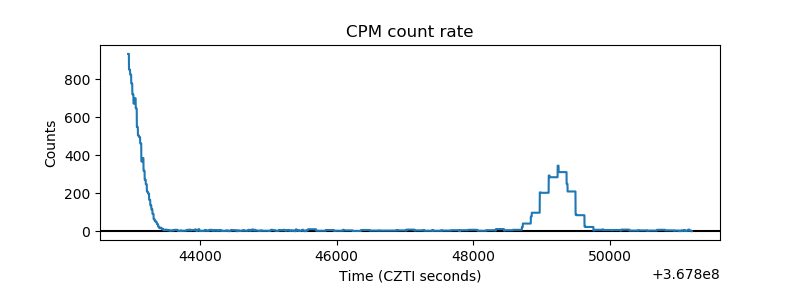 |
| CZT Counter | 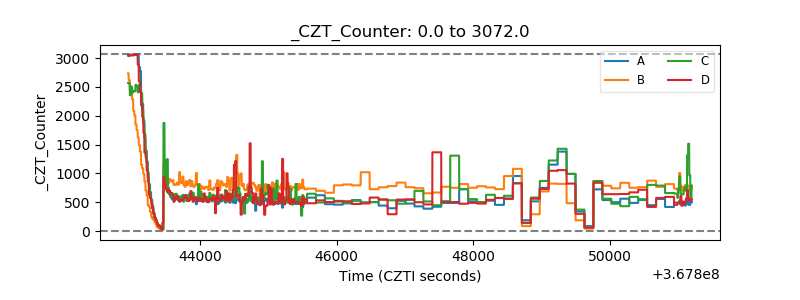 |
| +2.5 Volts monitor |  |
| +5 Volts monitor | 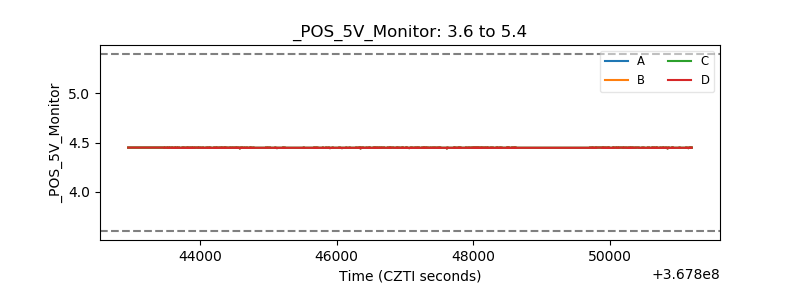 |
| _ROLL_ROT | 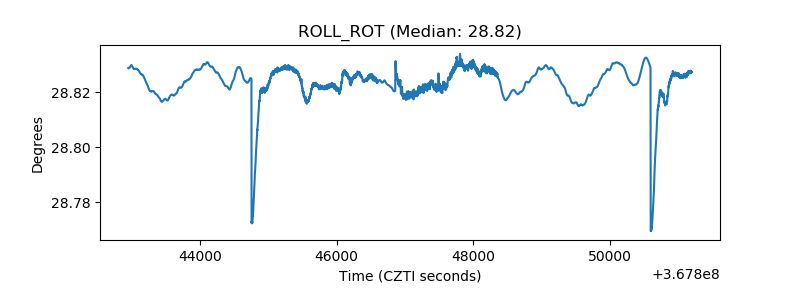 |
| _Roll_DEC | 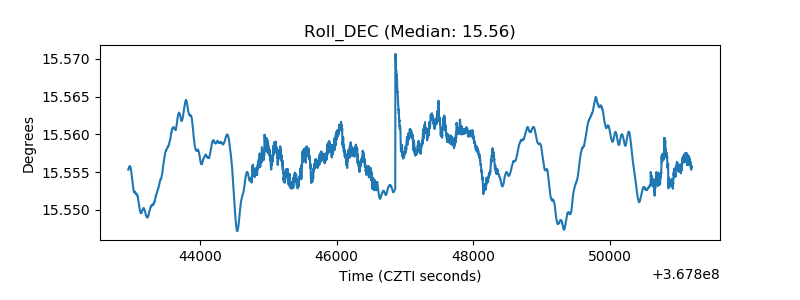 |
| _Roll_RA | 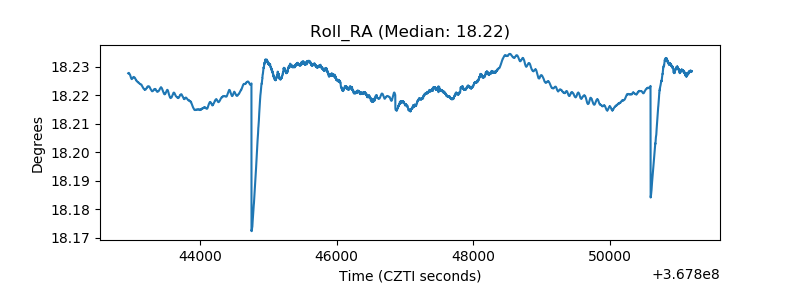 |
| Veto Counter | 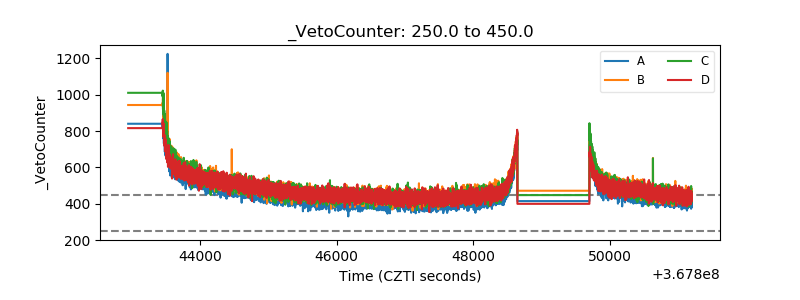 |