| Param | Original file | Final file |
|---|---|---|
| Filename | modeM0/AS1A10_058T12_9000004674_31993cztM0_level2.evt | modeM0/AS1A10_058T12_9000004674_31993cztM0_level2_quad_clean.evt |
| Size (bytes) | 595,310,400 | 77,976,000 |
| Size | 567.7 MB | 74.4 MB |
| Events in quadrant A | 3,548,317 | 483,451 |
| Events in quadrant B | 5,426,520 | 475,283 |
| Events in quadrant C | 4,682,214 | 451,085 |
| Events in quadrant D | 3,895,203 | 460,556 |
| Mode SS | |||
|---|---|---|---|
| Quadrant | BADHDUFLAG | Total packets | Discarded packets |
| A | 0 | 144 | 0 |
| B | 0 | 144 | 0 |
| C | 0 | 144 | 0 |
| D | 0 | 144 | 0 |
| Mode M0 | |||
|---|---|---|---|
| Quadrant | BADHDUFLAG | Total packets | Discarded packets |
| A | 0 | 14709 | 2 |
| B | 0 | 21393 | 2 |
| C | 0 | 18768 | 2 |
| D | 0 | 16089 | 3 |
| Mode M9 | |||
|---|---|---|---|
| Quadrant | BADHDUFLAG | Total packets | Discarded packets |
| A | 0 | 9 | 0 |
| B | 0 | 10 | 0 |
| C | 0 | 10 | 0 |
| D | 0 | 10 | 0 |
| Quadrant | Total seconds | Saturated seconds | Saturation percentage |
|---|---|---|---|
| A | 7042 | 88 | 1.249645% |
| B | 7042 | 169 | 2.399886% |
| C | 7042 | 379 | 5.381994% |
| D | 7041 | 85 | 1.207215% |
Noise dominated data is calculated using 1-second bins in cleaned event files. If a bin has >2000 counts, and if more than 50% of those come from <1% of pixels, then it is considered to be noise-dominated and hence unusable.
| Quadrant | # 1 sec bins | Bins with >0 counts | Bins with >2000 counts | High rate bins dominated by noise | Noise dominated (total time) | Noise dominated (detector-on time) | Marked lightcurve |
|---|---|---|---|---|---|---|---|
| A | 7717 | 7042 | 0 | 0 | 0.00% | 0.00% | 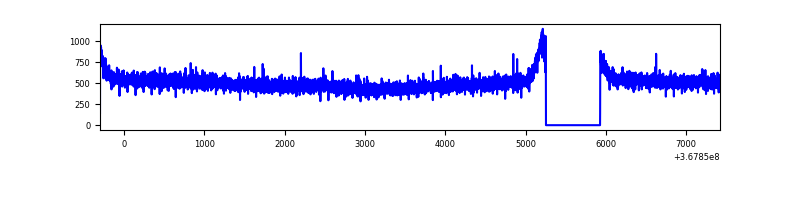 |
| B | 7717 | 7042 | 1 | 1 | 0.01% | 0.01% | 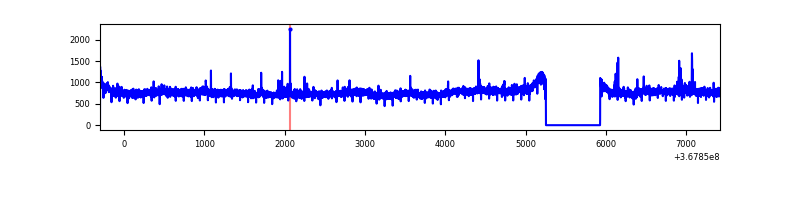 |
| C | 7717 | 7042 | 9 | 9 | 0.12% | 0.13% | 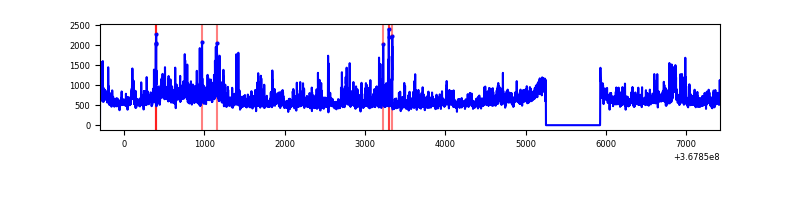 |
| D | 7716 | 7041 | 6 | 6 | 0.08% | 0.09% | 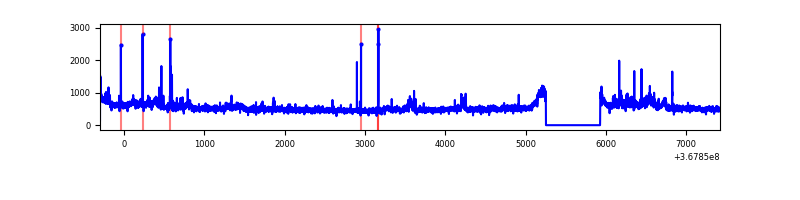 |
Top three noisy pixels from each quadrant. If the there are fewer than three noisy pixels in the level2.evt file, extra rows are filled as -1
| Pixel properties | Quadrant properties | ||||||
|---|---|---|---|---|---|---|---|
| Quadrant | DetID | PixID | Counts | Sigma | Mean | Median | Sigma |
| A | 13 | 6 | 13887 | 70.78 | 916 | 897 | 183.5 |
| A | 13 | 254 | 12911 | 65.46 | 916 | 897 | 183.5 |
| A | 3 | 137 | 9413 | 46.4 | 916 | 897 | 183.5 |
| B | 6 | 159 | 1849179 | 10632.32 | 896 | 874 | 173.8 |
| B | 5 | 172 | 21874 | 120.8 | 896 | 874 | 173.8 |
| B | 12 | 111 | 21633 | 119.42 | 896 | 874 | 173.8 |
| C | 3 | 233 | 977681 | 4848.34 | 856 | 861 | 201.5 |
| C | 14 | 238 | 196480 | 970.93 | 856 | 861 | 201.5 |
| C | 14 | 254 | 81230 | 398.9 | 856 | 861 | 201.5 |
| D | 8 | 195 | 436303 | 2055.69 | 885 | 862 | 211.8 |
| D | 2 | 250 | 52396 | 243.29 | 885 | 862 | 211.8 |
| D | 2 | 234 | 33126 | 152.32 | 885 | 862 | 211.8 |
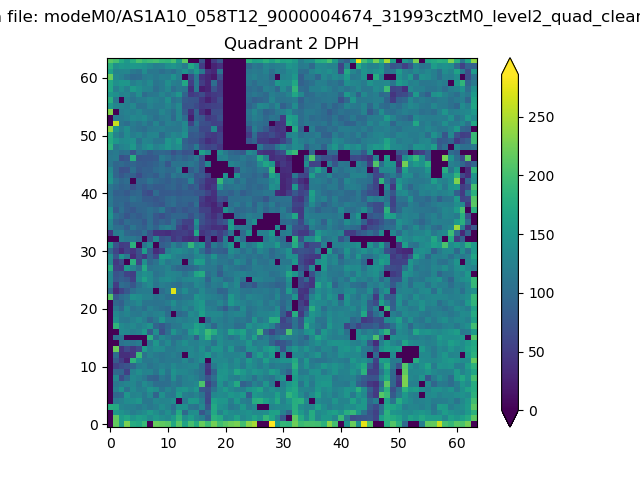
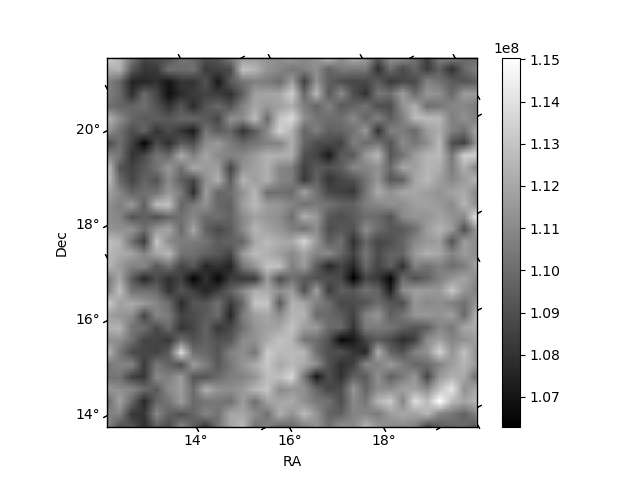
Histogram calculated using DETX and DETY for each event in the final _common_clean file
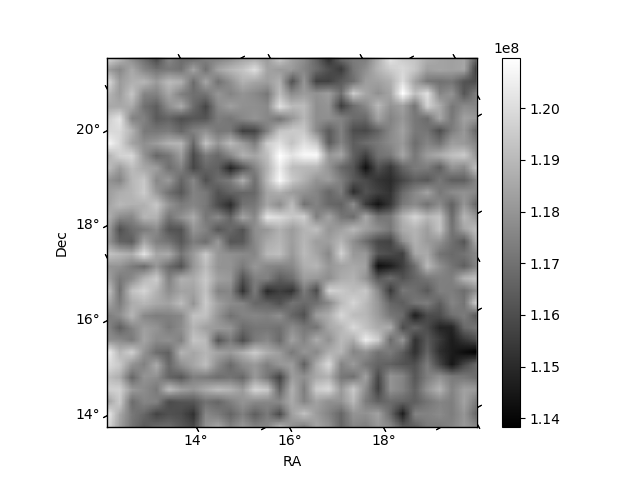
| Quadrant A | 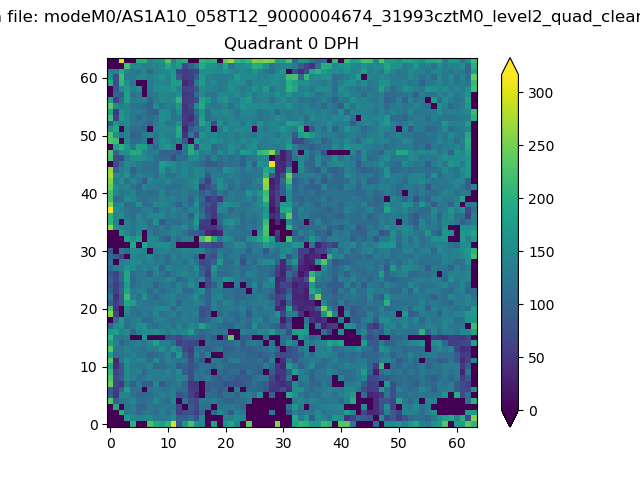 |
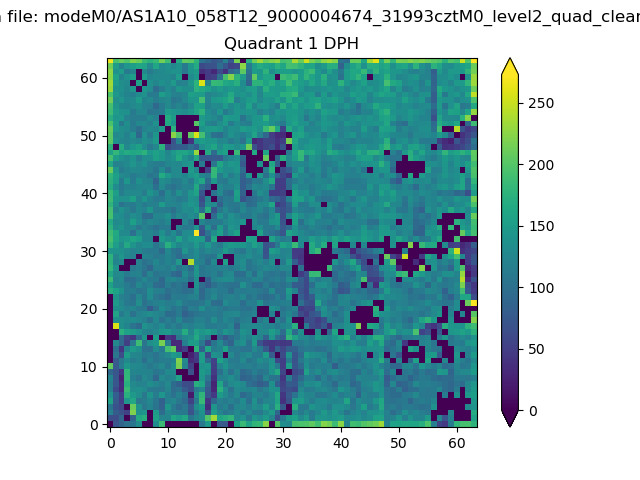 |
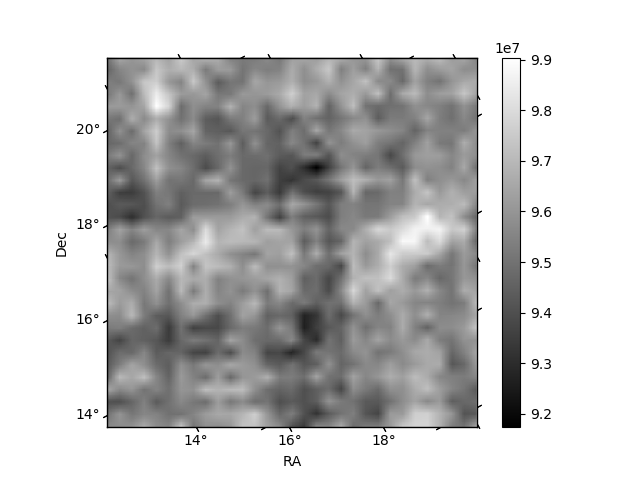
Quadrant B |
|---|---|---|---|
| Quadrant D | 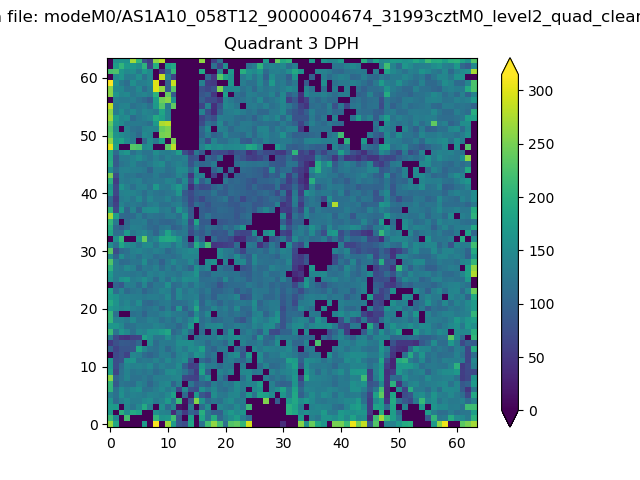 |
 |
Quadrant C |
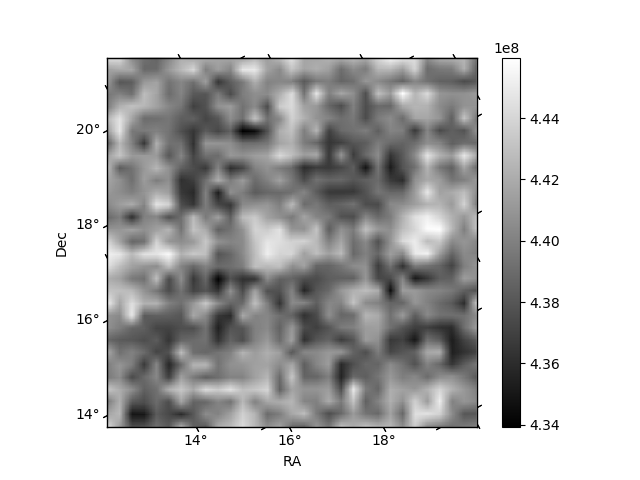
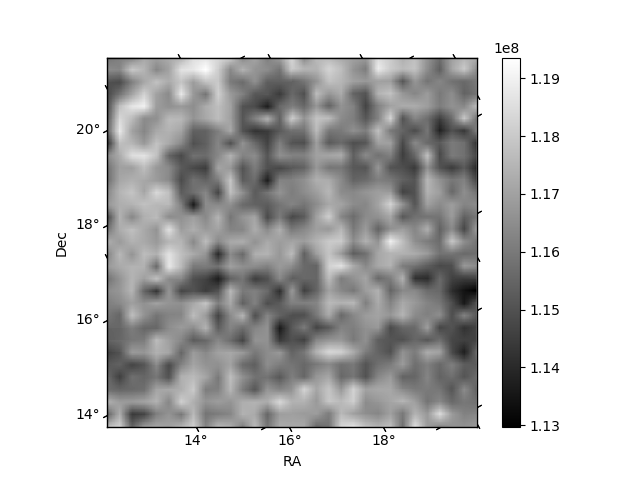
| Plot type | Count rate plots | Images |
|---|---|---|
| Comparison with Poisson distribution Blue bars denote a histogram of data divided into 1 sec bins. Red curve is a Poisson curve with rate = median count rate of data. |
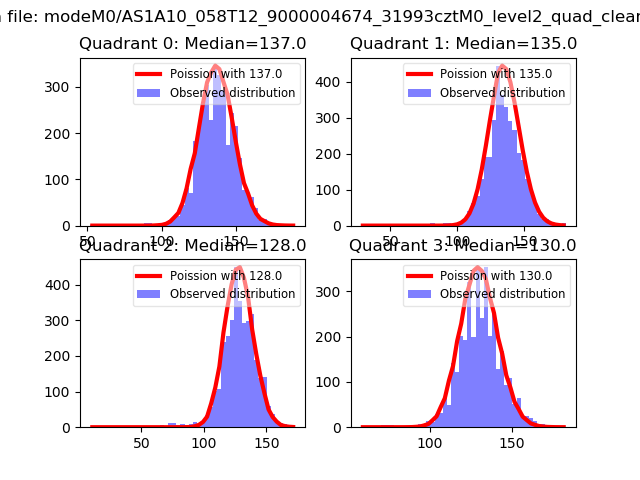 |
 |
| Quadrant-wise count rates Data is divided into 100 sec bins |
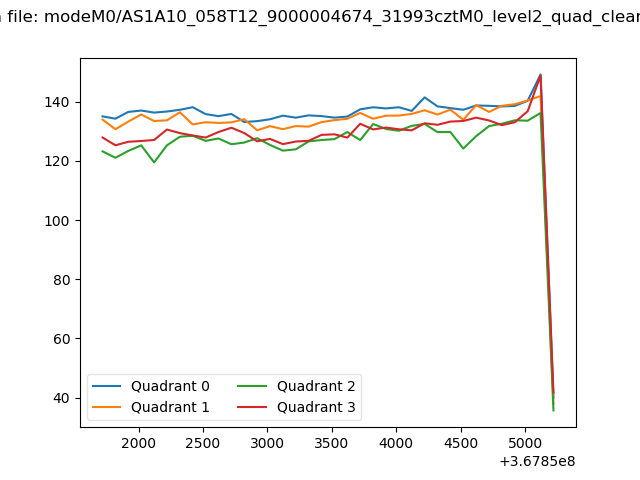 |
|
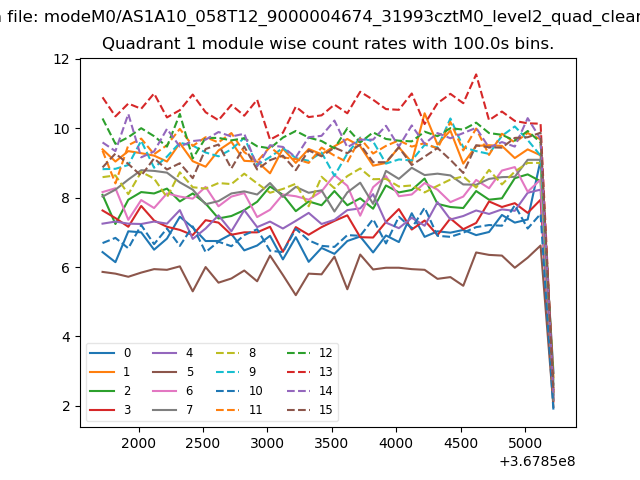
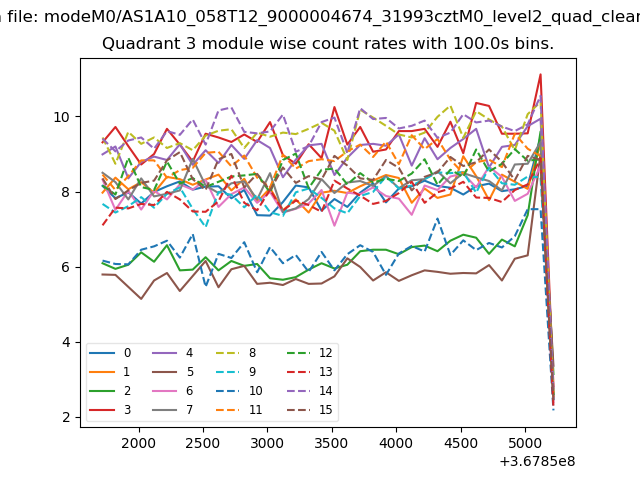
| Module-wise count rates for Quadrant A Data is divided into 100 sec bins |
 |
 |
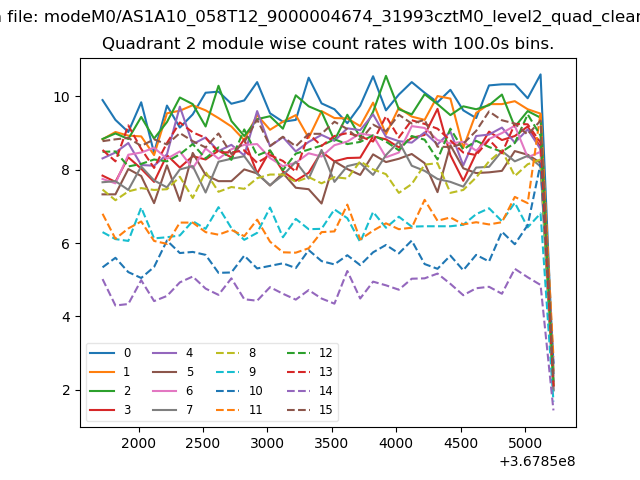
| Module-wise count rates for Quadrant B Data is divided into 100 sec bins |
 |
 |
| Module-wise count rates for Quadrant C Data is divided into 100 sec bins |
 |
 |
| Module-wise count rates for Quadrant D Data is divided into 100 sec bins |
 |
 |
| Parameter | Plot |
|---|---|
| CZT HV Monitor | 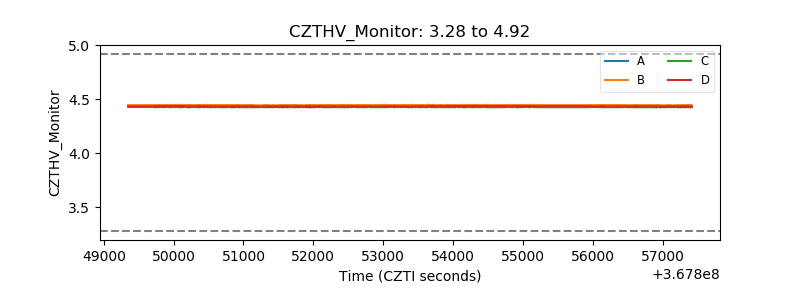 |
| D_VDD | 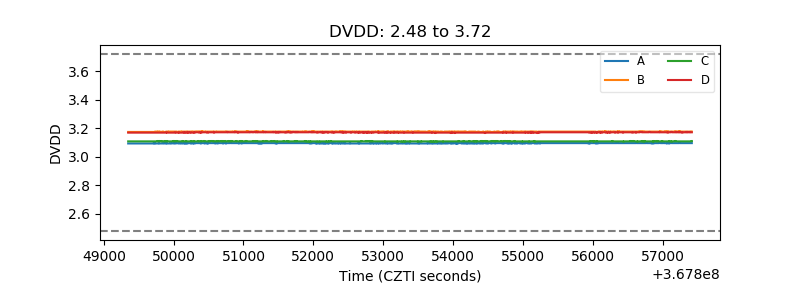 |
| Temperature 1 |  |
| Veto HV Monitor | 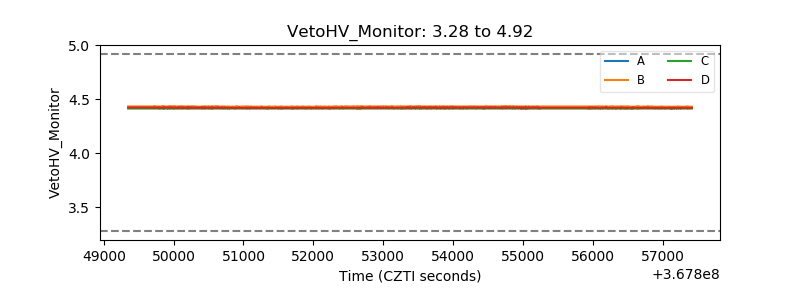 |
| Veto LLD | 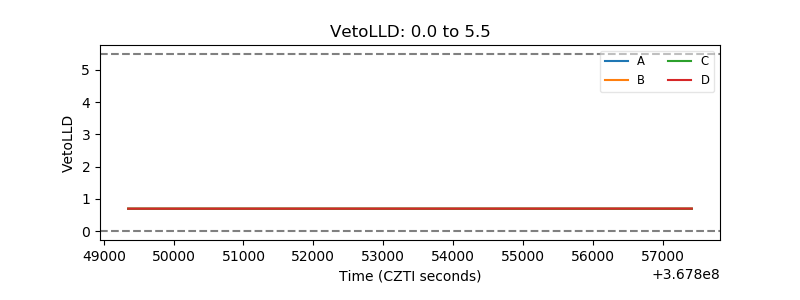 |
| Alpha Counter | 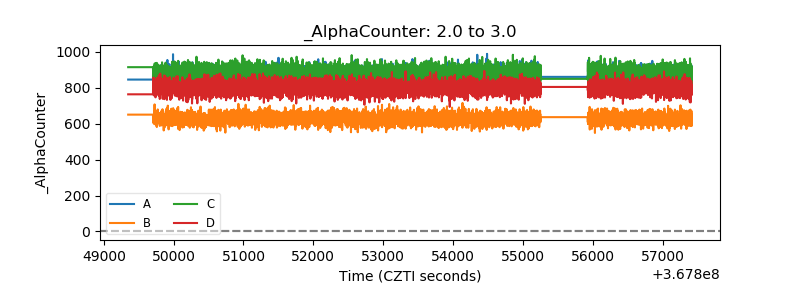 |
| _CPM_Rate | 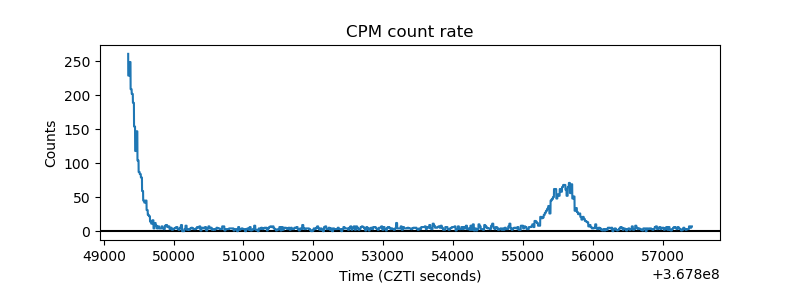 |
| CZT Counter | 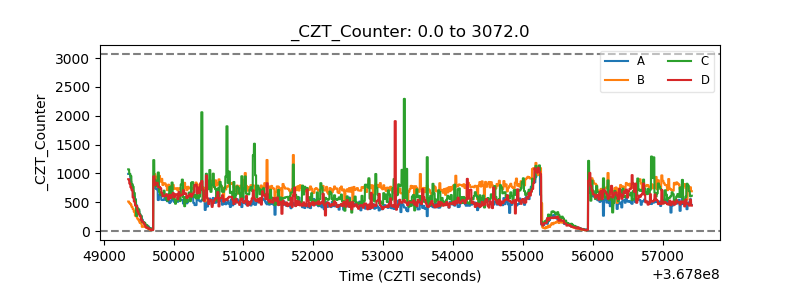 |
| +2.5 Volts monitor |  |
| +5 Volts monitor | 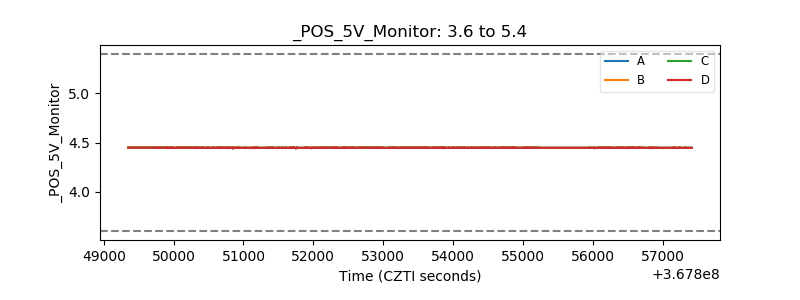 |
| _ROLL_ROT | 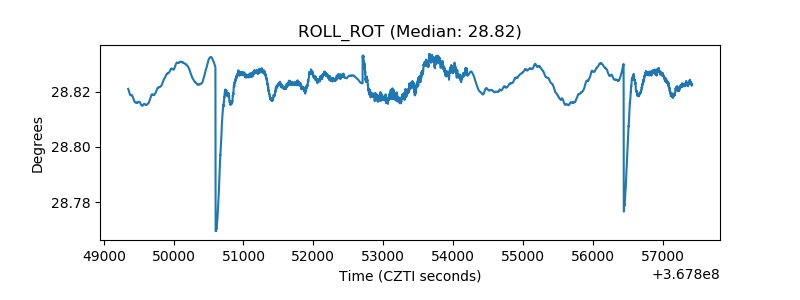 |
| _Roll_DEC | 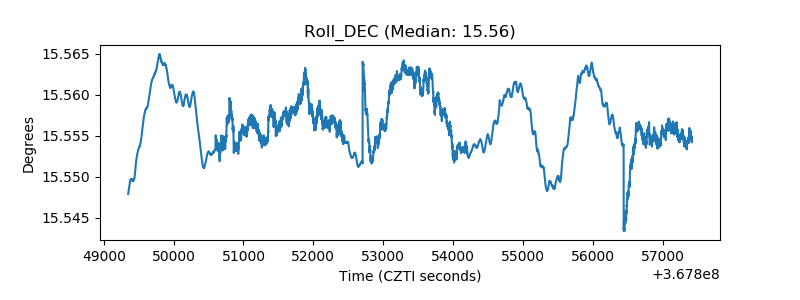 |
| _Roll_RA | 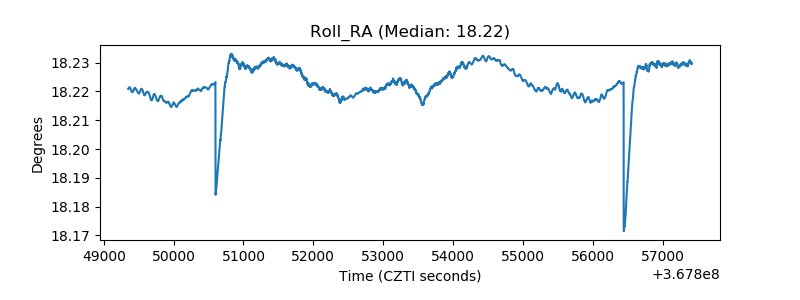 |
| Veto Counter | 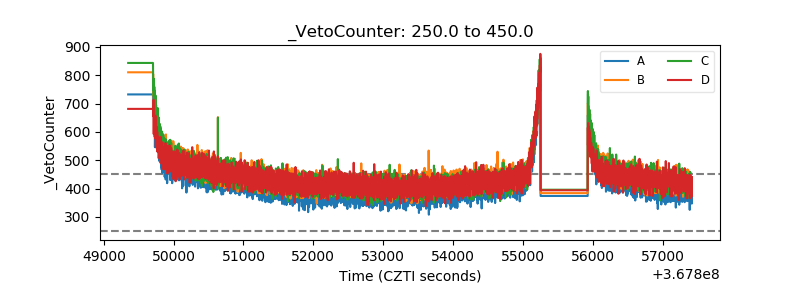 |