| Param | Original file | Final file |
|---|---|---|
| Filename | modeM0/AS1A10_058T12_9000004674_31994cztM0_level2.evt | modeM0/AS1A10_058T12_9000004674_31994cztM0_level2_quad_clean.evt |
| Size (bytes) | 623,004,480 | 80,953,920 |
| Size | 594.1 MB | 77.2 MB |
| Events in quadrant A | 3,699,713 | 501,031 |
| Events in quadrant B | 5,782,991 | 494,252 |
| Events in quadrant C | 5,002,955 | 468,105 |
| Events in quadrant D | 3,879,525 | 471,604 |
| Mode SS | |||
|---|---|---|---|
| Quadrant | BADHDUFLAG | Total packets | Discarded packets |
| A | 0 | 150 | 0 |
| B | 0 | 150 | 0 |
| C | 0 | 150 | 0 |
| D | 0 | 150 | 0 |
| Mode M0 | |||
|---|---|---|---|
| Quadrant | BADHDUFLAG | Total packets | Discarded packets |
| A | 0 | 15528 | 2 |
| B | 0 | 22704 | 2 |
| C | 0 | 19953 | 2 |
| D | 0 | 16379 | 2 |
| Mode M9 | |||
|---|---|---|---|
| Quadrant | BADHDUFLAG | Total packets | Discarded packets |
| A | 0 | 3 | 0 |
| B | 0 | 3 | 0 |
| C | 0 | 3 | 0 |
| D | 0 | 3 | 0 |
| Quadrant | Total seconds | Saturated seconds | Saturation percentage |
|---|---|---|---|
| A | 7421 | 147 | 1.980865% |
| B | 7420 | 298 | 4.016173% |
| C | 7420 | 614 | 8.274933% |
| D | 7421 | 147 | 1.980865% |
Noise dominated data is calculated using 1-second bins in cleaned event files. If a bin has >2000 counts, and if more than 50% of those come from <1% of pixels, then it is considered to be noise-dominated and hence unusable.
| Quadrant | # 1 sec bins | Bins with >0 counts | Bins with >2000 counts | High rate bins dominated by noise | Noise dominated (total time) | Noise dominated (detector-on time) | Marked lightcurve |
|---|---|---|---|---|---|---|---|
| A | 7666 | 7422 | 0 | 0 | 0.00% | 0.00% | 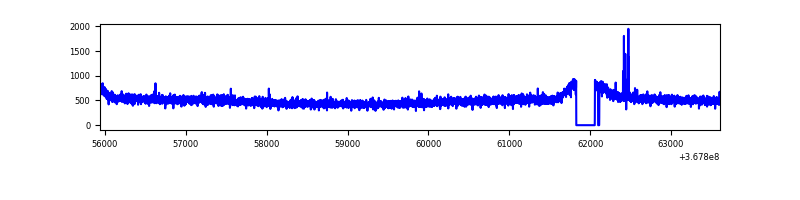 |
| B | 7665 | 7420 | 21 | 21 | 0.27% | 0.28% | 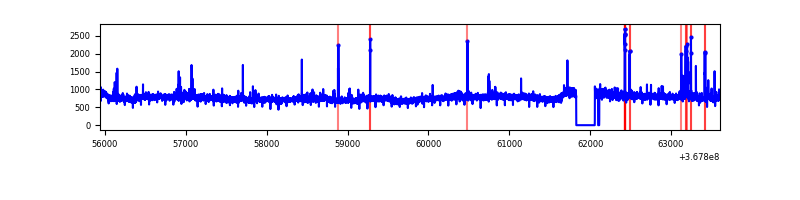 |
| C | 7665 | 7420 | 14 | 14 | 0.18% | 0.19% | 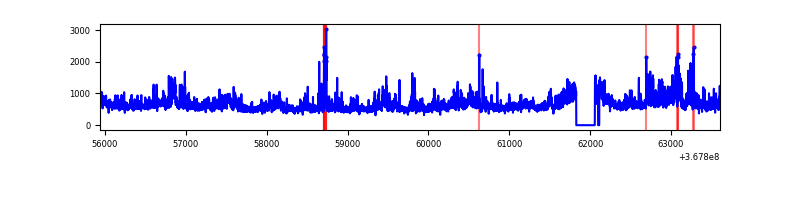 |
| D | 7666 | 7421 | 25 | 25 | 0.33% | 0.34% | 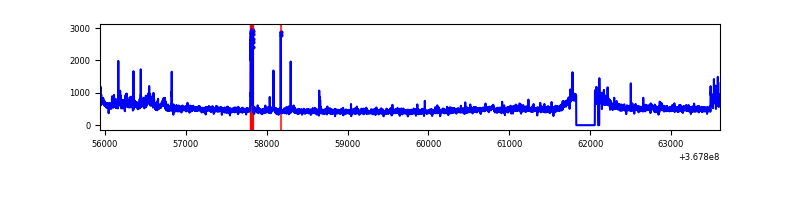 |
Top three noisy pixels from each quadrant. If the there are fewer than three noisy pixels in the level2.evt file, extra rows are filled as -1
| Pixel properties | Quadrant properties | ||||||
|---|---|---|---|---|---|---|---|
| Quadrant | DetID | PixID | Counts | Sigma | Mean | Median | Sigma |
| A | 13 | 6 | 18868 | 93.33 | 951 | 929 | 192.2 |
| A | 13 | 254 | 12729 | 61.39 | 951 | 929 | 192.2 |
| A | 1 | 113 | 11909 | 57.13 | 951 | 929 | 192.2 |
| B | 6 | 159 | 1936459 | 10755.96 | 930 | 906 | 180.0 |
| B | 10 | 245 | 79061 | 434.31 | 930 | 906 | 180.0 |
| B | 5 | 172 | 55174 | 301.57 | 930 | 906 | 180.0 |
| C | 3 | 233 | 1089380 | 5283.28 | 877 | 880 | 206.0 |
| C | 14 | 238 | 228826 | 1106.39 | 877 | 880 | 206.0 |
| C | 14 | 254 | 119819 | 577.29 | 877 | 880 | 206.0 |
| D | 8 | 195 | 245903 | 1113.3 | 916 | 891 | 220.1 |
| D | 7 | 238 | 74757 | 335.64 | 916 | 891 | 220.1 |
| D | 11 | 164 | 49233 | 219.66 | 916 | 891 | 220.1 |
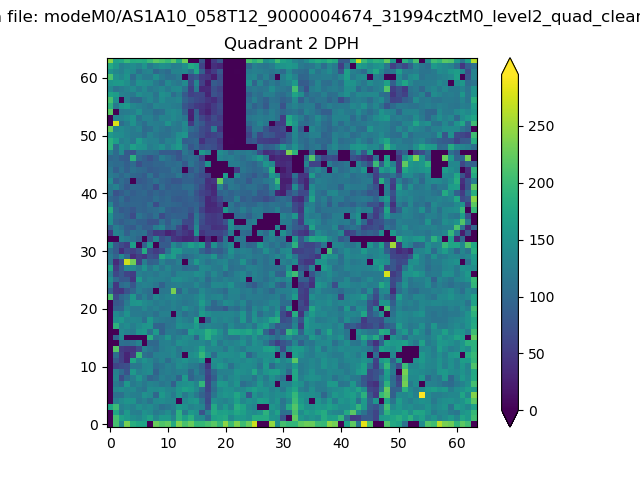
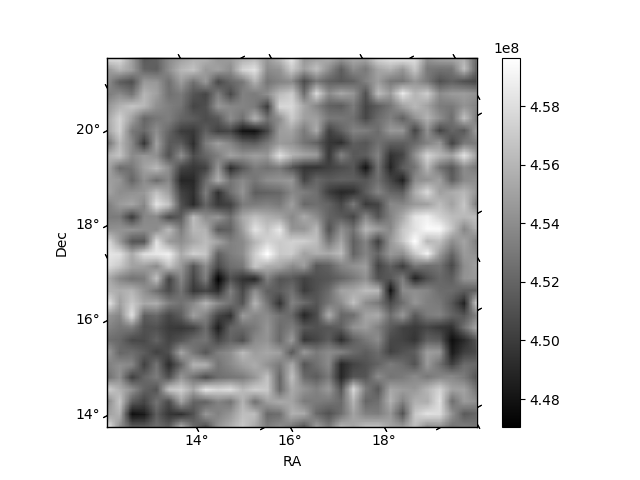
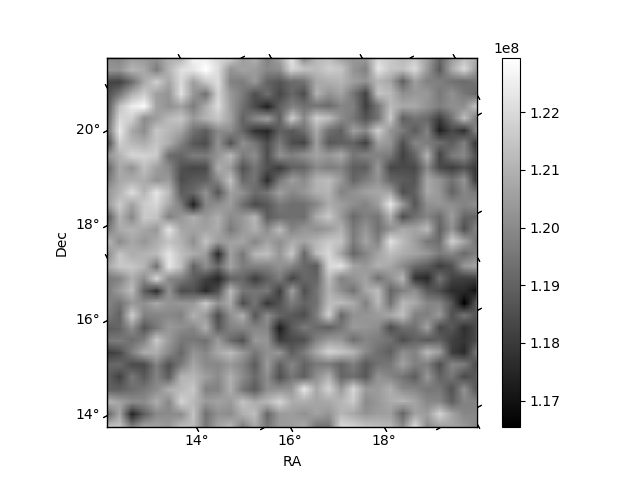
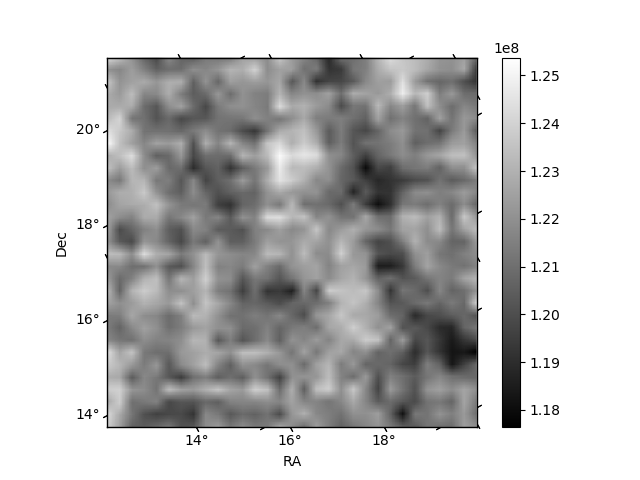
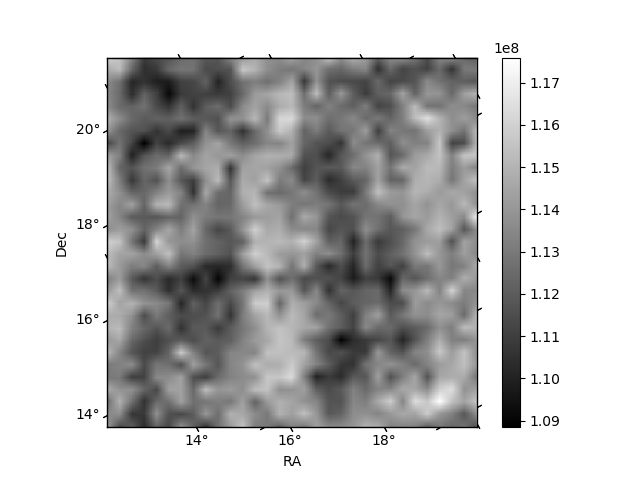
Histogram calculated using DETX and DETY for each event in the final _common_clean file
| Quadrant A | 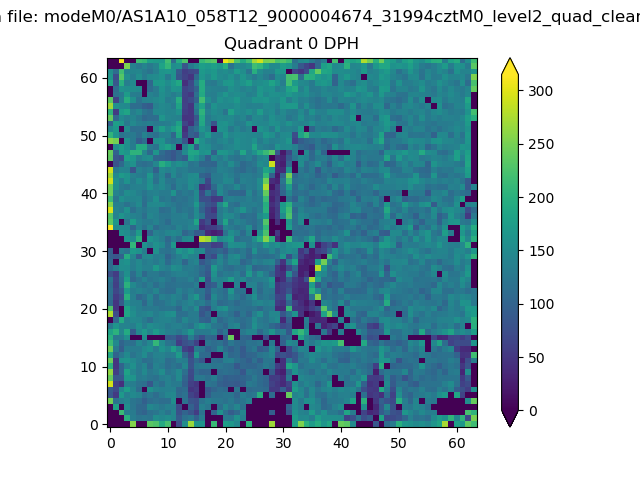 |
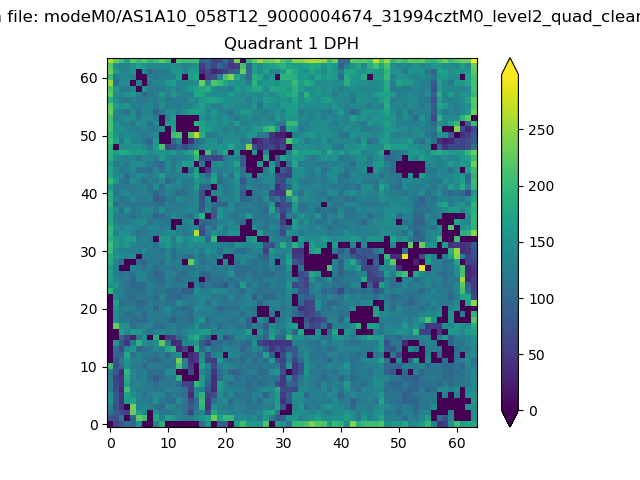 |
Quadrant B |
|---|---|---|---|
| Quadrant D | 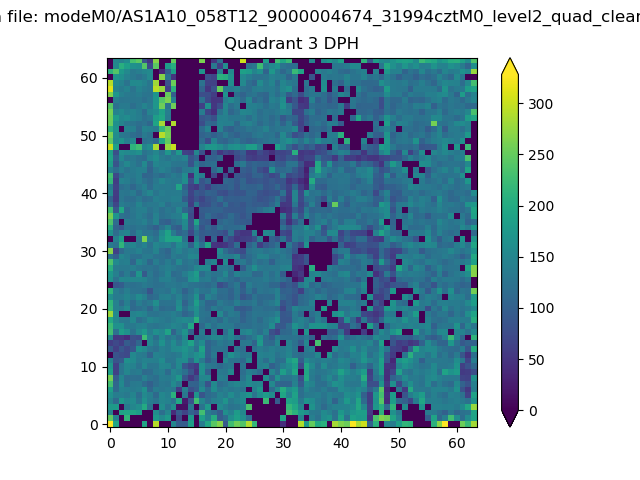 |
 |
Quadrant C |
| Plot type | Count rate plots | Images |
|---|---|---|
| Comparison with Poisson distribution Blue bars denote a histogram of data divided into 1 sec bins. Red curve is a Poisson curve with rate = median count rate of data. |
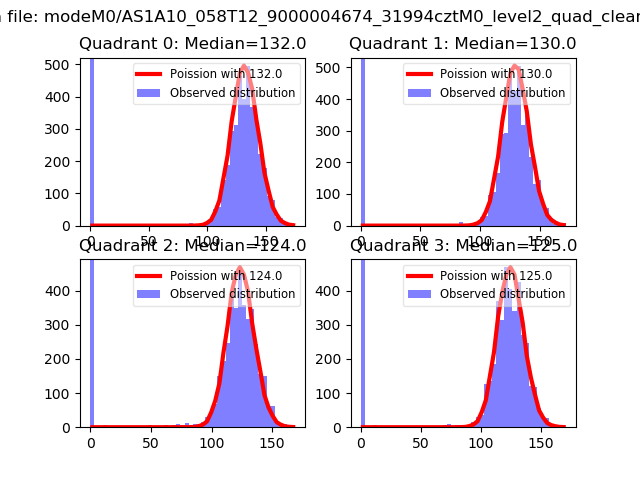 |
 |
| Quadrant-wise count rates Data is divided into 100 sec bins |
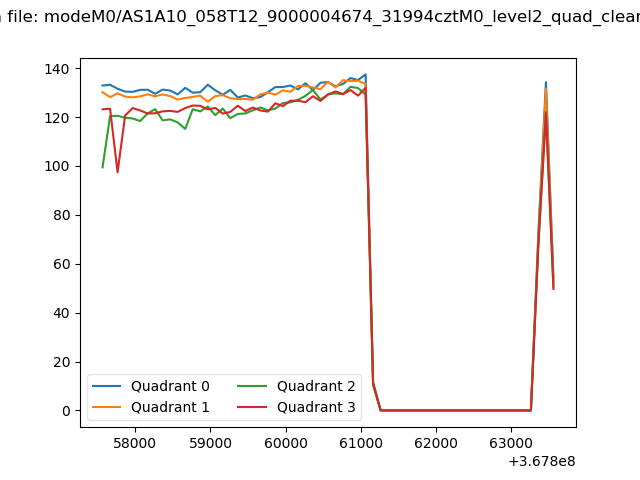 |
|
| Module-wise count rates for Quadrant A Data is divided into 100 sec bins |
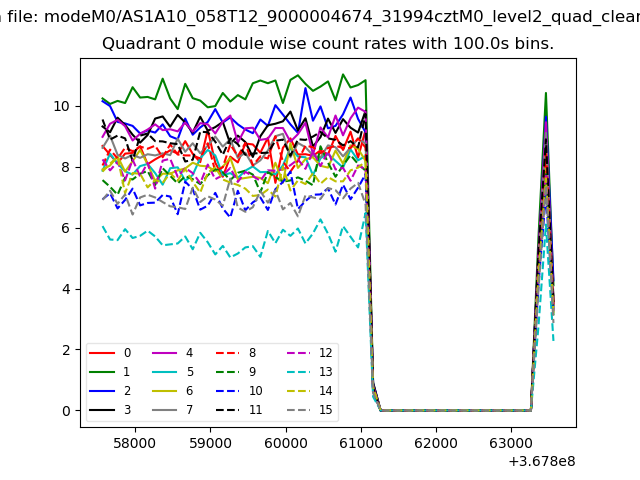 |
 |
| Module-wise count rates for Quadrant B Data is divided into 100 sec bins |
 |
 |
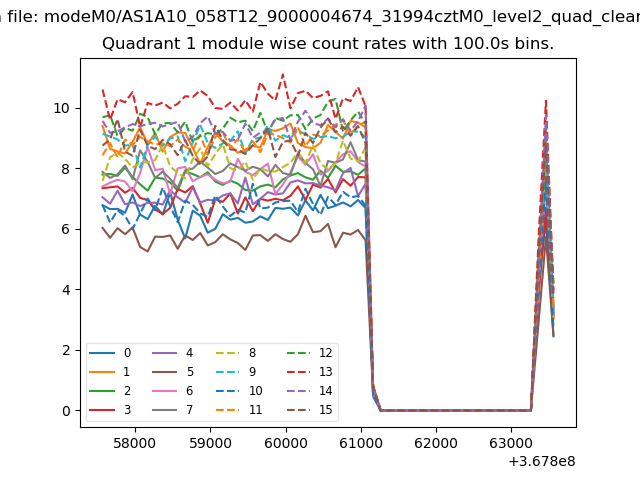
| Module-wise count rates for Quadrant C Data is divided into 100 sec bins |
 |
 |
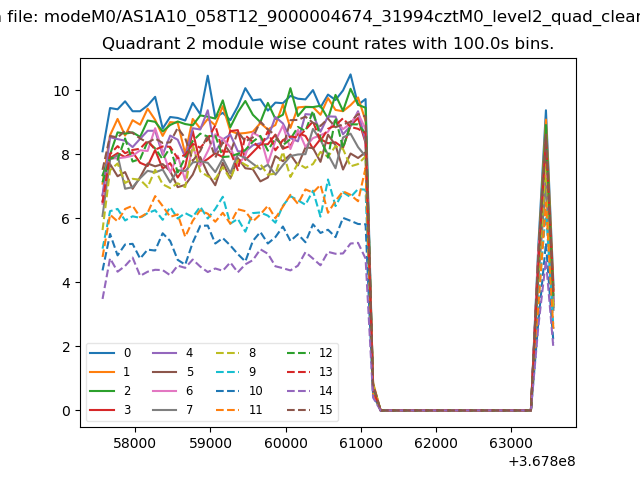
| Module-wise count rates for Quadrant D Data is divided into 100 sec bins |
 |
 |
| Parameter | Plot |
|---|---|
| CZT HV Monitor | 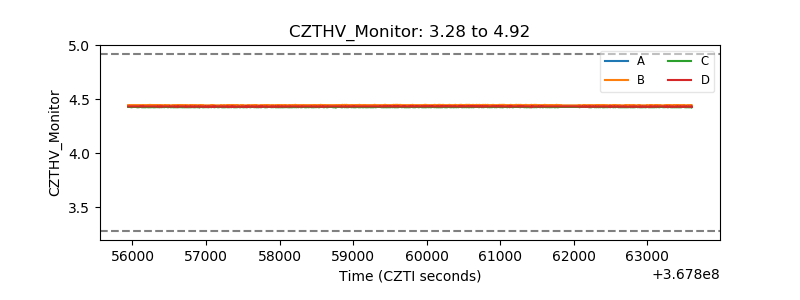 |
| D_VDD | 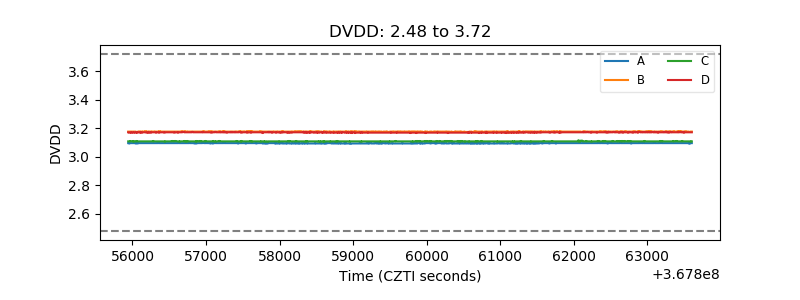 |
| Temperature 1 | 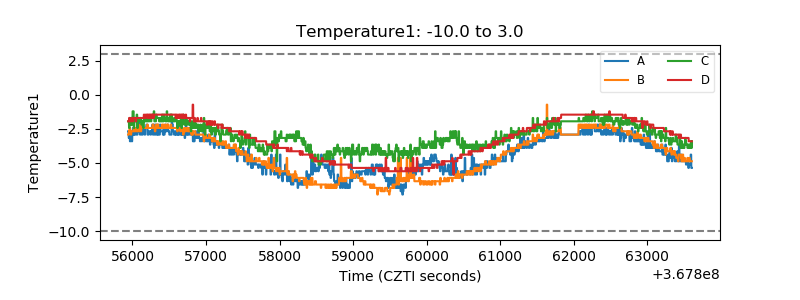 |
| Veto HV Monitor | 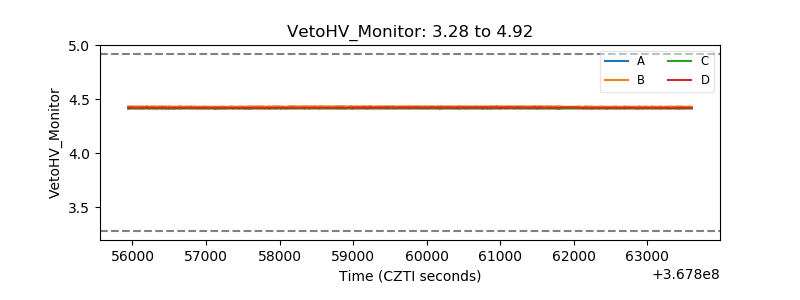 |
| Veto LLD | 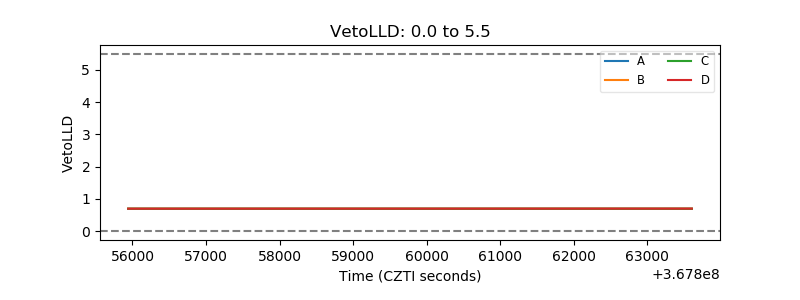 |
| Alpha Counter | 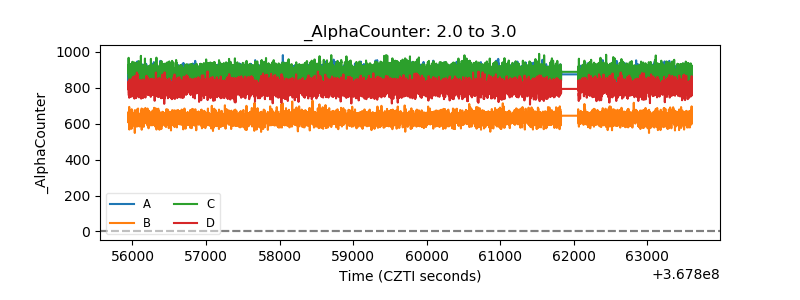 |
| _CPM_Rate | 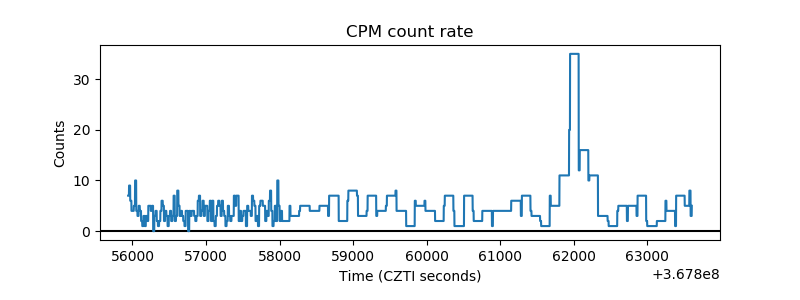 |
| CZT Counter | 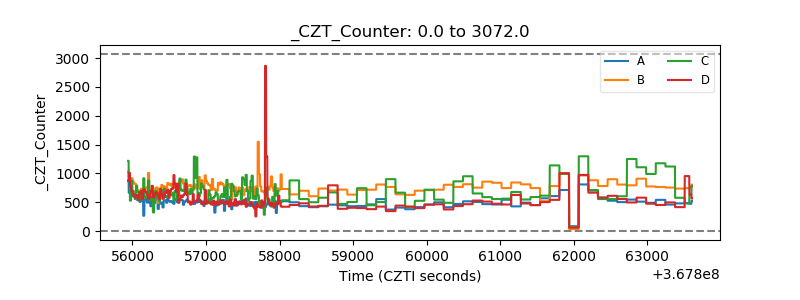 |
| +2.5 Volts monitor |  |
| +5 Volts monitor |  |
| _ROLL_ROT | 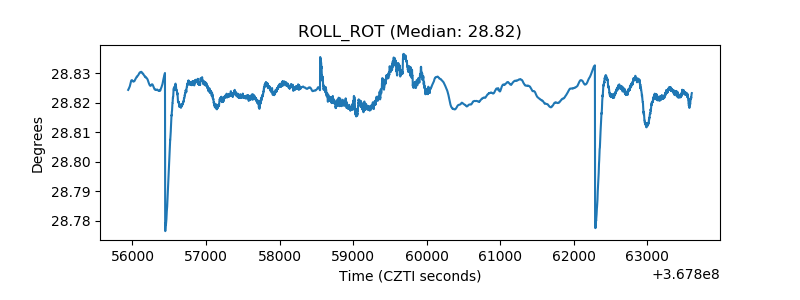 |
| _Roll_DEC | 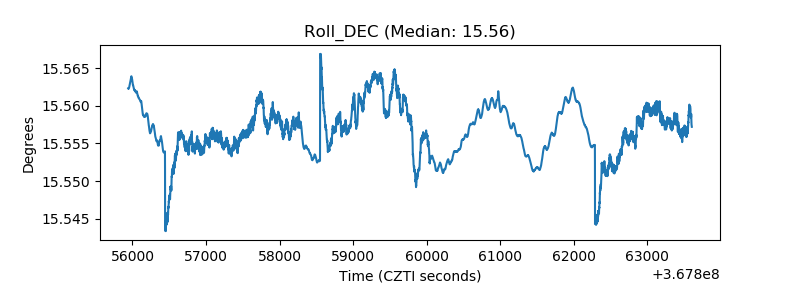 |
| _Roll_RA | 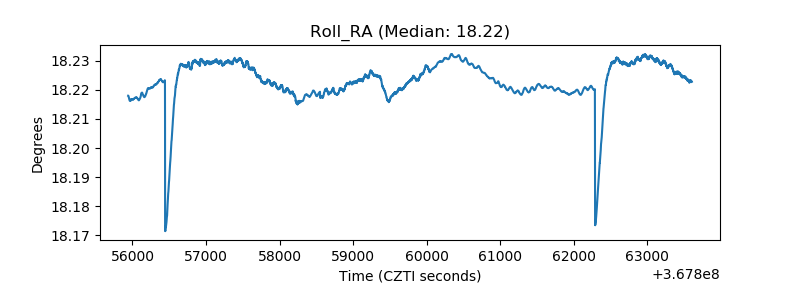 |
| Veto Counter | 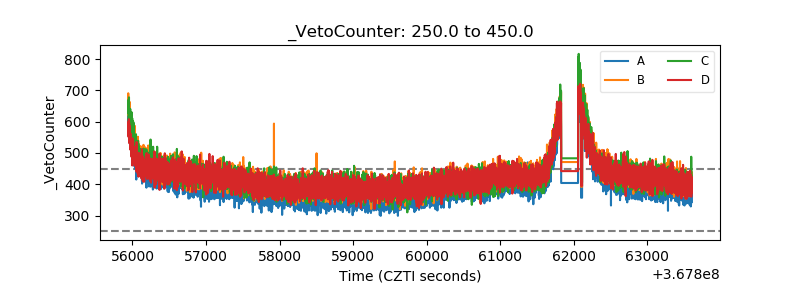 |