| Param | Original file | Final file |
|---|---|---|
| Filename | modeM0/AS1A10_058T12_9000004674_31995cztM0_level2.evt | modeM0/AS1A10_058T12_9000004674_31995cztM0_level2_quad_clean.evt |
| Size (bytes) | 136,330,560 | 11,246,400 |
| Size | 130.0 MB | 10.7 MB |
| Events in quadrant A | 734,316 | 61,131 |
| Events in quadrant B | 1,217,059 | 59,630 |
| Events in quadrant C | 1,142,485 | 56,278 |
| Events in quadrant D | 934,148 | 55,098 |
| Mode SS | |||
|---|---|---|---|
| Quadrant | BADHDUFLAG | Total packets | Discarded packets |
| A | 0 | 30 | 0 |
| B | 0 | 30 | 0 |
| C | 0 | 30 | 0 |
| D | 0 | 30 | 0 |
| Mode M0 | |||
|---|---|---|---|
| Quadrant | BADHDUFLAG | Total packets | Discarded packets |
| A | 0 | 2955 | 0 |
| B | 0 | 4608 | 0 |
| C | 0 | 4465 | 0 |
| D | 0 | 3606 | 0 |
| Quadrant | Total seconds | Saturated seconds | Saturation percentage |
|---|---|---|---|
| A | 1444 | 4 | 0.277008% |
| B | 1444 | 48 | 3.324100% |
| C | 1444 | 68 | 4.709141% |
| D | 1445 | 23 | 1.591696% |
Noise dominated data is calculated using 1-second bins in cleaned event files. If a bin has >2000 counts, and if more than 50% of those come from <1% of pixels, then it is considered to be noise-dominated and hence unusable.
| Quadrant | # 1 sec bins | Bins with >0 counts | Bins with >2000 counts | High rate bins dominated by noise | Noise dominated (total time) | Noise dominated (detector-on time) | Marked lightcurve |
|---|---|---|---|---|---|---|---|
| A | 1444 | 1444 | 0 | 0 | 0.00% | 0.00% | 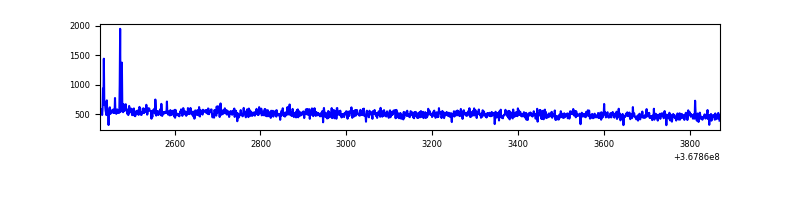 |
| B | 1444 | 1444 | 22 | 22 | 1.52% | 1.52% | 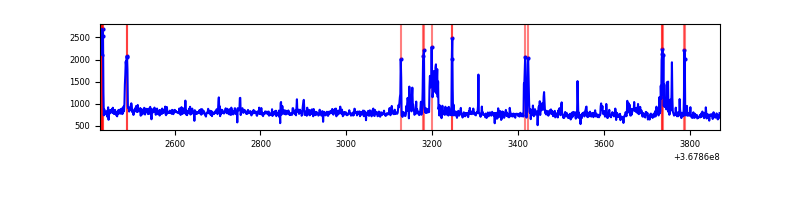 |
| C | 1444 | 1444 | 6 | 6 | 0.42% | 0.42% | 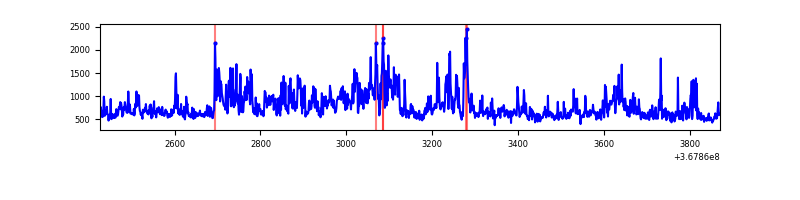 |
| D | 1445 | 1445 | 25 | 25 | 1.73% | 1.73% | 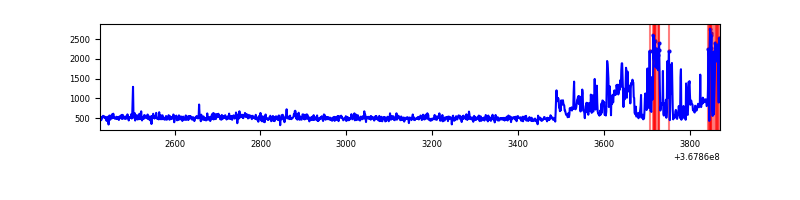 |
Top three noisy pixels from each quadrant. If the there are fewer than three noisy pixels in the level2.evt file, extra rows are filled as -1
| Pixel properties | Quadrant properties | ||||||
|---|---|---|---|---|---|---|---|
| Quadrant | DetID | PixID | Counts | Sigma | Mean | Median | Sigma |
| A | 1 | 113 | 7181 | 175.73 | 187 | 182 | 39.8 |
| A | 13 | 6 | 5208 | 126.19 | 187 | 182 | 39.8 |
| A | 13 | 254 | 2617 | 61.14 | 187 | 182 | 39.8 |
| B | 6 | 159 | 373497 | 9900.04 | 182 | 177 | 37.7 |
| B | 10 | 245 | 57213 | 1512.53 | 182 | 177 | 37.7 |
| B | 5 | 172 | 33532 | 884.54 | 182 | 177 | 37.7 |
| C | 3 | 233 | 364390 | 8430.94 | 175 | 176 | 43.2 |
| C | 14 | 238 | 31617 | 727.81 | 175 | 176 | 43.2 |
| C | 10 | 22 | 25511 | 586.46 | 175 | 176 | 43.2 |
| D | 11 | 164 | 206117 | 4529.48 | 180 | 175 | 45.5 |
| D | 8 | 195 | 29981 | 655.55 | 180 | 175 | 45.5 |
| D | 2 | 234 | 7836 | 168.5 | 180 | 175 | 45.5 |
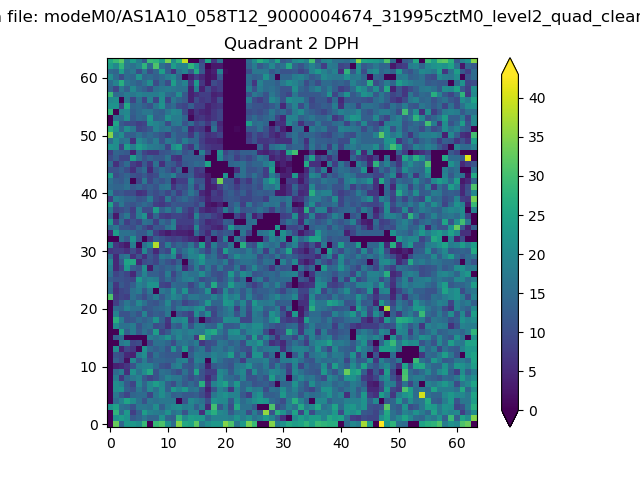
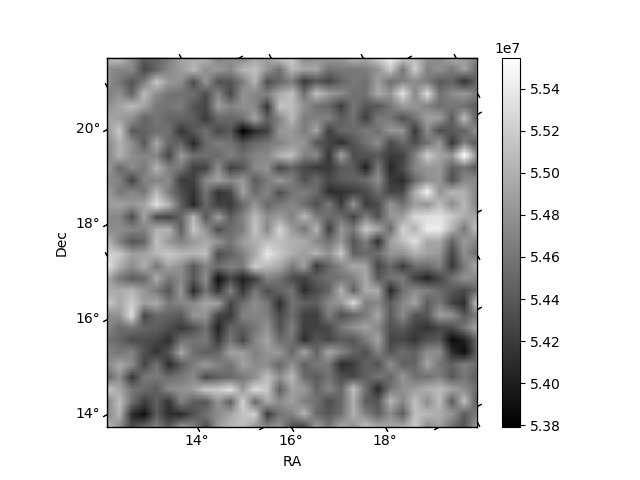
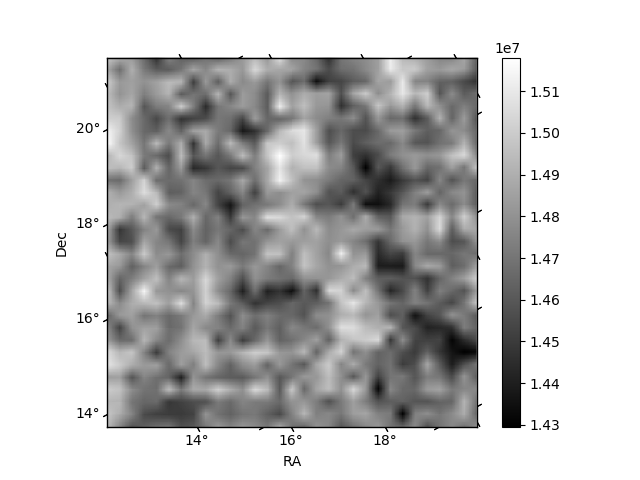
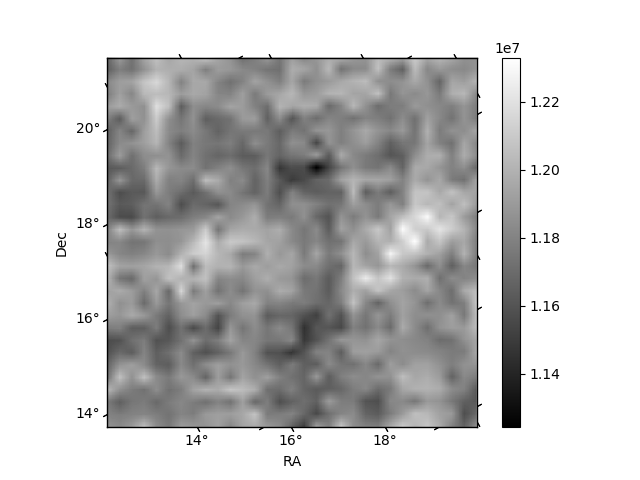
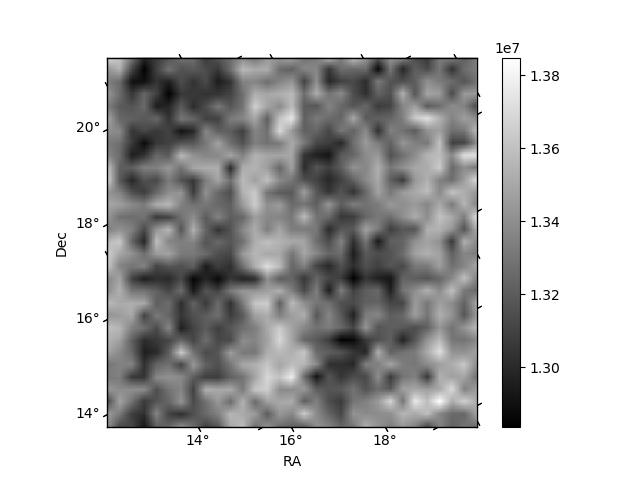
Histogram calculated using DETX and DETY for each event in the final _common_clean file
| Quadrant A | 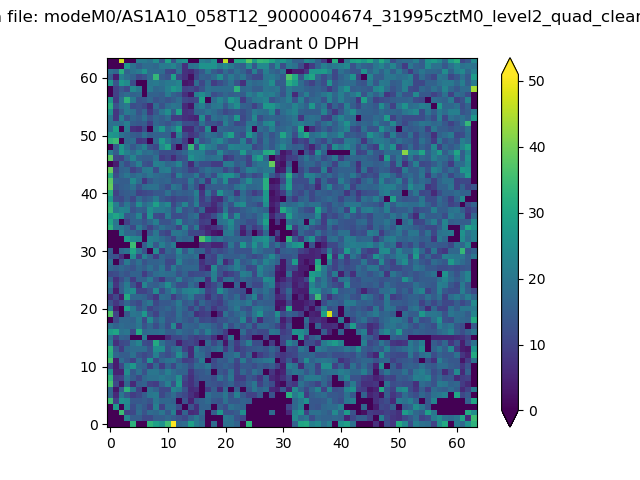 |
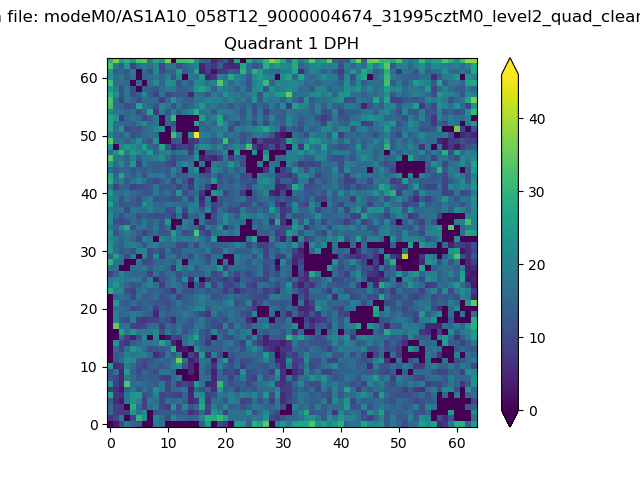 |
Quadrant B |
|---|---|---|---|
| Quadrant D | 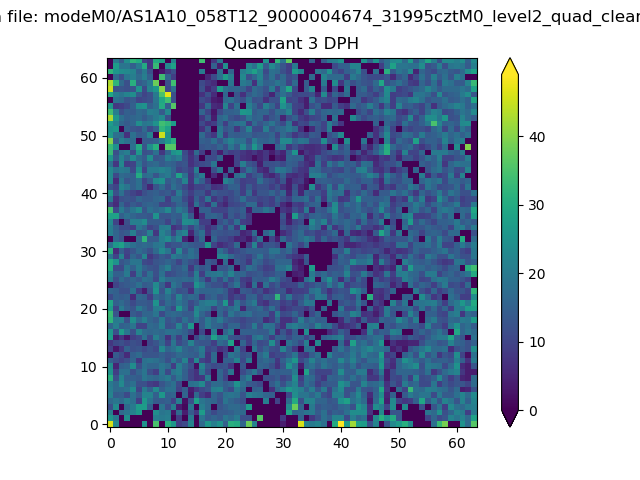 |
 |
Quadrant C |
| Plot type | Count rate plots | Images |
|---|---|---|
| Comparison with Poisson distribution Blue bars denote a histogram of data divided into 1 sec bins. Red curve is a Poisson curve with rate = median count rate of data. |
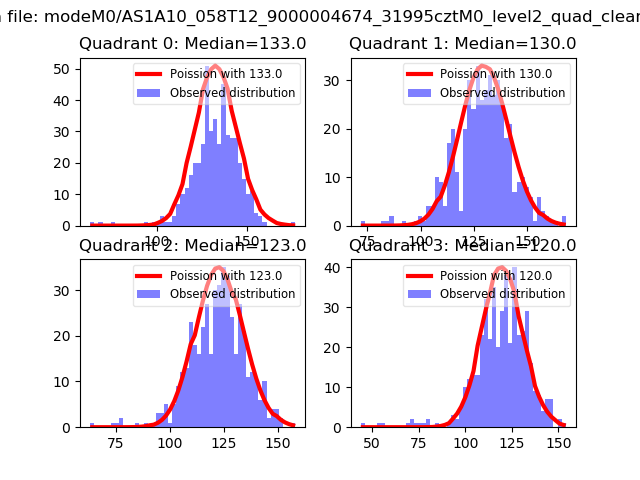 |
 |
| Quadrant-wise count rates Data is divided into 100 sec bins |
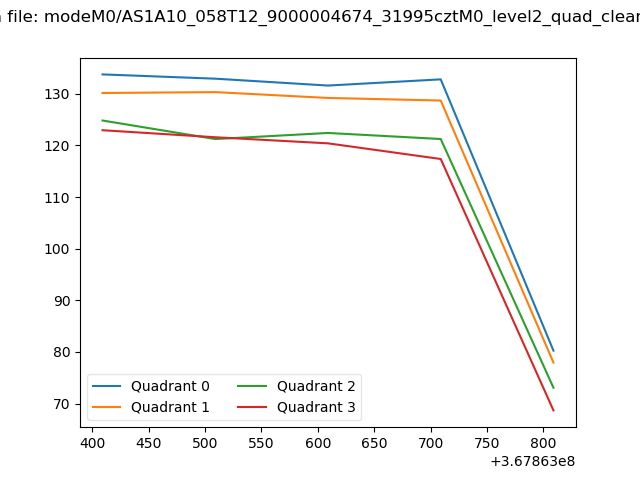 |
|
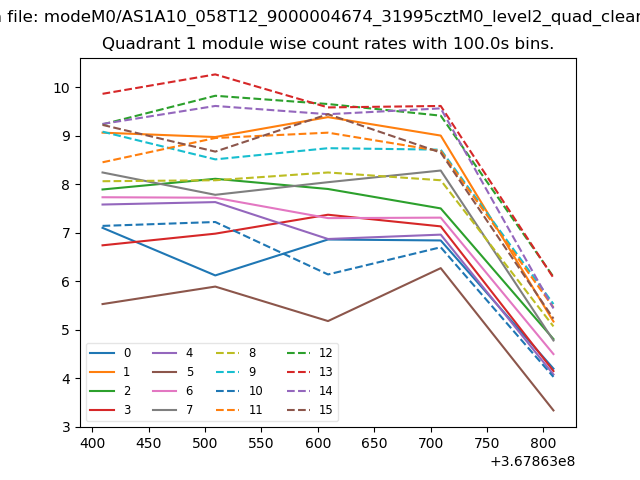
| Module-wise count rates for Quadrant A Data is divided into 100 sec bins |
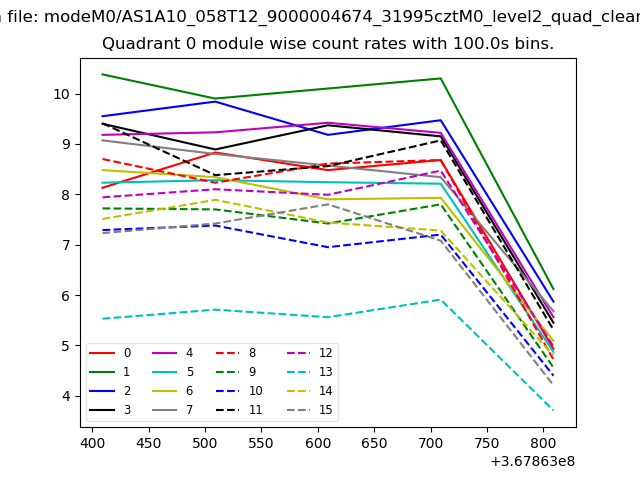 |
 |
| Module-wise count rates for Quadrant B Data is divided into 100 sec bins |
 |
 |
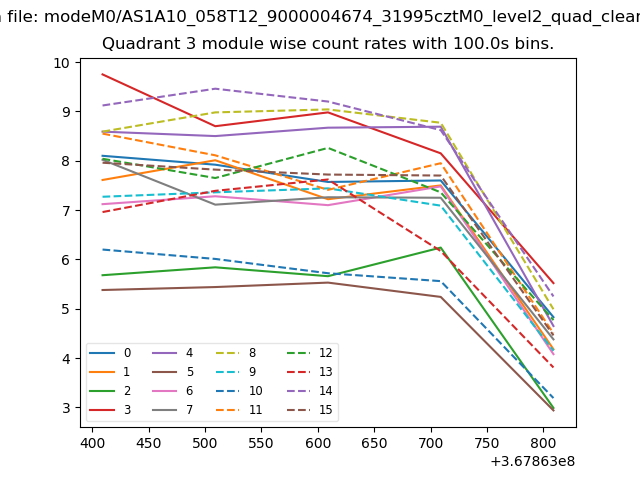
| Module-wise count rates for Quadrant C Data is divided into 100 sec bins |
 |
 |
| Module-wise count rates for Quadrant D Data is divided into 100 sec bins |
 |
 |
| Parameter | Plot |
|---|---|
| CZT HV Monitor | 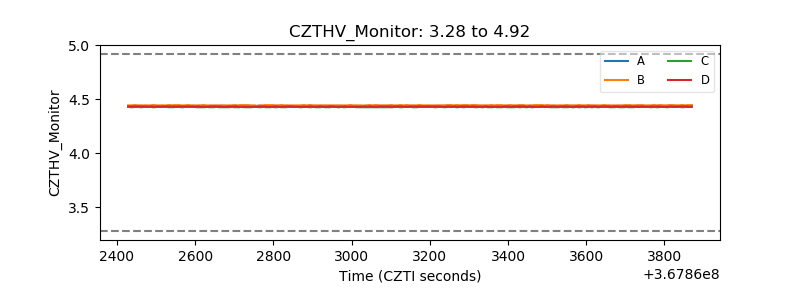 |
| D_VDD | 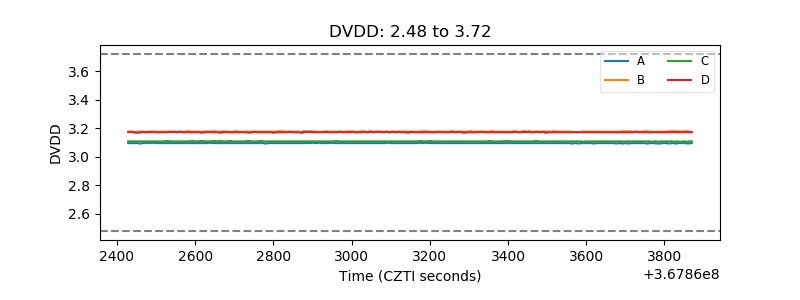 |
| Temperature 1 |  |
| Veto HV Monitor | 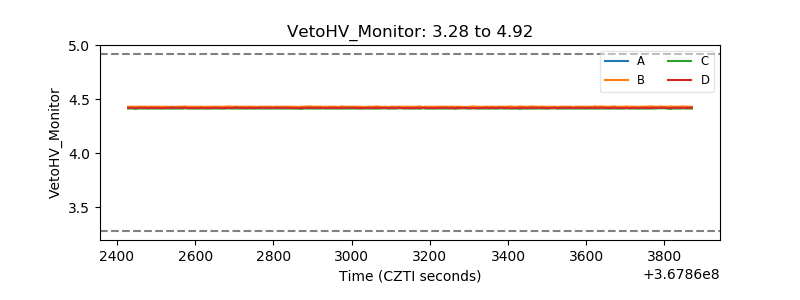 |
| Veto LLD | 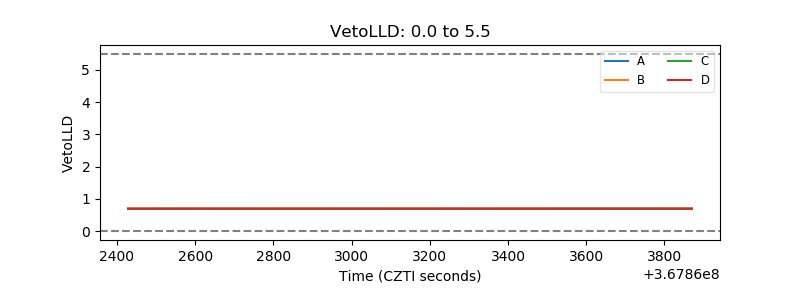 |
| Alpha Counter | 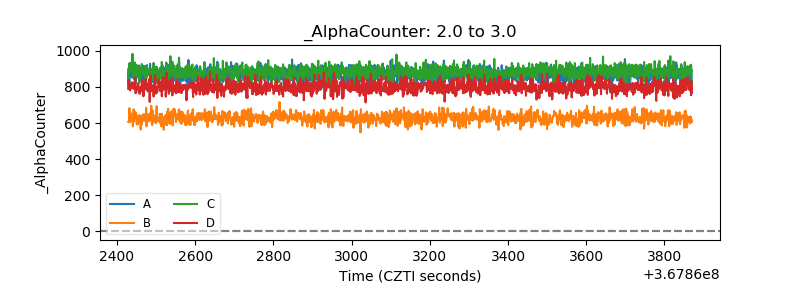 |
| _CPM_Rate | 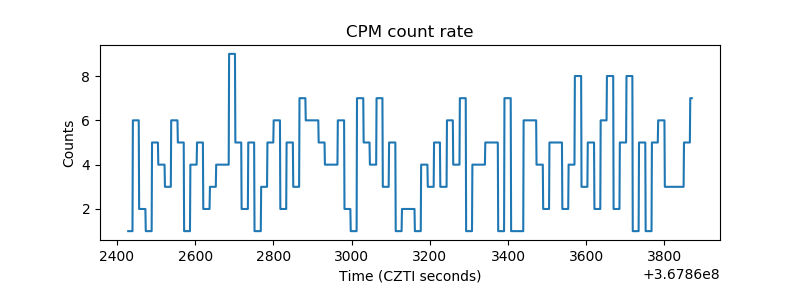 |
| CZT Counter | 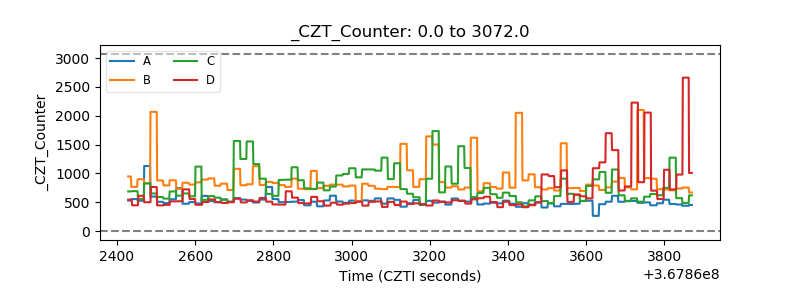 |
| +2.5 Volts monitor | 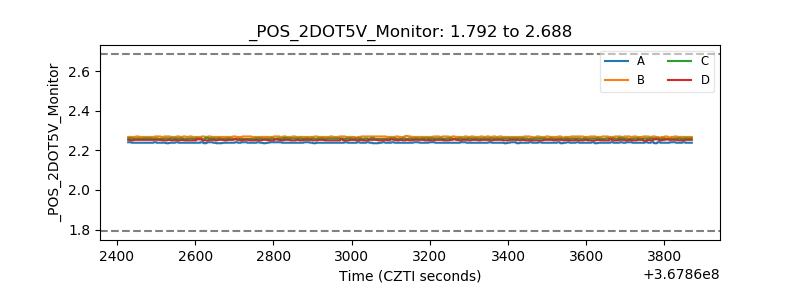 |
| +5 Volts monitor |  |
| _ROLL_ROT |  |
| _Roll_DEC | 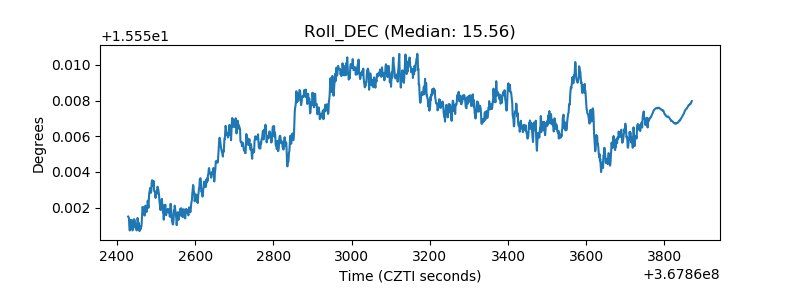 |
| _Roll_RA | 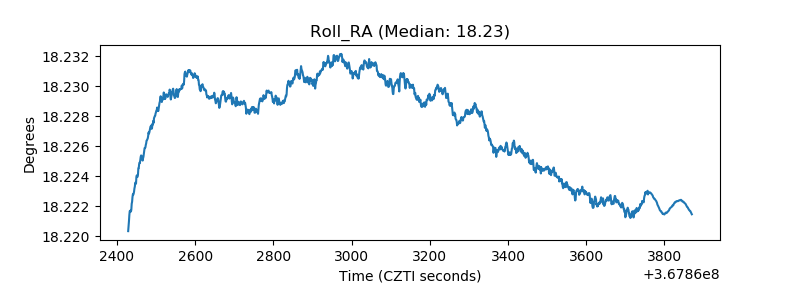 |
| Veto Counter | 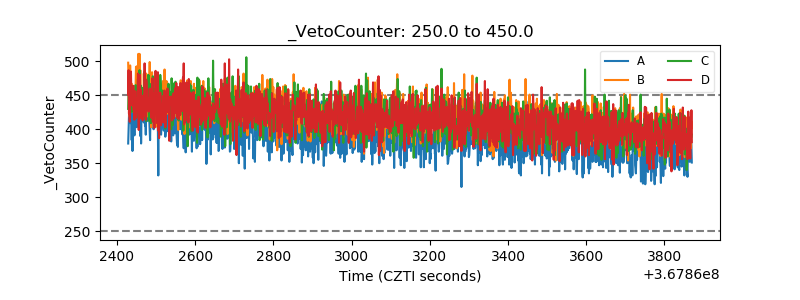 |