| Param | Original file | Final file |
|---|---|---|
| Filename | modeM0/AS1C06_010T03_9000004672cztM0_level2.fits | modeM0/AS1C06_010T03_9000004672cztM0_level2_quad_clean.evt |
| Size (bytes) | 187,816,320 | 170,259,840 |
| Size | 179.1 MB | 162.4 MB |
| Events in quadrant A | 1,221,056 | 1,070,457 |
| Events in quadrant B | 1,086,310 | 998,632 |
| Events in quadrant C | 1,133,190 | 966,434 |
| Events in quadrant D | 999,102 | 872,049 |
| Mode M0 | |||
|---|---|---|---|
| Quadrant | BADHDUFLAG | Total packets | Discarded packets |
| A | 0 | 37544 | 0 |
| B | 0 | 62983 | 0 |
| C | 0 | 44328 | 0 |
| D | 0 | 60550 | 0 |
| Mode SS | |||
|---|---|---|---|
| Quadrant | BADHDUFLAG | Total packets | Discarded packets |
| A | 0 | 368 | 0 |
| B | 0 | 368 | 0 |
| C | 0 | 368 | 0 |
| D | 0 | 368 | 0 |
| Mode M9 | |||
|---|---|---|---|
| Quadrant | BADHDUFLAG | Total packets | Discarded packets |
| A | 0 | 37 | 0 |
| B | 0 | 37 | 0 |
| C | 0 | 37 | 0 |
| D | 0 | 37 | 0 |
| Quadrant | Total seconds | Saturated seconds | Saturation percentage |
|---|---|---|---|
| A | 18097 | 262 | 1.447754% |
| B | 18097 | 1521 | 8.404708% |
| C | 18097 | 987 | 5.453943% |
| D | 18097 | 1176 | 6.498315% |
Noise dominated data is calculated using 1-second bins in cleaned event files. If a bin has >2000 counts, and if more than 50% of those come from <1% of pixels, then it is considered to be noise-dominated and hence unusable.
| Quadrant | # 1 sec bins | Bins with >0 counts | Bins with >2000 counts | High rate bins dominated by noise | Noise dominated (total time) | Noise dominated (detector-on time) | Marked lightcurve |
|---|---|---|---|---|---|---|---|
| A | 21446 | 18093 | 0 | 0 | 0.00% | 0.00% |  |
| B | 21445 | 18074 | 0 | 0 | 0.00% | 0.00% |  |
| C | 21445 | 18088 | 0 | 0 | 0.00% | 0.00% | 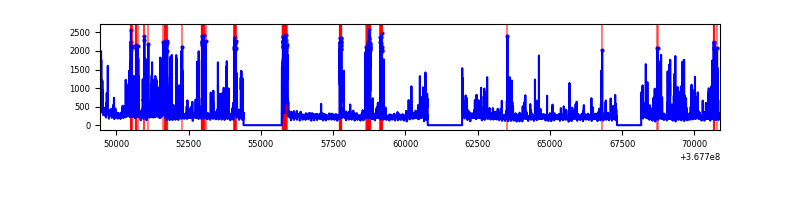 |
| D | 21446 | 18053 | 0 | 0 | 0.00% | 0.00% |  |
Top three noisy pixels from each quadrant. If the there are fewer than three noisy pixels in the level2.evt file, extra rows are filled as -1
| Pixel properties | Quadrant properties | ||||||
|---|---|---|---|---|---|---|---|
| Quadrant | DetID | PixID | Counts | Sigma | Mean | Median | Sigma |
| A | 0 | 29 | 1215 | 11.78 | 318 | 303 | 77.4 |
| A | 0 | 30 | 977 | 8.7 | 318 | 303 | 77.4 |
| A | 7 | 110 | 970 | 8.61 | 318 | 303 | 77.4 |
| B | 2 | 9 | 874 | 10.33 | 289 | 279 | 57.6 |
| B | 3 | 80 | 743 | 8.06 | 289 | 279 | 57.6 |
| B | 5 | 128 | 737 | 7.95 | 289 | 279 | 57.6 |
| C | 12 | 241 | 808 | 6.81 | 301 | 286 | 76.6 |
| C | 3 | 187 | 799 | 6.7 | 301 | 286 | 76.6 |
| C | 3 | 126 | 752 | 6.08 | 301 | 286 | 76.6 |
| D | 6 | 231 | 757 | 6.3 | 286 | 262 | 78.5 |
| D | 10 | 189 | 742 | 6.11 | 286 | 262 | 78.5 |
| D | 7 | 3 | 731 | 5.97 | 286 | 262 | 78.5 |
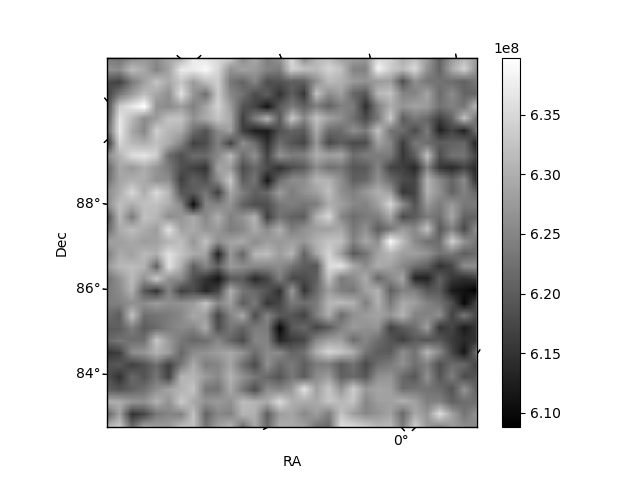
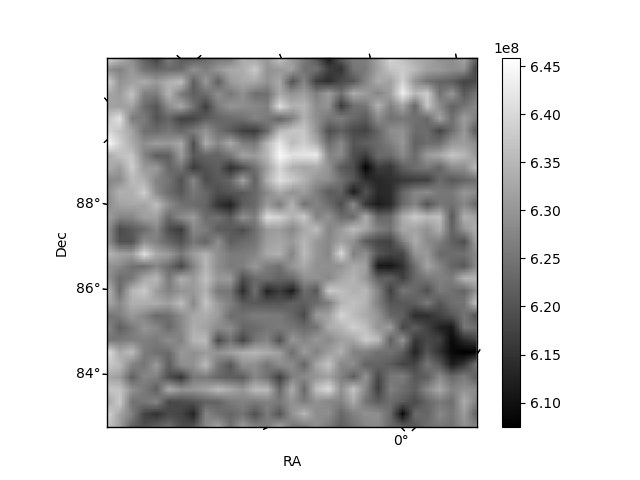
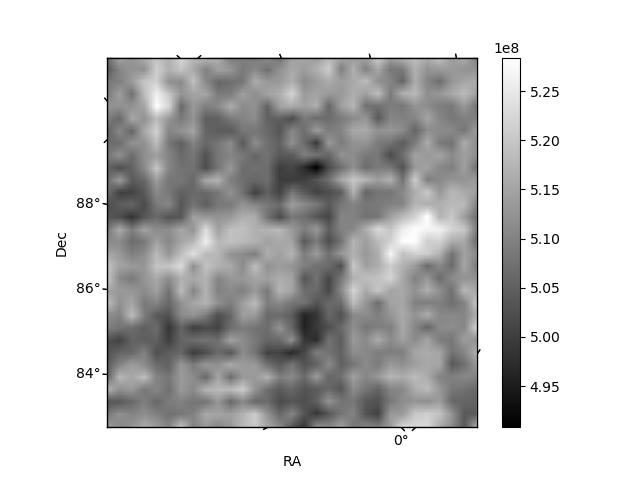
Histogram calculated using DETX and DETY for each event in the final _common_clean file
| Quadrant A | 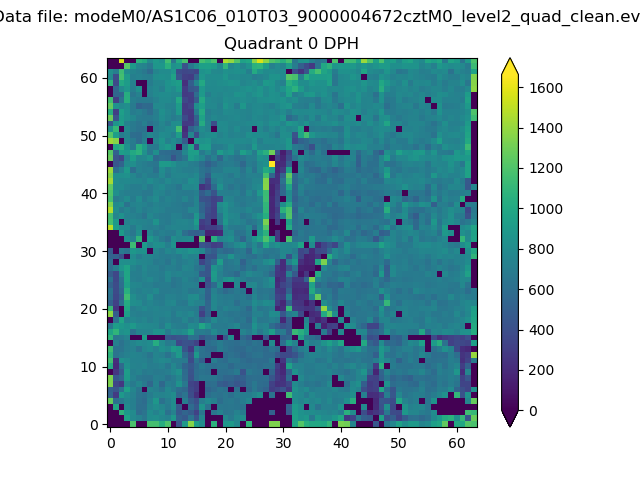 |
 |
Quadrant B |
|---|---|---|---|
| Quadrant D |  |
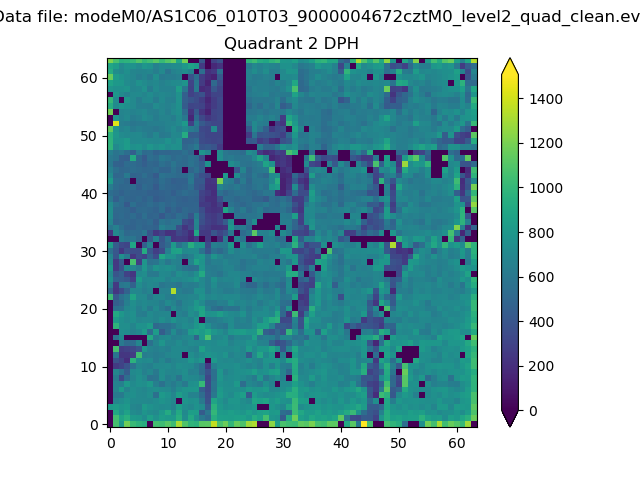 |
Quadrant C |
| Plot type | Count rate plots | Images |
|---|---|---|
| Comparison with Poisson distribution Blue bars denote a histogram of data divided into 1 sec bins. Red curve is a Poisson curve with rate = median count rate of data. |
 |
 |
| Quadrant-wise count rates Data is divided into 100 sec bins |
 |
|
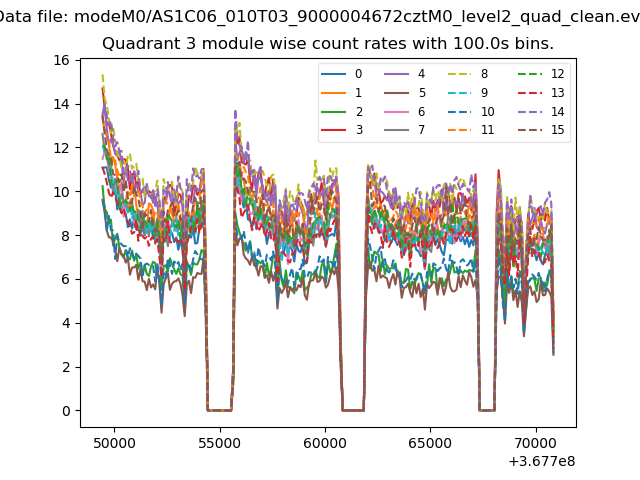
| Module-wise count rates for Quadrant A Data is divided into 100 sec bins |
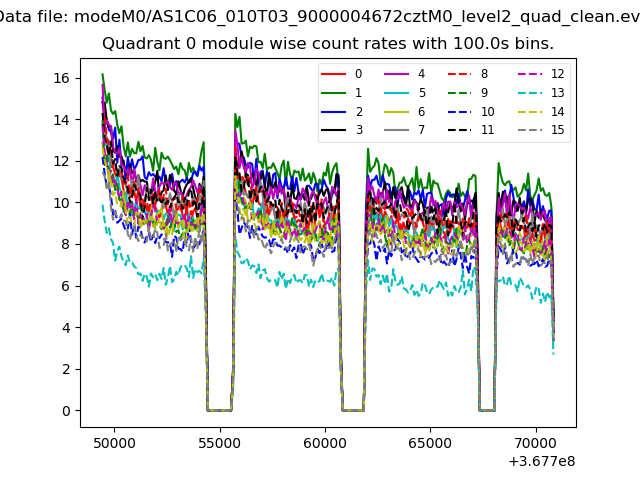 |
 |
| Module-wise count rates for Quadrant B Data is divided into 100 sec bins |
 |
 |
| Module-wise count rates for Quadrant C Data is divided into 100 sec bins |
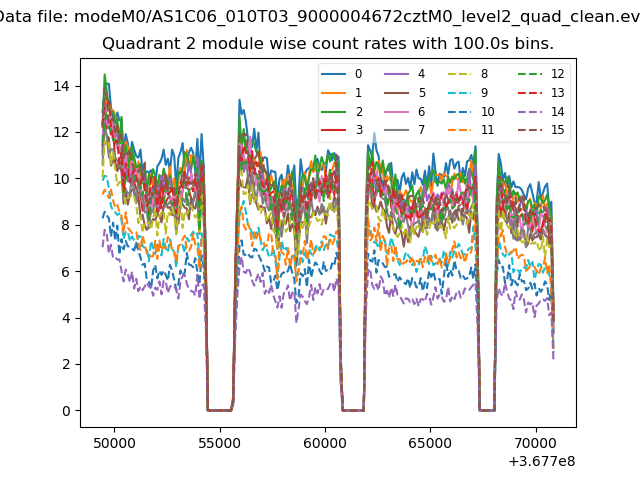 |
 |
| Module-wise count rates for Quadrant D Data is divided into 100 sec bins |
 |
 |
| Parameter | Plot |
|---|---|
| CZT HV Monitor | 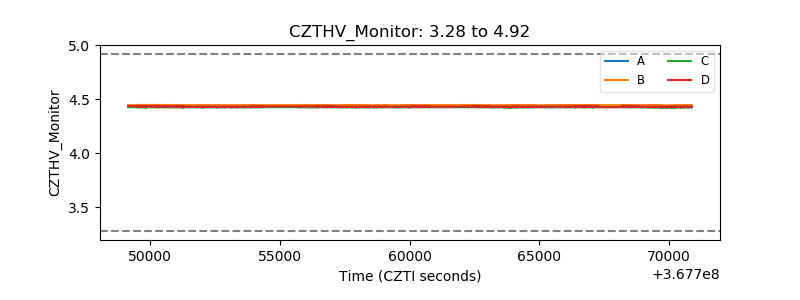 |
| D_VDD |  |
| Temperature 1 |  |
| Veto HV Monitor |  |
| Veto LLD |  |
| Alpha Counter |  |
| _CPM_Rate |  |
| CZT Counter |  |
| +2.5 Volts monitor |  |
| +5 Volts monitor |  |
| _ROLL_ROT |  |
| _Roll_DEC | 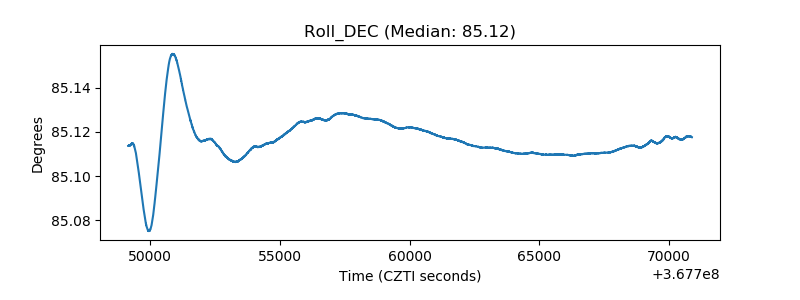 |
| _Roll_RA |  |
| Veto Counter |  |