| Param | Original file | Final file |
|---|---|---|
| Filename | modeM0/AS1C06_010T03_9000004672_31975cztM0_level2.evt | modeM0/AS1C06_010T03_9000004672_31975cztM0_level2_quad_clean.evt |
| Size (bytes) | 188,804,160 | 36,051,840 |
| Size | 180.1 MB | 34.4 MB |
| Events in quadrant A | 843,234 | 264,186 |
| Events in quadrant B | 2,039,663 | 229,697 |
| Events in quadrant C | 1,069,120 | 246,099 |
| Events in quadrant D | 1,664,593 | 242,645 |
| Mode M0 | |||
|---|---|---|---|
| Quadrant | BADHDUFLAG | Total packets | Discarded packets |
| A | 0 | 3401 | 1 |
| B | 0 | 6999 | 1 |
| C | 0 | 4149 | 2 |
| D | 0 | 6003 | 1 |
| Mode SS | |||
|---|---|---|---|
| Quadrant | BADHDUFLAG | Total packets | Discarded packets |
| A | 0 | 30 | 0 |
| B | 0 | 30 | 0 |
| C | 0 | 30 | 0 |
| D | 0 | 30 | 0 |
| Mode M9 | |||
|---|---|---|---|
| Quadrant | BADHDUFLAG | Total packets | Discarded packets |
| A | 0 | 3 | 0 |
| B | 0 | 3 | 0 |
| C | 0 | 3 | 0 |
| D | 0 | 3 | 0 |
| Quadrant | Total seconds | Saturated seconds | Saturation percentage |
|---|---|---|---|
| A | 1462 | 15 | 1.025992% |
| B | 1462 | 478 | 32.694938% |
| C | 1461 | 95 | 6.502396% |
| D | 1461 | 26 | 1.779603% |
Noise dominated data is calculated using 1-second bins in cleaned event files. If a bin has >2000 counts, and if more than 50% of those come from <1% of pixels, then it is considered to be noise-dominated and hence unusable.
| Quadrant | # 1 sec bins | Bins with >0 counts | Bins with >2000 counts | High rate bins dominated by noise | Noise dominated (total time) | Noise dominated (detector-on time) | Marked lightcurve |
|---|---|---|---|---|---|---|---|
| A | 1462 | 1462 | 0 | 0 | 0.00% | 0.00% | 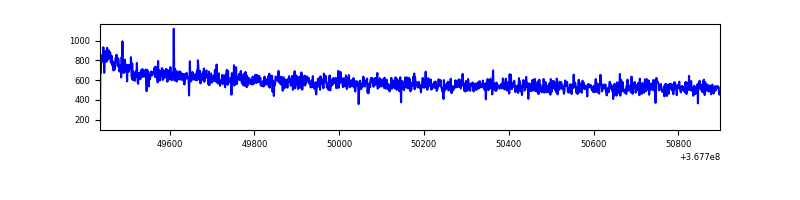 |
| B | 1461 | 1461 | 380 | 380 | 26.01% | 26.01% | 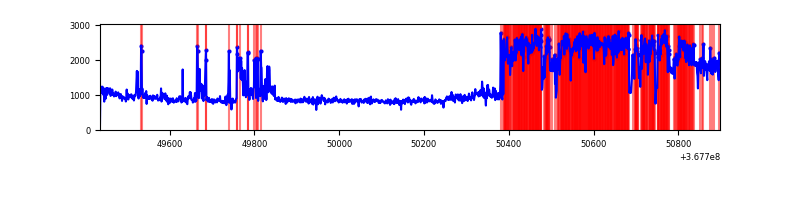 |
| C | 1461 | 1461 | 47 | 47 | 3.22% | 3.22% | 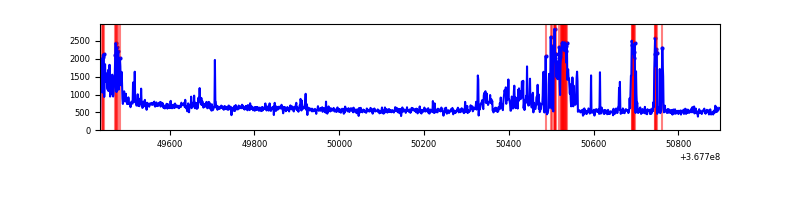 |
| D | 1461 | 1461 | 2 | 2 | 0.14% | 0.14% | 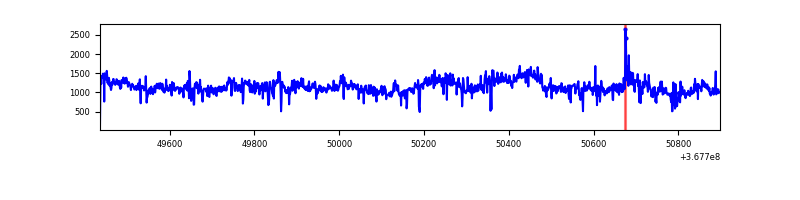 |
Top three noisy pixels from each quadrant. If the there are fewer than three noisy pixels in the level2.evt file, extra rows are filled as -1
| Pixel properties | Quadrant properties | ||||||
|---|---|---|---|---|---|---|---|
| Quadrant | DetID | PixID | Counts | Sigma | Mean | Median | Sigma |
| A | 13 | 254 | 2604 | 54.53 | 218 | 215 | 43.8 |
| A | 3 | 137 | 1859 | 37.53 | 218 | 215 | 43.8 |
| A | 0 | 226 | 1855 | 37.44 | 218 | 215 | 43.8 |
| B | 10 | 245 | 938961 | 26027.82 | 189 | 185 | 36.1 |
| B | 6 | 159 | 341689 | 9468.29 | 189 | 185 | 36.1 |
| B | 0 | 190 | 9143 | 248.36 | 189 | 185 | 36.1 |
| C | 0 | 10 | 241402 | 5227.32 | 197 | 198 | 46.1 |
| C | 14 | 238 | 34309 | 739.25 | 197 | 198 | 46.1 |
| C | 4 | 175 | 17537 | 375.77 | 197 | 198 | 46.1 |
| D | 11 | 164 | 802367 | 16506.87 | 204 | 199 | 48.6 |
| D | 8 | 195 | 51310 | 1051.75 | 204 | 199 | 48.6 |
| D | 7 | 238 | 36230 | 741.44 | 204 | 199 | 48.6 |
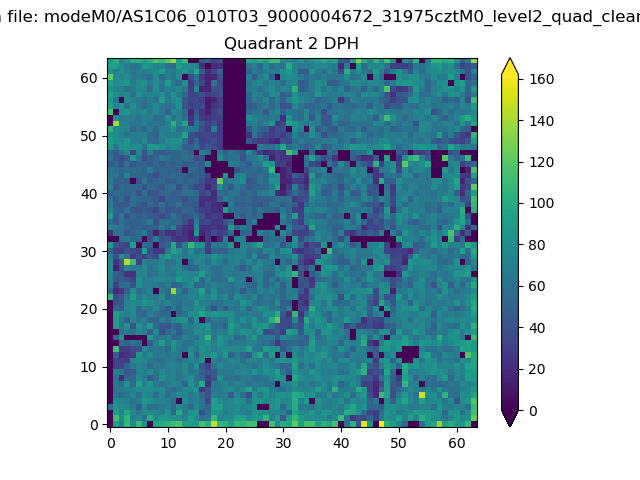
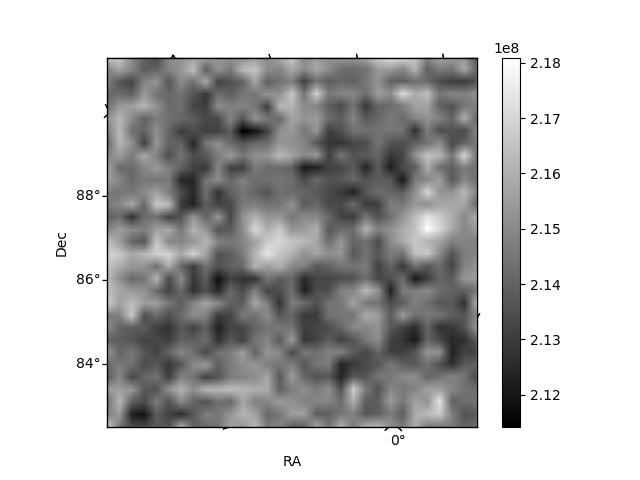
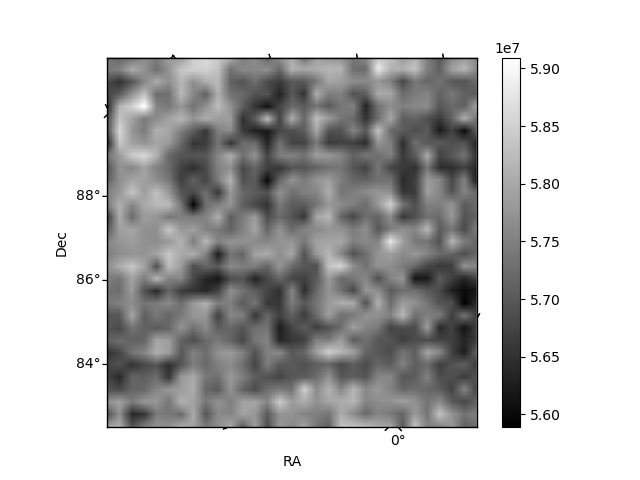
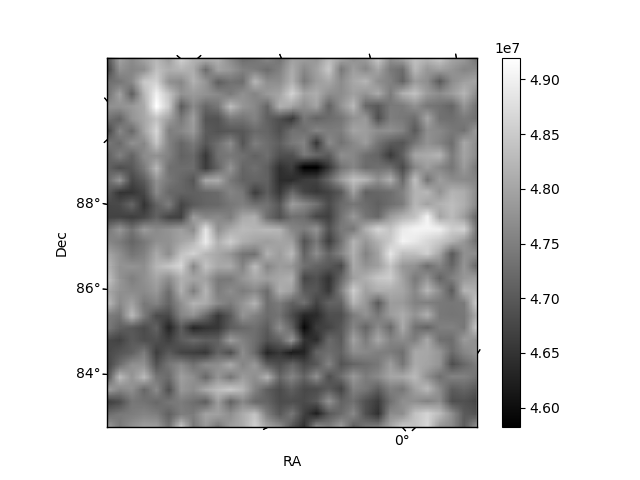
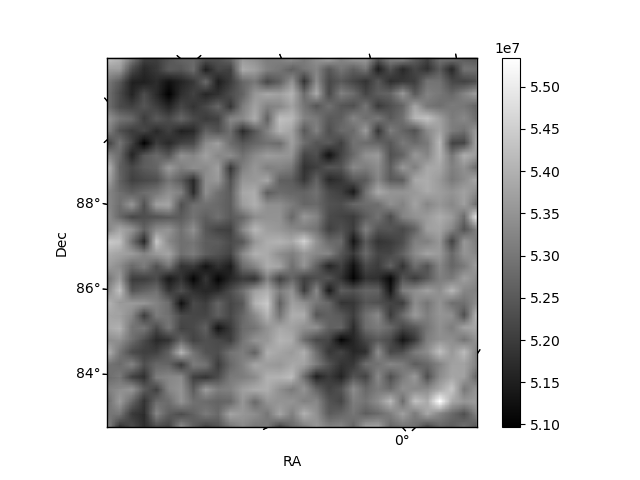
Histogram calculated using DETX and DETY for each event in the final _common_clean file
| Quadrant A | 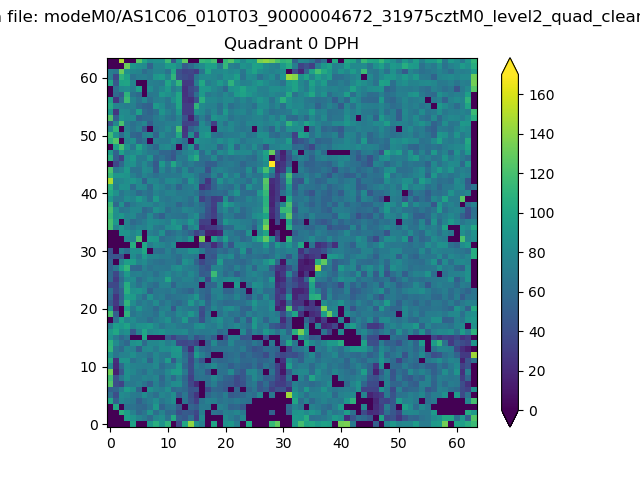 |
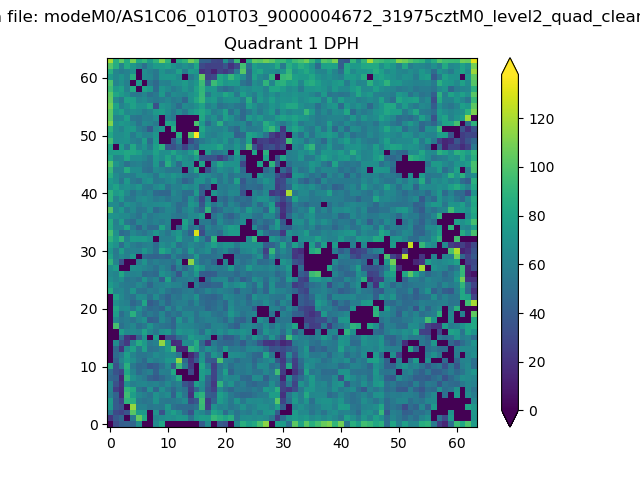 |
Quadrant B |
|---|---|---|---|
| Quadrant D | 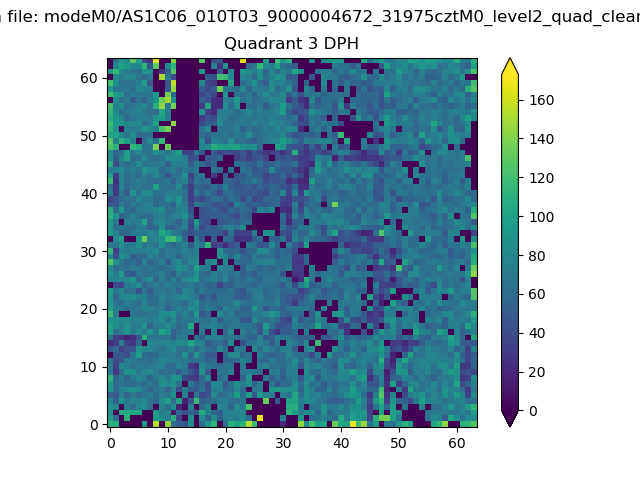 |
 |
Quadrant C |
| Plot type | Count rate plots | Images |
|---|---|---|
| Comparison with Poisson distribution Blue bars denote a histogram of data divided into 1 sec bins. Red curve is a Poisson curve with rate = median count rate of data. |
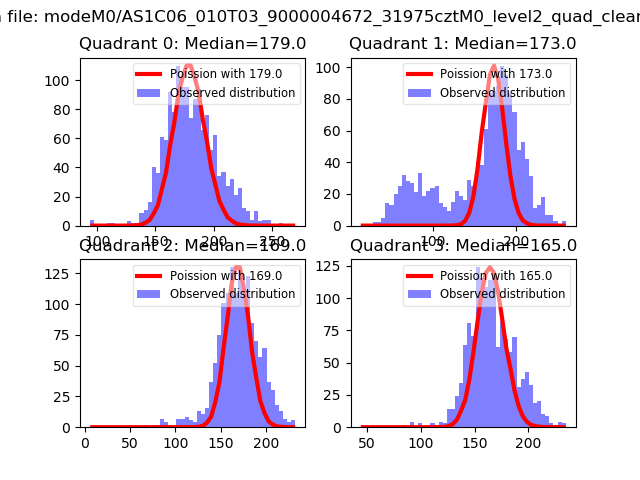 |
 |
| Quadrant-wise count rates Data is divided into 100 sec bins |
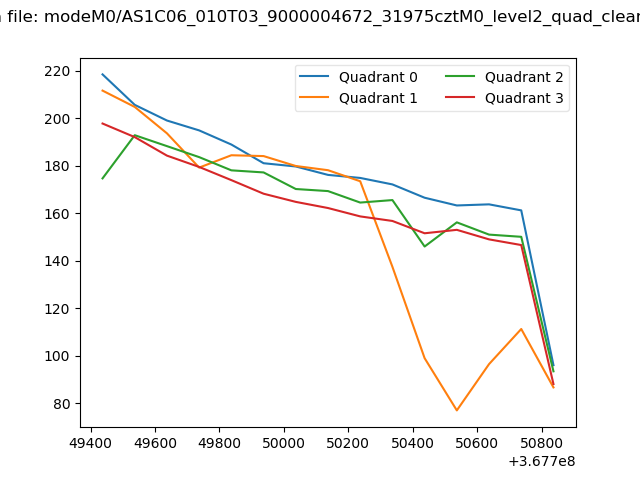 |
|
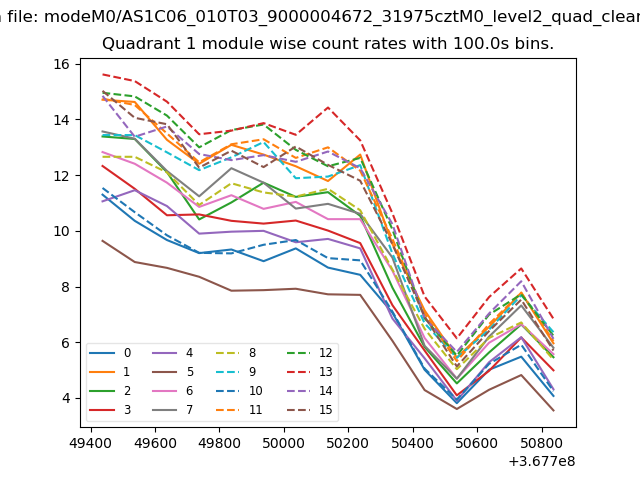
| Module-wise count rates for Quadrant A Data is divided into 100 sec bins |
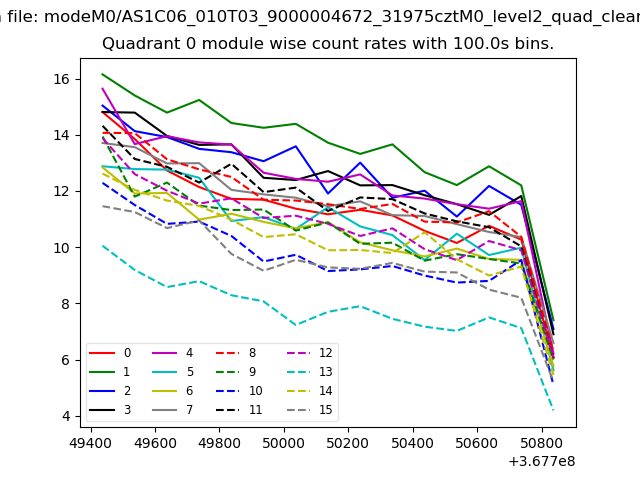 |
 |
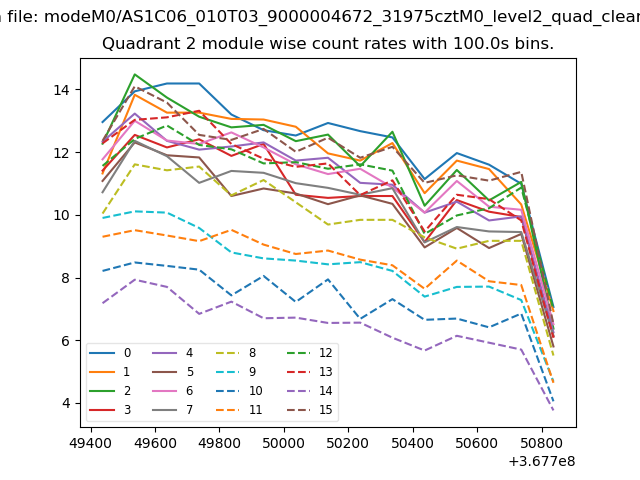
| Module-wise count rates for Quadrant B Data is divided into 100 sec bins |
 |
 |
| Module-wise count rates for Quadrant C Data is divided into 100 sec bins |
 |
 |
| Module-wise count rates for Quadrant D Data is divided into 100 sec bins |
 |
 |
| Parameter | Plot |
|---|---|
| CZT HV Monitor | 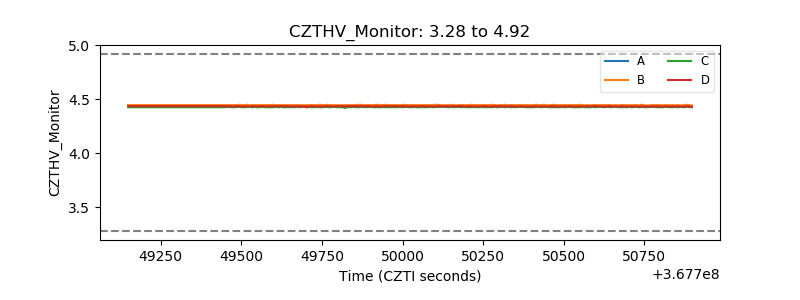 |
| D_VDD | 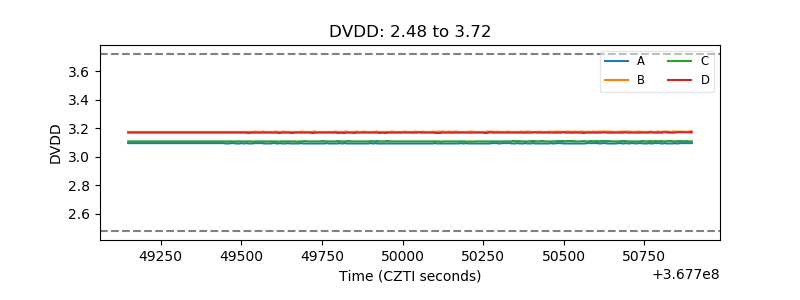 |
| Temperature 1 | 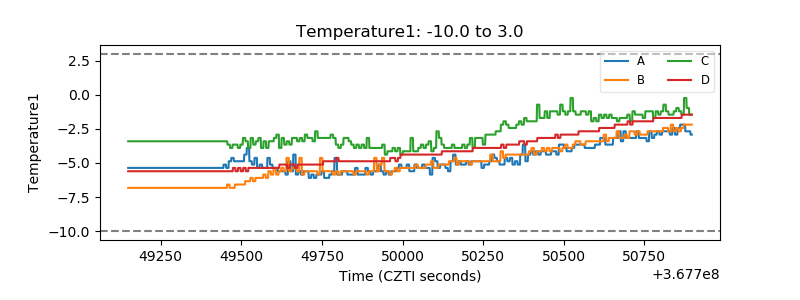 |
| Veto HV Monitor | 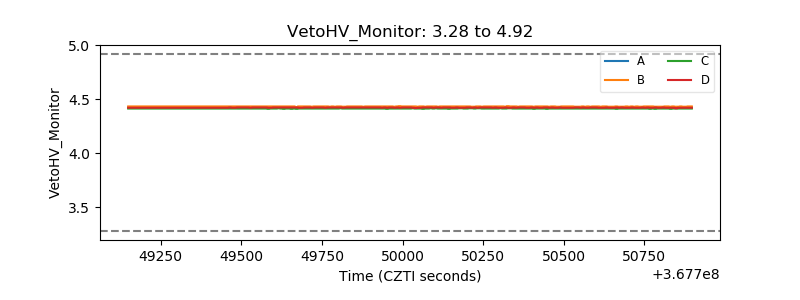 |
| Veto LLD | 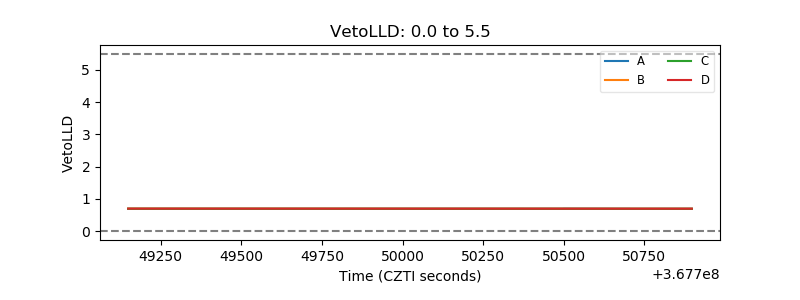 |
| Alpha Counter | 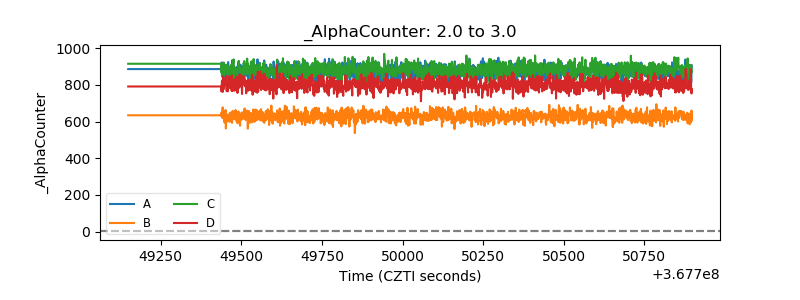 |
| _CPM_Rate | 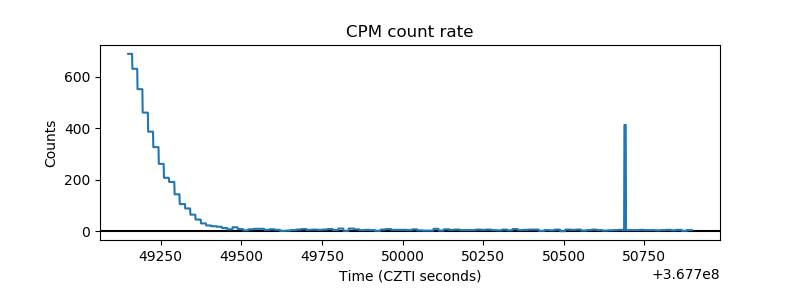 |
| CZT Counter | 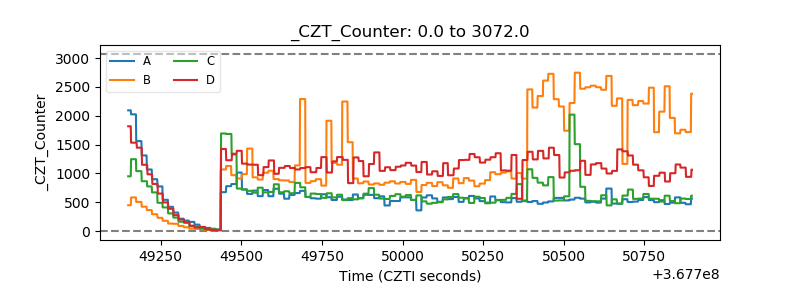 |
| +2.5 Volts monitor |  |
| +5 Volts monitor | 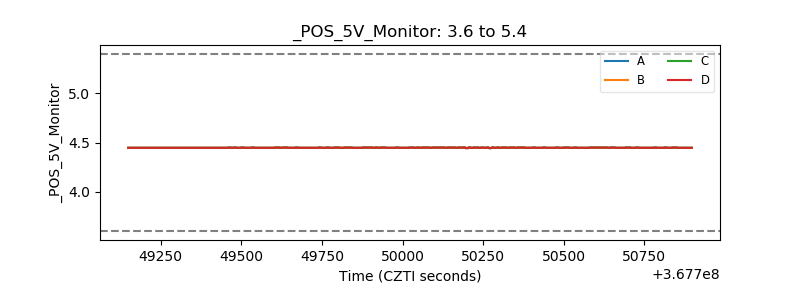 |
| _ROLL_ROT | 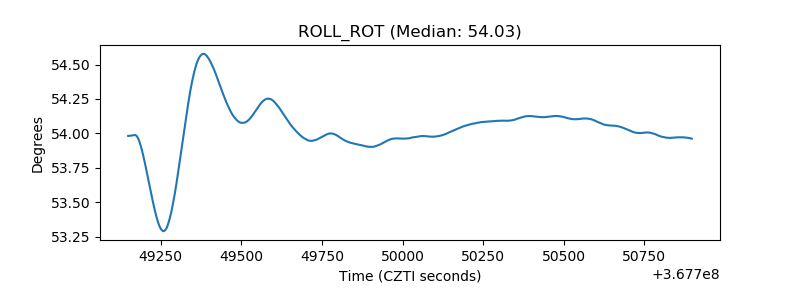 |
| _Roll_DEC | 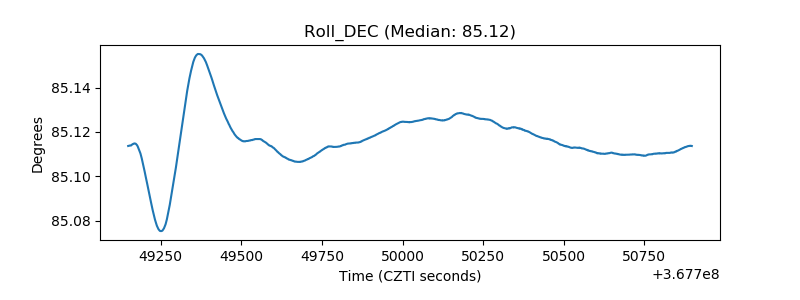 |
| _Roll_RA | 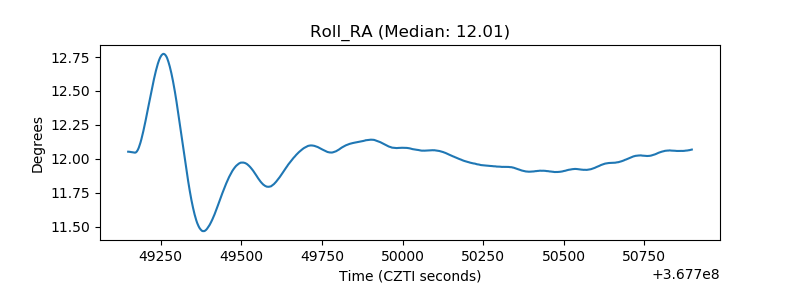 |
| Veto Counter | 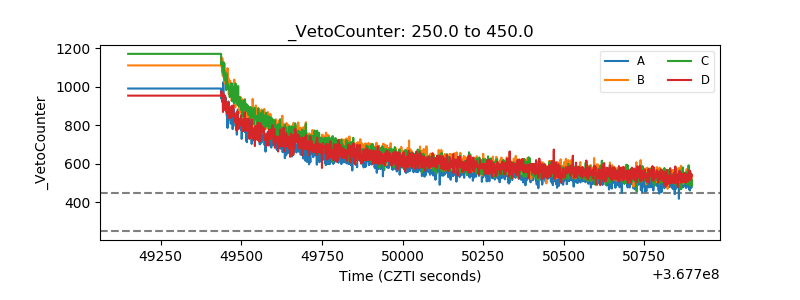 |