| Param | Original file | Final file |
|---|---|---|
| Filename | modeM0/AS1C06_010T03_9000004672_31976cztM0_level2.evt | modeM0/AS1C06_010T03_9000004672_31976cztM0_level2_quad_clean.evt |
| Size (bytes) | 621,120,960 | 121,705,920 |
| Size | 592.3 MB | 116.1 MB |
| Events in quadrant A | 2,857,381 | 879,229 |
| Events in quadrant B | 5,533,065 | 828,139 |
| Events in quadrant C | 4,045,103 | 799,238 |
| Events in quadrant D | 5,999,823 | 790,135 |
| Mode M0 | |||
|---|---|---|---|
| Quadrant | BADHDUFLAG | Total packets | Discarded packets |
| A | 0 | 11548 | 1 |
| B | 0 | 20359 | 1 |
| C | 0 | 15247 | 1 |
| D | 0 | 21810 | 1 |
| Mode SS | |||
|---|---|---|---|
| Quadrant | BADHDUFLAG | Total packets | Discarded packets |
| A | 0 | 112 | 0 |
| B | 0 | 112 | 0 |
| C | 0 | 112 | 0 |
| D | 0 | 112 | 0 |
| Mode M9 | |||
|---|---|---|---|
| Quadrant | BADHDUFLAG | Total packets | Discarded packets |
| A | 0 | 13 | 0 |
| B | 0 | 13 | 0 |
| C | 0 | 13 | 0 |
| D | 0 | 13 | 0 |
| Quadrant | Total seconds | Saturated seconds | Saturation percentage |
|---|---|---|---|
| A | 5564 | 65 | 1.168224% |
| B | 5565 | 671 | 12.057502% |
| C | 5565 | 455 | 8.176101% |
| D | 5565 | 327 | 5.876011% |
Noise dominated data is calculated using 1-second bins in cleaned event files. If a bin has >2000 counts, and if more than 50% of those come from <1% of pixels, then it is considered to be noise-dominated and hence unusable.
| Quadrant | # 1 sec bins | Bins with >0 counts | Bins with >2000 counts | High rate bins dominated by noise | Noise dominated (total time) | Noise dominated (detector-on time) | Marked lightcurve |
|---|---|---|---|---|---|---|---|
| A | 6884 | 5564 | 0 | 0 | 0.00% | 0.00% | 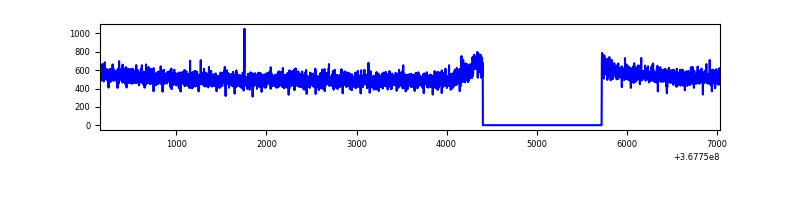 |
| B | 6885 | 5565 | 462 | 462 | 6.71% | 8.30% | 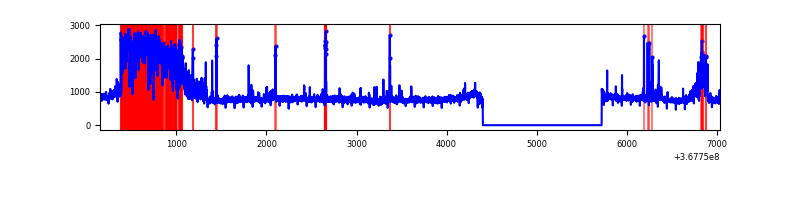 |
| C | 6885 | 5565 | 276 | 276 | 4.01% | 4.96% | 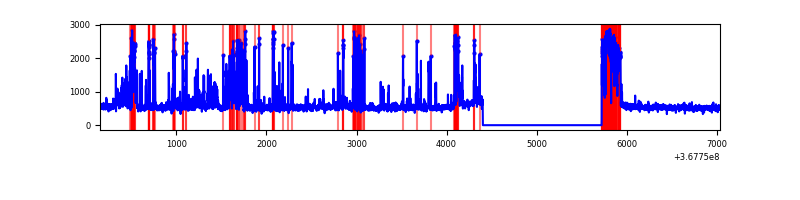 |
| D | 6885 | 5565 | 241 | 241 | 3.50% | 4.33% | 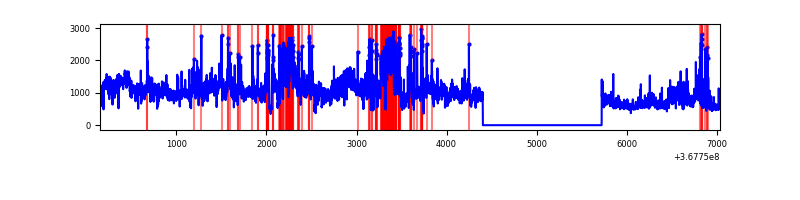 |
Top three noisy pixels from each quadrant. If the there are fewer than three noisy pixels in the level2.evt file, extra rows are filled as -1
| Pixel properties | Quadrant properties | ||||||
|---|---|---|---|---|---|---|---|
| Quadrant | DetID | PixID | Counts | Sigma | Mean | Median | Sigma |
| A | 13 | 254 | 10241 | 65.38 | 740 | 728 | 145.5 |
| A | 3 | 137 | 6637 | 40.61 | 740 | 728 | 145.5 |
| A | 0 | 226 | 6386 | 38.89 | 740 | 728 | 145.5 |
| B | 6 | 159 | 1404318 | 11136.24 | 695 | 681 | 126.0 |
| B | 10 | 245 | 1090468 | 8646.2 | 695 | 681 | 126.0 |
| B | 0 | 190 | 129136 | 1019.14 | 695 | 681 | 126.0 |
| C | 0 | 10 | 1180147 | 7569.67 | 678 | 684 | 155.8 |
| C | 14 | 238 | 112898 | 720.18 | 678 | 684 | 155.8 |
| C | 3 | 233 | 81099 | 516.09 | 678 | 684 | 155.8 |
| D | 11 | 164 | 2285554 | 14026.94 | 700 | 683 | 162.9 |
| D | 7 | 238 | 292575 | 1791.94 | 700 | 683 | 162.9 |
| D | 12 | 218 | 191062 | 1168.75 | 700 | 683 | 162.9 |
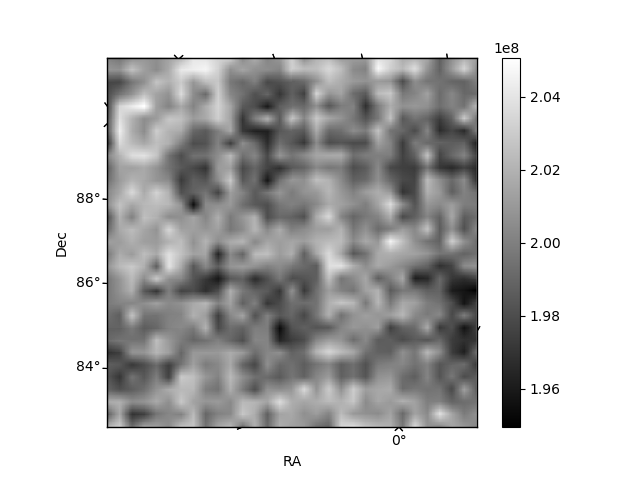
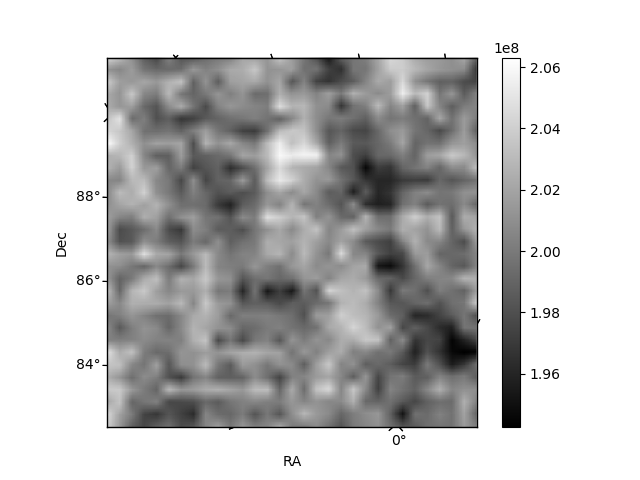
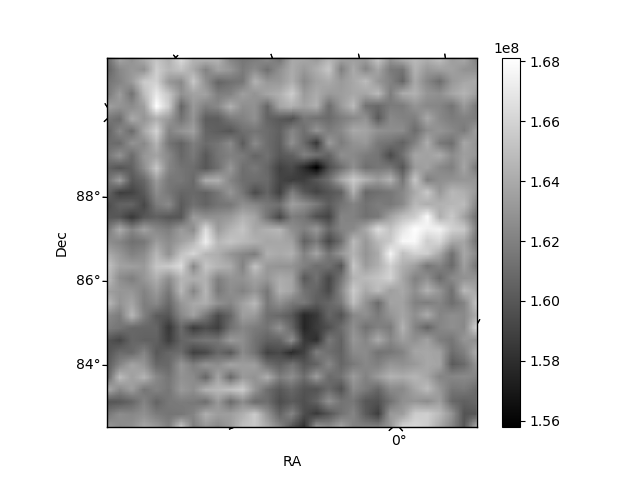
Histogram calculated using DETX and DETY for each event in the final _common_clean file
| Quadrant A | 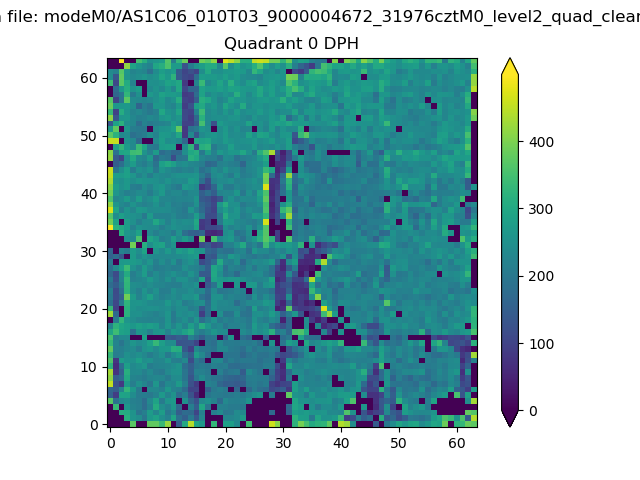 |
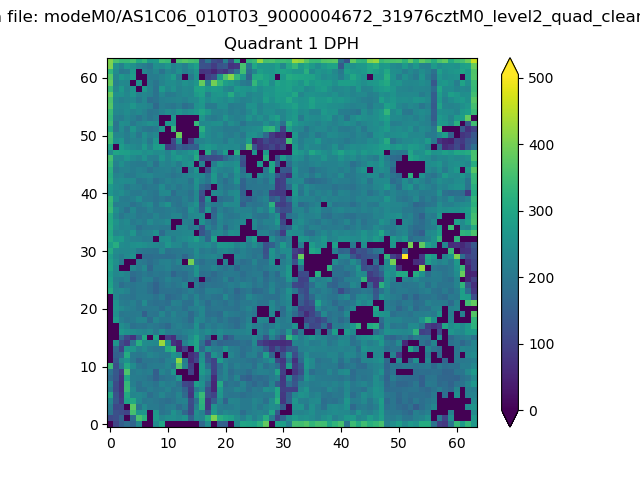 |
Quadrant B |
|---|---|---|---|
| Quadrant D | 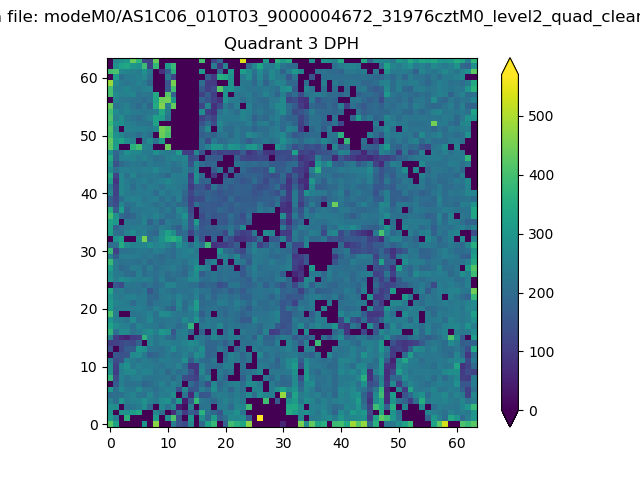 |
 |
Quadrant C |
| Plot type | Count rate plots | Images |
|---|---|---|
| Comparison with Poisson distribution Blue bars denote a histogram of data divided into 1 sec bins. Red curve is a Poisson curve with rate = median count rate of data. |
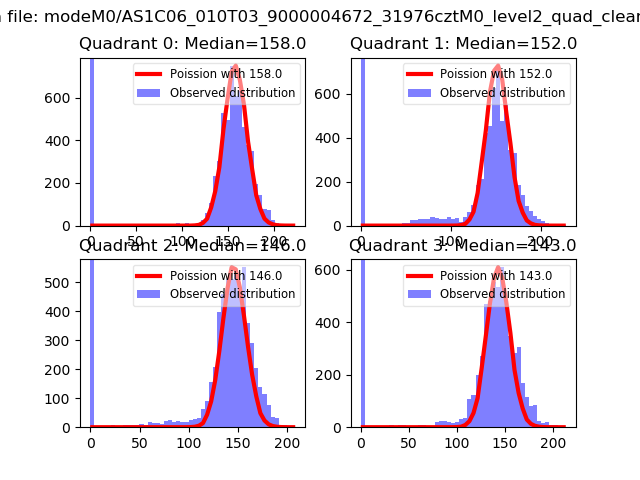 |
 |
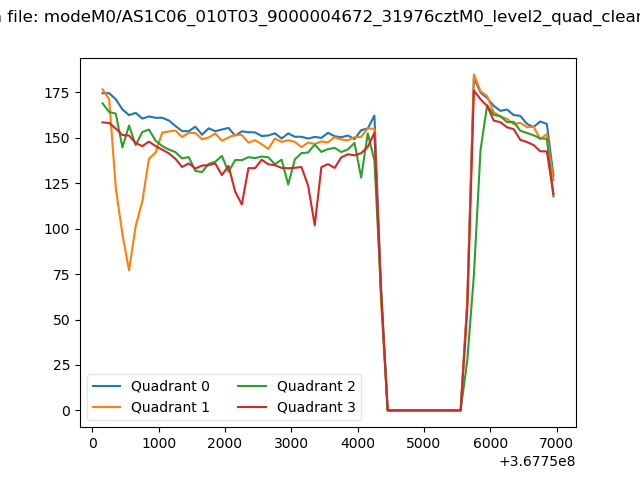
| Quadrant-wise count rates Data is divided into 100 sec bins |
 |
|
| Module-wise count rates for Quadrant A Data is divided into 100 sec bins |
 |
 |
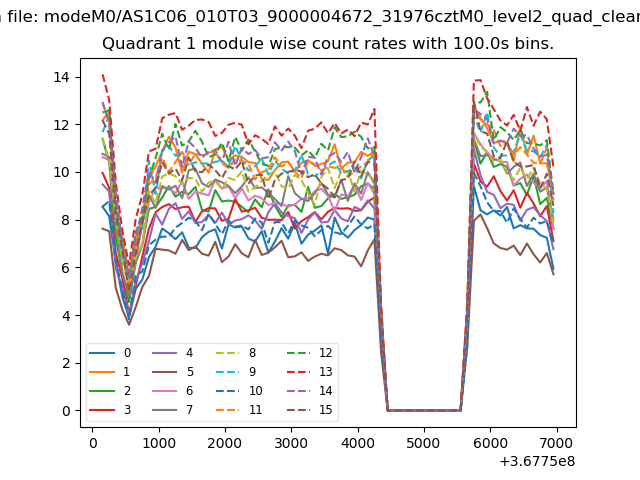
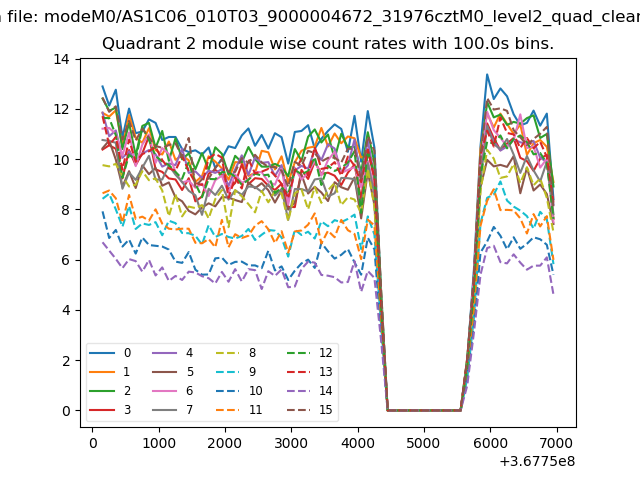
| Module-wise count rates for Quadrant B Data is divided into 100 sec bins |
 |
 |
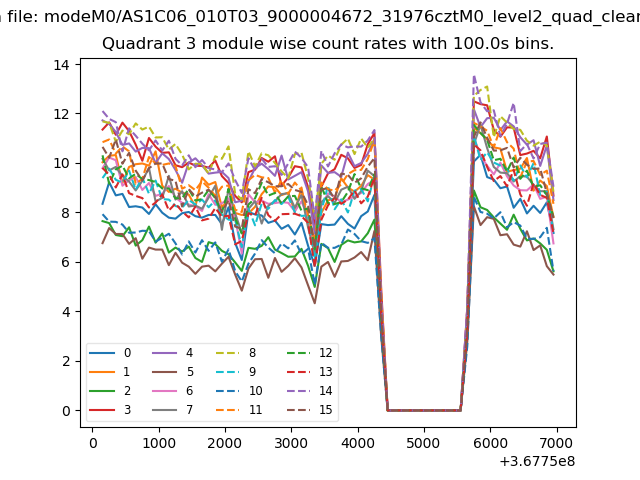
| Module-wise count rates for Quadrant C Data is divided into 100 sec bins |
 |
 |
| Module-wise count rates for Quadrant D Data is divided into 100 sec bins |
 |
 |
| Parameter | Plot |
|---|---|
| CZT HV Monitor | 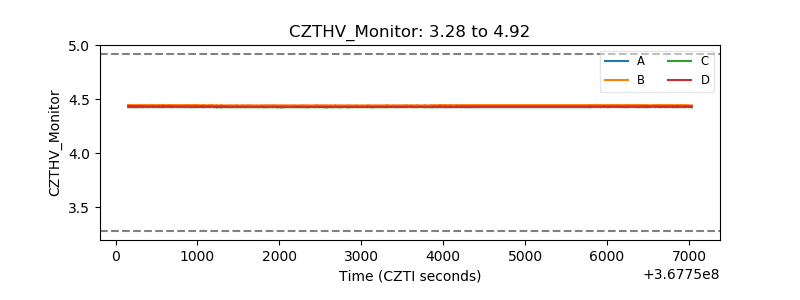 |
| D_VDD | 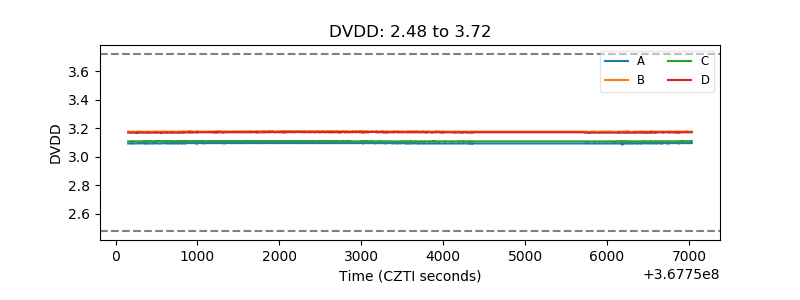 |
| Temperature 1 | 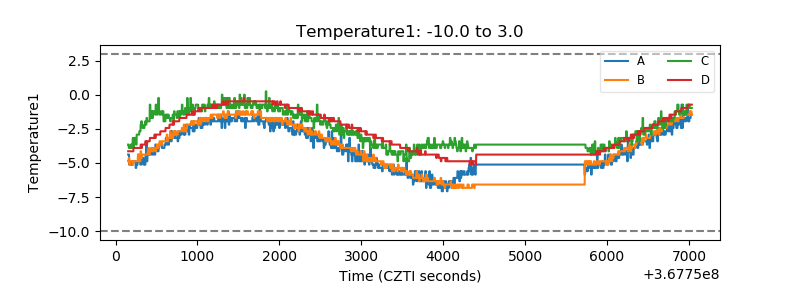 |
| Veto HV Monitor |  |
| Veto LLD | 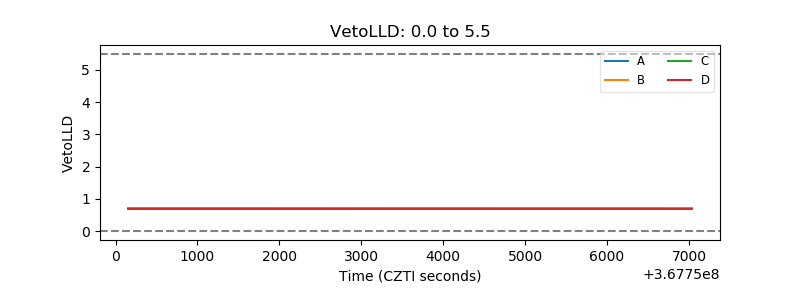 |
| Alpha Counter | 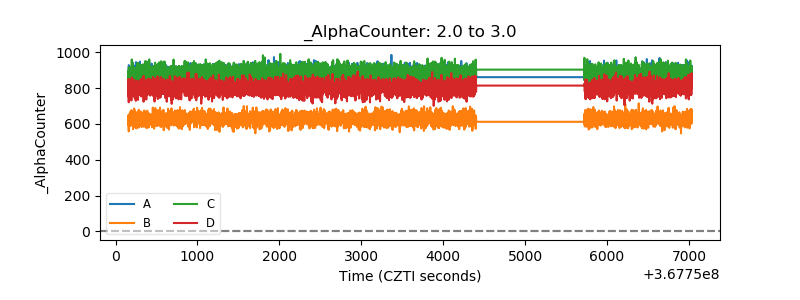 |
| _CPM_Rate | 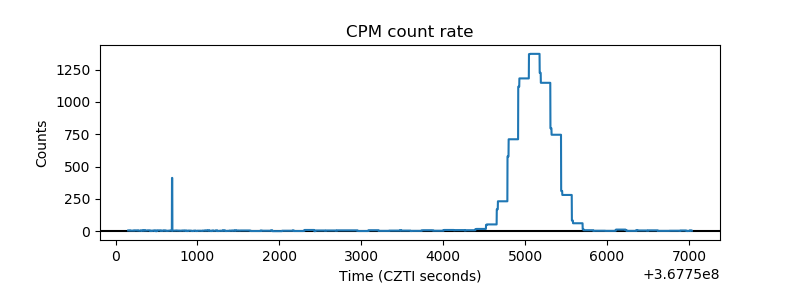 |
| CZT Counter |  |
| +2.5 Volts monitor |  |
| +5 Volts monitor |  |
| _ROLL_ROT | 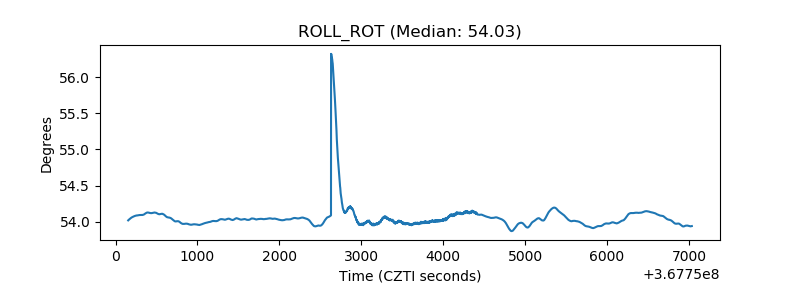 |
| _Roll_DEC | 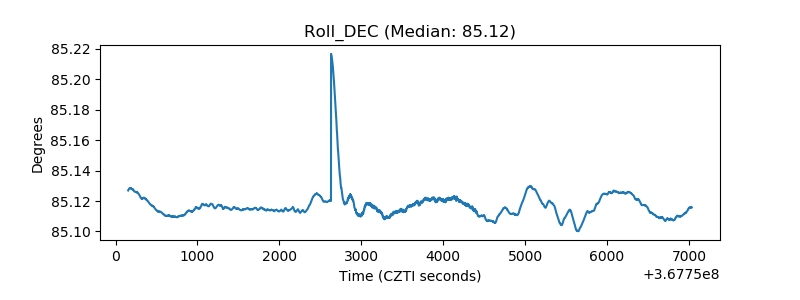 |
| _Roll_RA |  |
| Veto Counter | 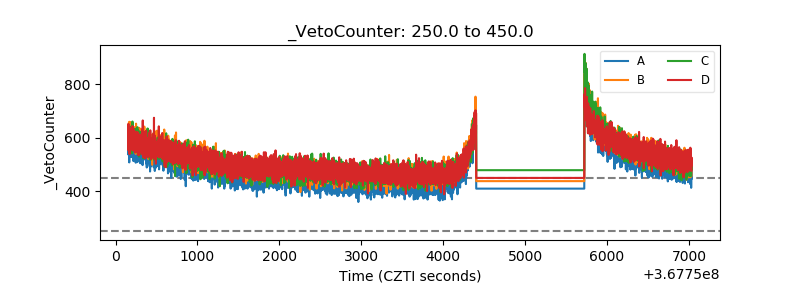 |