| Param | Original file | Final file |
|---|---|---|
| Filename | modeM0/AS1C06_010T03_9000004672_31977cztM0_level2.evt | modeM0/AS1C06_010T03_9000004672_31977cztM0_level2_quad_clean.evt |
| Size (bytes) | 604,140,480 | 135,679,680 |
| Size | 576.2 MB | 129.4 MB |
| Events in quadrant A | 3,186,213 | 959,916 |
| Events in quadrant B | 5,322,162 | 941,002 |
| Events in quadrant C | 4,028,316 | 885,249 |
| Events in quadrant D | 5,329,630 | 879,261 |
| Mode M0 | |||
|---|---|---|---|
| Quadrant | BADHDUFLAG | Total packets | Discarded packets |
| A | 0 | 13158 | 1 |
| B | 0 | 20335 | 1 |
| C | 0 | 15633 | 1 |
| D | 0 | 20193 | 1 |
| Mode SS | |||
|---|---|---|---|
| Quadrant | BADHDUFLAG | Total packets | Discarded packets |
| A | 0 | 128 | 0 |
| B | 0 | 128 | 0 |
| C | 0 | 128 | 0 |
| D | 0 | 128 | 0 |
| Mode M9 | |||
|---|---|---|---|
| Quadrant | BADHDUFLAG | Total packets | Discarded packets |
| A | 0 | 12 | 0 |
| B | 0 | 12 | 0 |
| C | 0 | 12 | 0 |
| D | 0 | 12 | 0 |
| Quadrant | Total seconds | Saturated seconds | Saturation percentage |
|---|---|---|---|
| A | 6365 | 82 | 1.288295% |
| B | 6365 | 237 | 3.723488% |
| C | 6365 | 410 | 6.441477% |
| D | 6366 | 357 | 5.607917% |
Noise dominated data is calculated using 1-second bins in cleaned event files. If a bin has >2000 counts, and if more than 50% of those come from <1% of pixels, then it is considered to be noise-dominated and hence unusable.
| Quadrant | # 1 sec bins | Bins with >0 counts | Bins with >2000 counts | High rate bins dominated by noise | Noise dominated (total time) | Noise dominated (detector-on time) | Marked lightcurve |
|---|---|---|---|---|---|---|---|
| A | 7555 | 6365 | 0 | 0 | 0.00% | 0.00% |  |
| B | 7555 | 6365 | 67 | 67 | 0.89% | 1.05% | 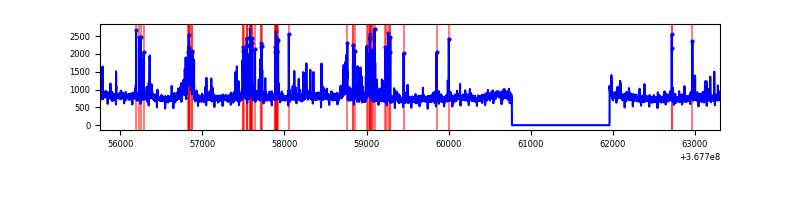 |
| C | 7555 | 6365 | 255 | 255 | 3.38% | 4.01% | 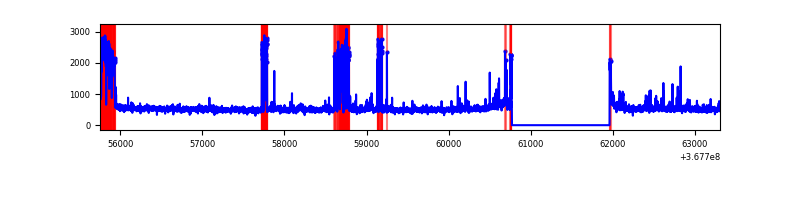 |
| D | 7556 | 6366 | 298 | 298 | 3.94% | 4.68% | 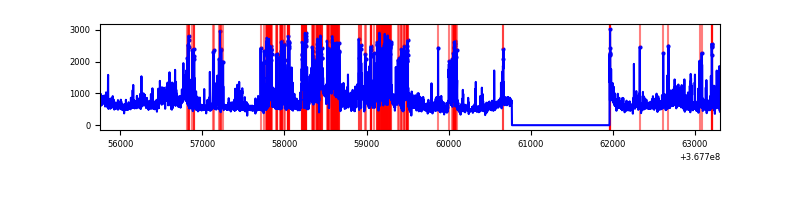 |
Top three noisy pixels from each quadrant. If the there are fewer than three noisy pixels in the level2.evt file, extra rows are filled as -1
| Pixel properties | Quadrant properties | ||||||
|---|---|---|---|---|---|---|---|
| Quadrant | DetID | PixID | Counts | Sigma | Mean | Median | Sigma |
| A | 13 | 254 | 11545 | 65.95 | 823 | 809 | 162.8 |
| A | 3 | 137 | 7495 | 41.07 | 823 | 809 | 162.8 |
| A | 0 | 226 | 7137 | 38.87 | 823 | 809 | 162.8 |
| B | 6 | 159 | 1642497 | 11108.84 | 798 | 781 | 147.8 |
| B | 10 | 245 | 153681 | 1034.61 | 798 | 781 | 147.8 |
| B | 5 | 172 | 113767 | 764.53 | 798 | 781 | 147.8 |
| C | 0 | 10 | 823111 | 4725.28 | 760 | 764 | 174.0 |
| C | 14 | 238 | 129881 | 741.92 | 760 | 764 | 174.0 |
| C | 3 | 233 | 69540 | 395.19 | 760 | 764 | 174.0 |
| D | 11 | 164 | 673392 | 3684.76 | 781 | 764 | 182.5 |
| D | 13 | 249 | 474514 | 2595.28 | 781 | 764 | 182.5 |
| D | 8 | 195 | 283434 | 1548.51 | 781 | 764 | 182.5 |
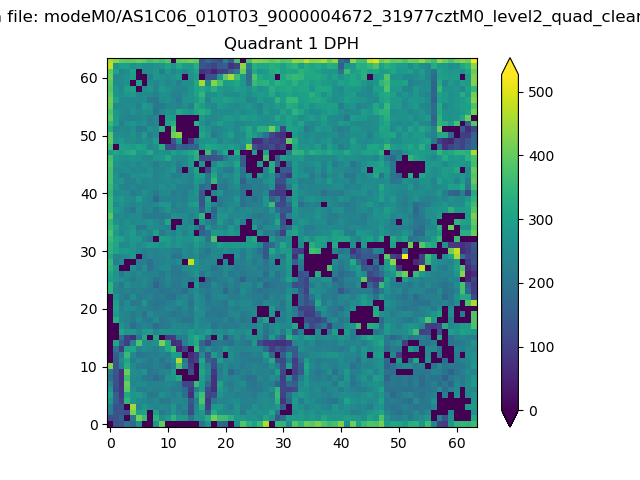
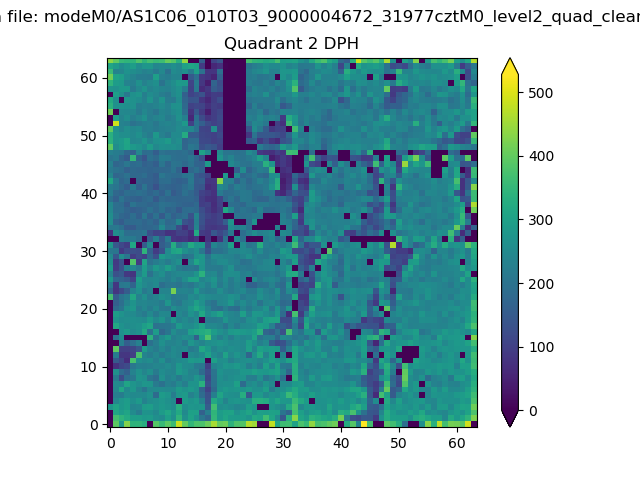
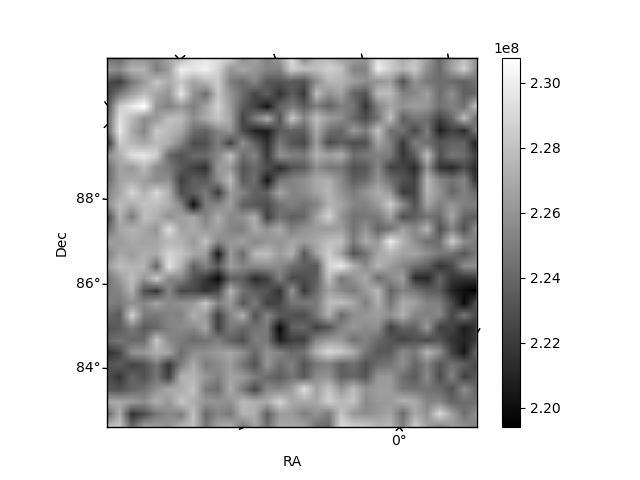
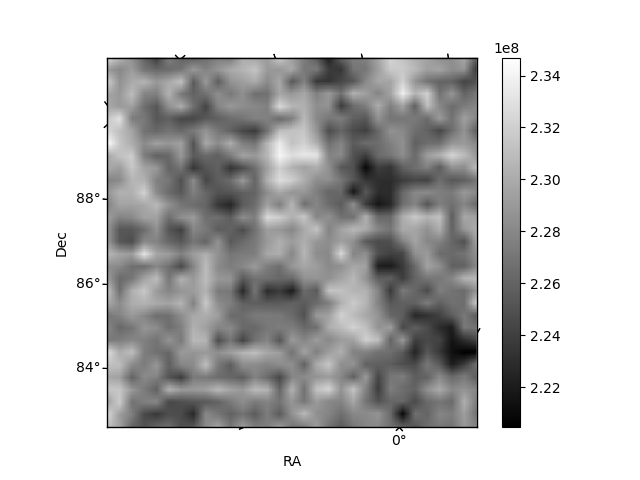
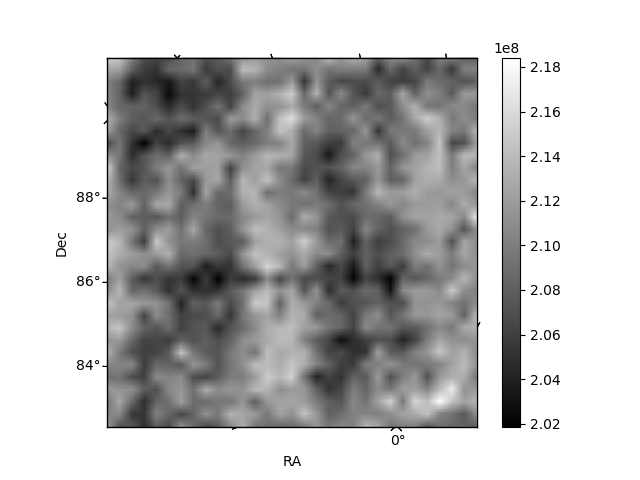
Histogram calculated using DETX and DETY for each event in the final _common_clean file
| Quadrant A |  |
 |
Quadrant B |
|---|---|---|---|
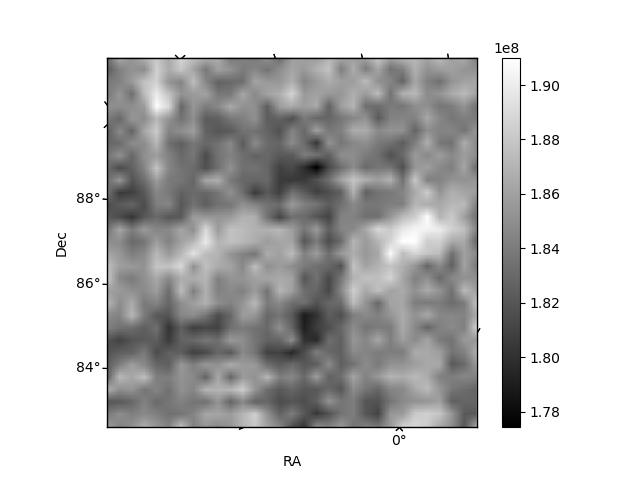
| Quadrant D | 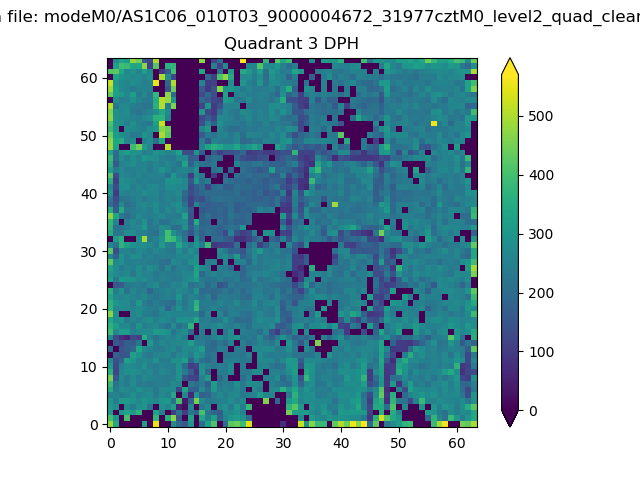 |
 |
Quadrant C |
| Plot type | Count rate plots | Images |
|---|---|---|
| Comparison with Poisson distribution Blue bars denote a histogram of data divided into 1 sec bins. Red curve is a Poisson curve with rate = median count rate of data. |
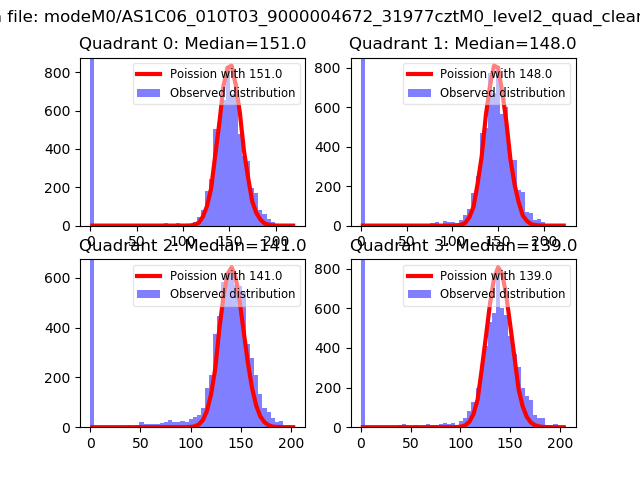 |
 |
| Quadrant-wise count rates Data is divided into 100 sec bins |
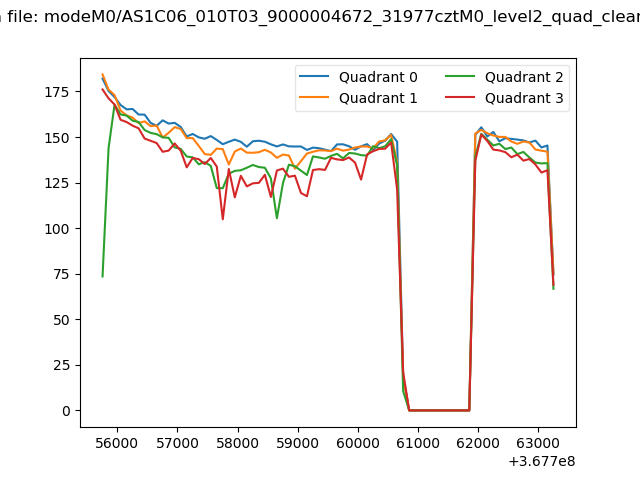 |
|
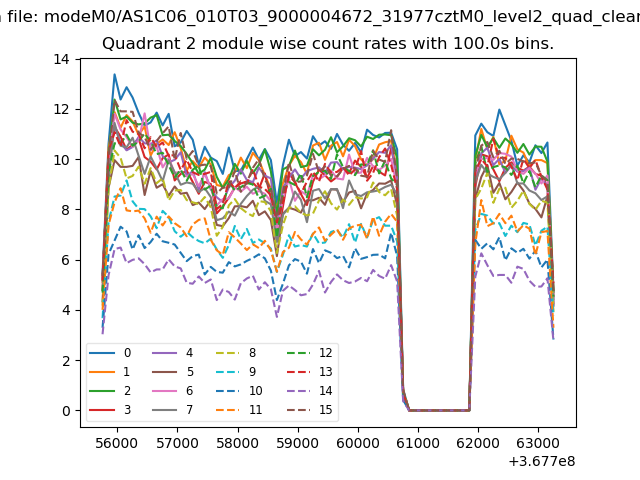
| Module-wise count rates for Quadrant A Data is divided into 100 sec bins |
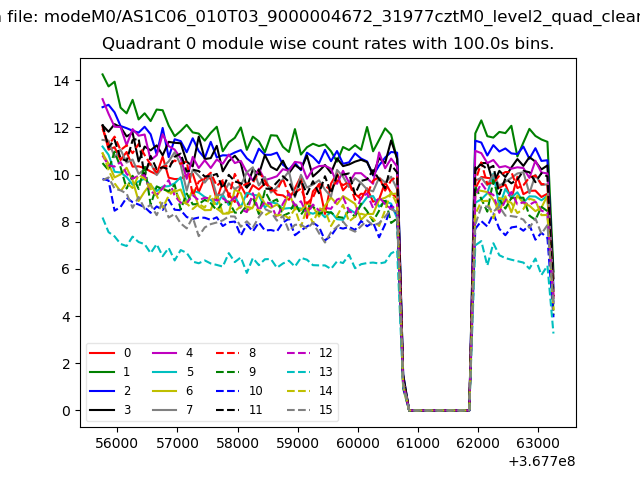 |
 |
| Module-wise count rates for Quadrant B Data is divided into 100 sec bins |
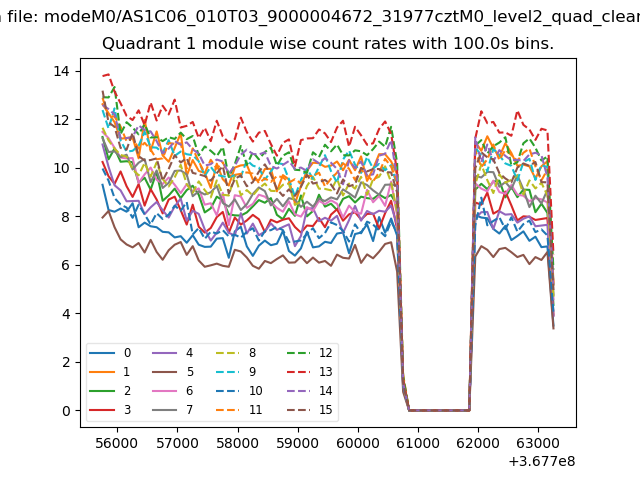 |
 |
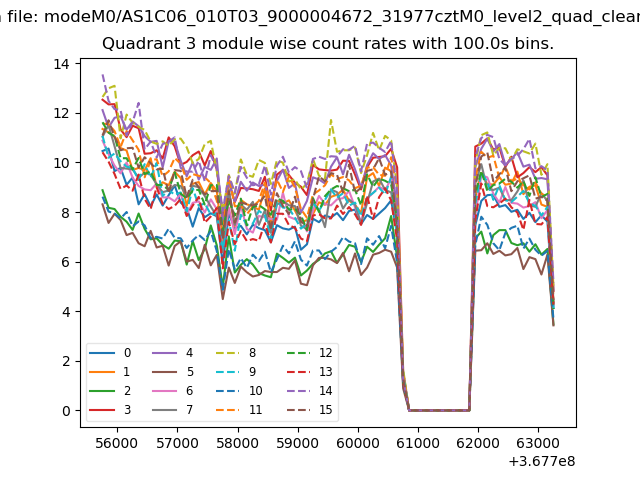
| Module-wise count rates for Quadrant C Data is divided into 100 sec bins |
 |
 |
| Module-wise count rates for Quadrant D Data is divided into 100 sec bins |
 |
 |
| Parameter | Plot |
|---|---|
| CZT HV Monitor | 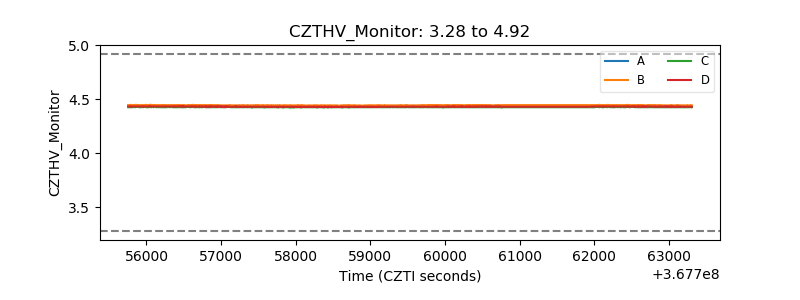 |
| D_VDD | 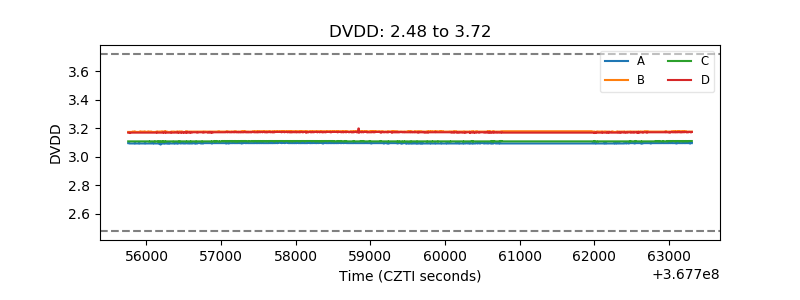 |
| Temperature 1 | 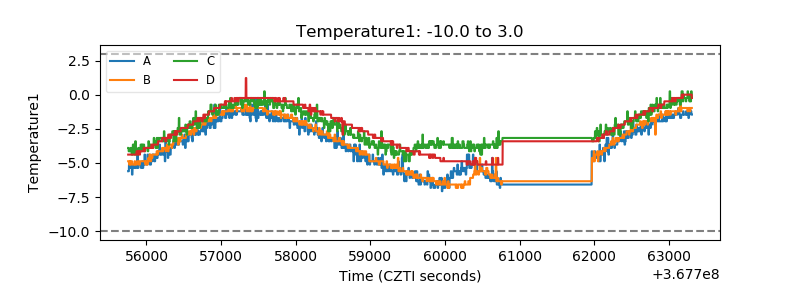 |
| Veto HV Monitor | 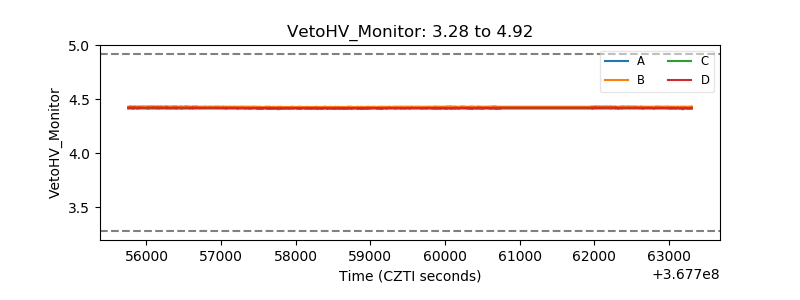 |
| Veto LLD | 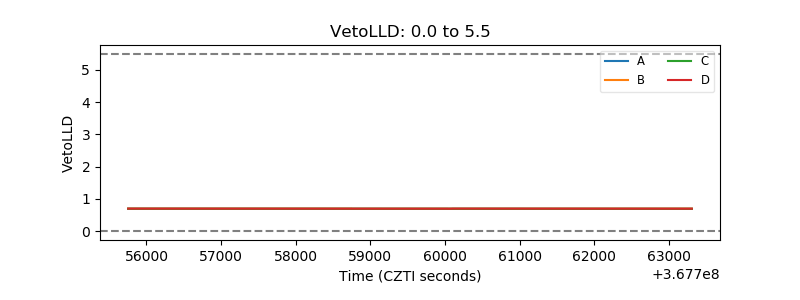 |
| Alpha Counter | 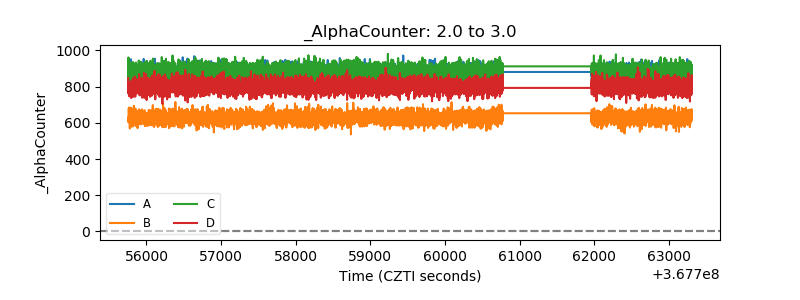 |
| _CPM_Rate | 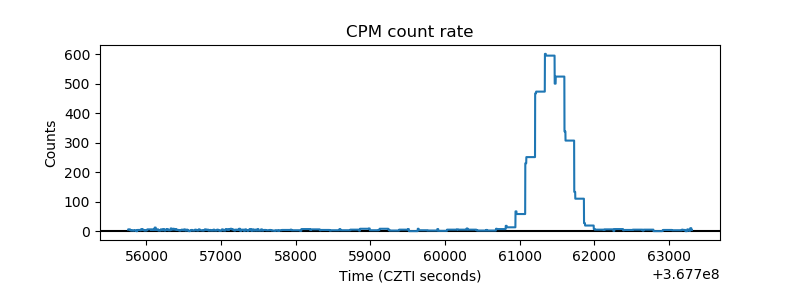 |
| CZT Counter | 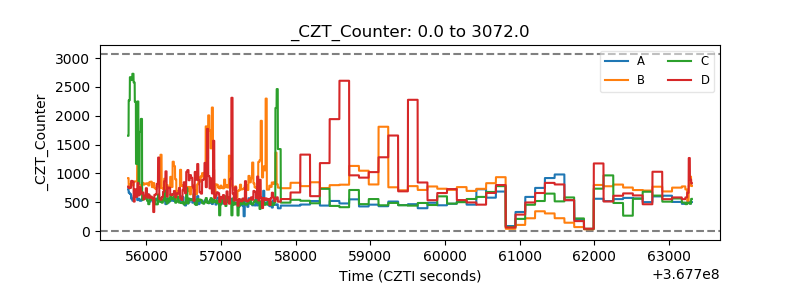 |
| +2.5 Volts monitor |  |
| +5 Volts monitor |  |
| _ROLL_ROT | 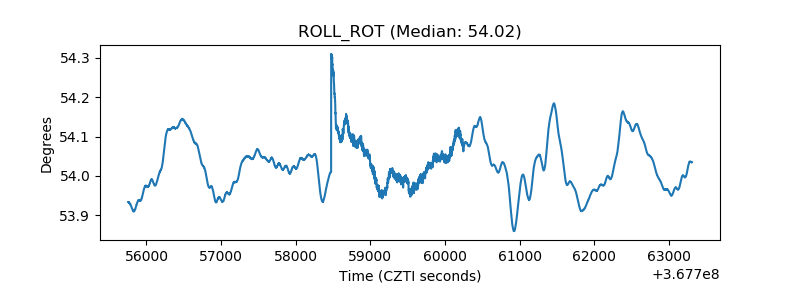 |
| _Roll_DEC | 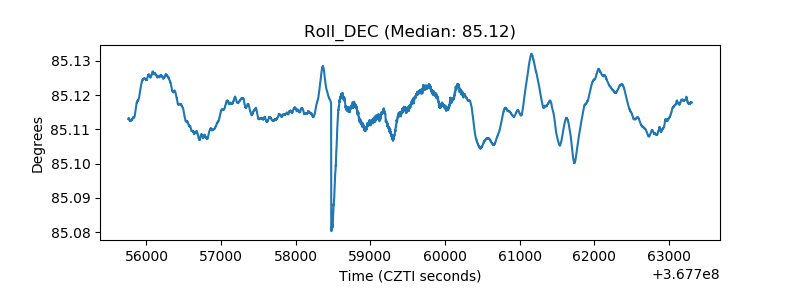 |
| _Roll_RA | 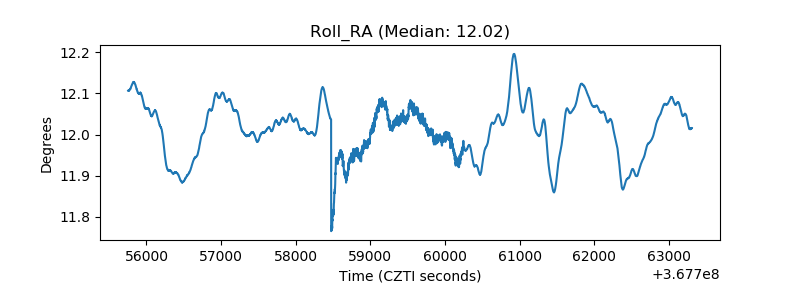 |
| Veto Counter | 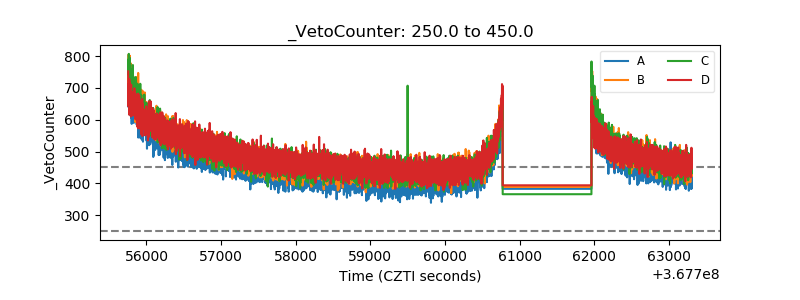 |