| Param | Original file | Final file |
|---|---|---|
| Filename | modeM0/AS1C06_010T03_9000004672_31978cztM0_level2.evt | modeM0/AS1C06_010T03_9000004672_31978cztM0_level2_quad_clean.evt |
| Size (bytes) | 1,046,001,600 | 232,464,960 |
| Size | 997.5 MB | 221.7 MB |
| Events in quadrant A | 5,510,468 | 1,636,310 |
| Events in quadrant B | 9,594,485 | 1,599,562 |
| Events in quadrant C | 6,438,848 | 1,531,951 |
| Events in quadrant D | 9,365,982 | 1,484,526 |
| Mode M0 | |||
|---|---|---|---|
| Quadrant | BADHDUFLAG | Total packets | Discarded packets |
| A | 0 | 23338 | 2 |
| B | 0 | 36816 | 2 |
| C | 0 | 25890 | 2 |
| D | 0 | 35456 | 2 |
| Mode SS | |||
|---|---|---|---|
| Quadrant | BADHDUFLAG | Total packets | Discarded packets |
| A | 0 | 230 | 0 |
| B | 0 | 230 | 0 |
| C | 0 | 230 | 0 |
| D | 0 | 230 | 0 |
| Mode M9 | |||
|---|---|---|---|
| Quadrant | BADHDUFLAG | Total packets | Discarded packets |
| A | 0 | 21 | 0 |
| B | 0 | 21 | 0 |
| C | 0 | 21 | 0 |
| D | 0 | 21 | 0 |
| Quadrant | Total seconds | Saturated seconds | Saturation percentage |
|---|---|---|---|
| A | 11403 | 181 | 1.587302% |
| B | 11403 | 505 | 4.428659% |
| C | 11403 | 452 | 3.963869% |
| D | 11403 | 835 | 7.322634% |
Noise dominated data is calculated using 1-second bins in cleaned event files. If a bin has >2000 counts, and if more than 50% of those come from <1% of pixels, then it is considered to be noise-dominated and hence unusable.
| Quadrant | # 1 sec bins | Bins with >0 counts | Bins with >2000 counts | High rate bins dominated by noise | Noise dominated (total time) | Noise dominated (detector-on time) | Marked lightcurve |
|---|---|---|---|---|---|---|---|
| A | 13433 | 11403 | 0 | 0 | 0.00% | 0.00% | 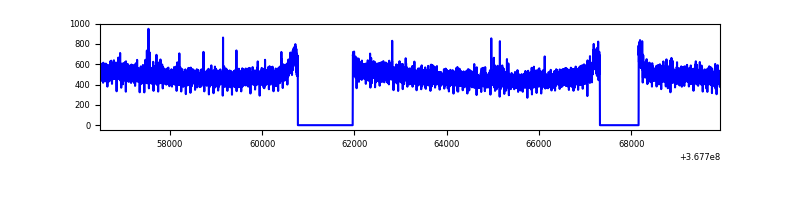 |
| B | 13433 | 11403 | 160 | 160 | 1.19% | 1.40% | 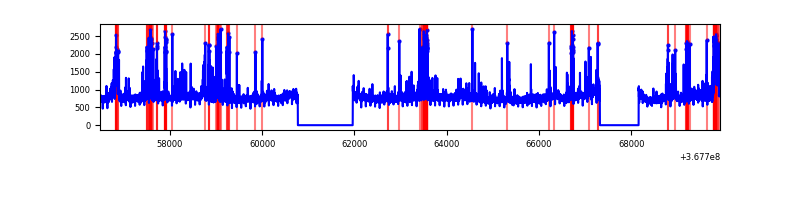 |
| C | 13433 | 11403 | 167 | 167 | 1.24% | 1.46% |  |
| D | 13433 | 11403 | 658 | 658 | 4.90% | 5.77% | 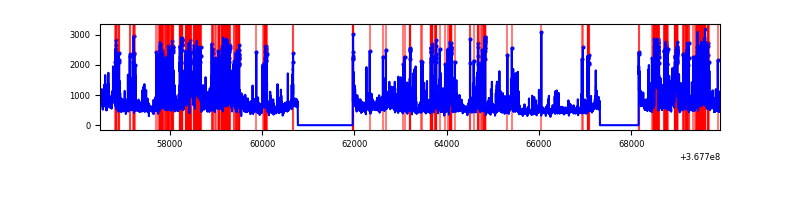 |
Top three noisy pixels from each quadrant. If the there are fewer than three noisy pixels in the level2.evt file, extra rows are filled as -1
| Pixel properties | Quadrant properties | ||||||
|---|---|---|---|---|---|---|---|
| Quadrant | DetID | PixID | Counts | Sigma | Mean | Median | Sigma |
| A | 13 | 254 | 21008 | 70.56 | 1421 | 1396 | 278.0 |
| A | 14 | 238 | 15821 | 51.89 | 1421 | 1396 | 278.0 |
| A | 3 | 137 | 13060 | 41.96 | 1421 | 1396 | 278.0 |
| B | 6 | 159 | 3043685 | 11923.73 | 1382 | 1350 | 255.1 |
| B | 10 | 245 | 428026 | 1672.26 | 1382 | 1350 | 255.1 |
| B | 5 | 172 | 292537 | 1141.24 | 1382 | 1350 | 255.1 |
| C | 0 | 10 | 793474 | 2561.43 | 1342 | 1347 | 309.3 |
| C | 14 | 238 | 238511 | 766.9 | 1342 | 1347 | 309.3 |
| C | 3 | 233 | 92278 | 294.04 | 1342 | 1347 | 309.3 |
| D | 12 | 218 | 881269 | 2796.78 | 1345 | 1316 | 314.6 |
| D | 13 | 249 | 864519 | 2743.54 | 1345 | 1316 | 314.6 |
| D | 11 | 164 | 660884 | 2096.32 | 1345 | 1316 | 314.6 |
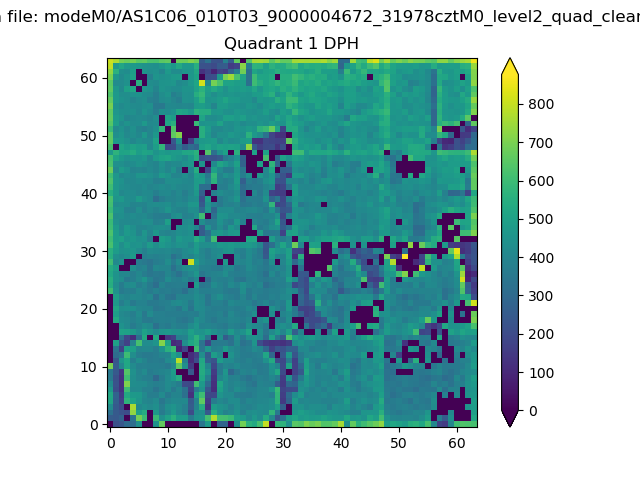
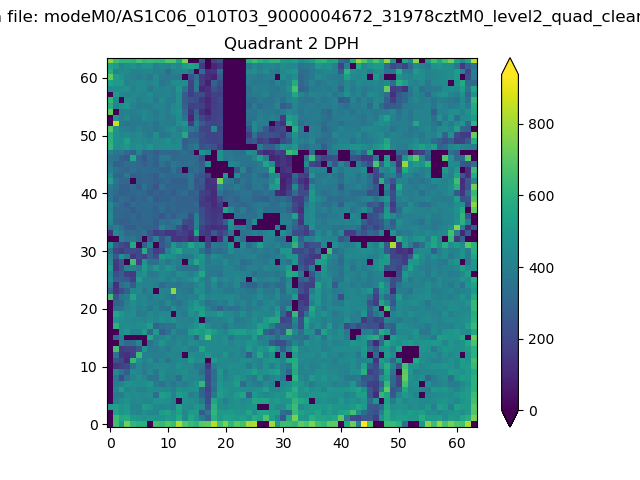
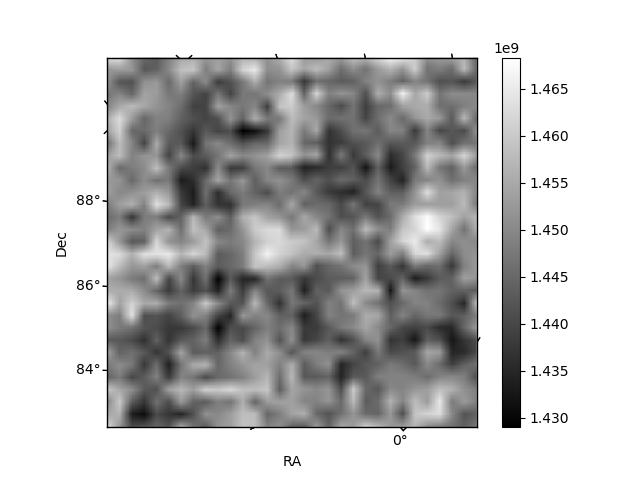
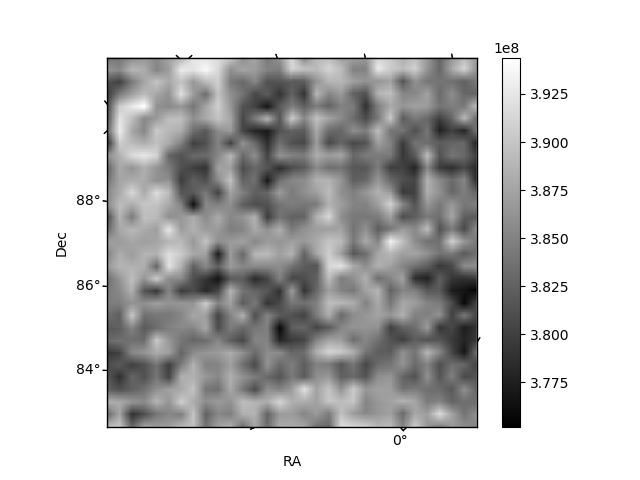
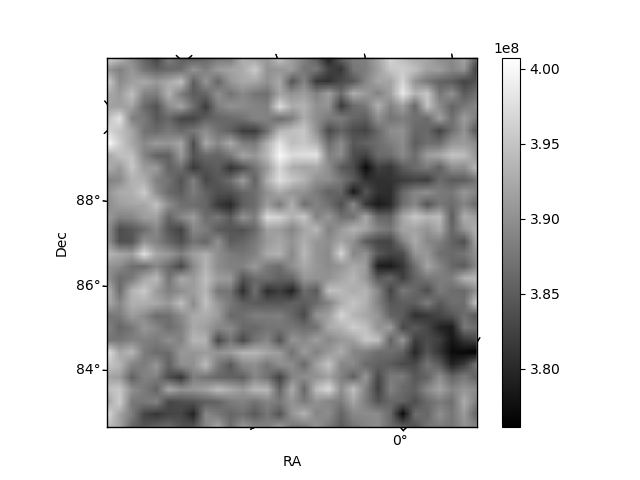
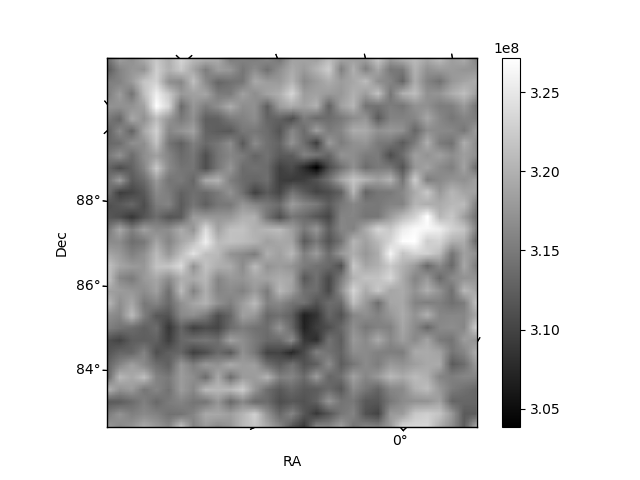
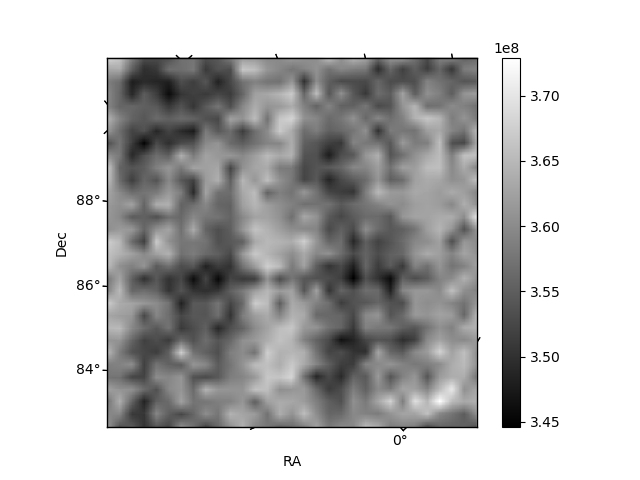
Histogram calculated using DETX and DETY for each event in the final _common_clean file
| Quadrant A | 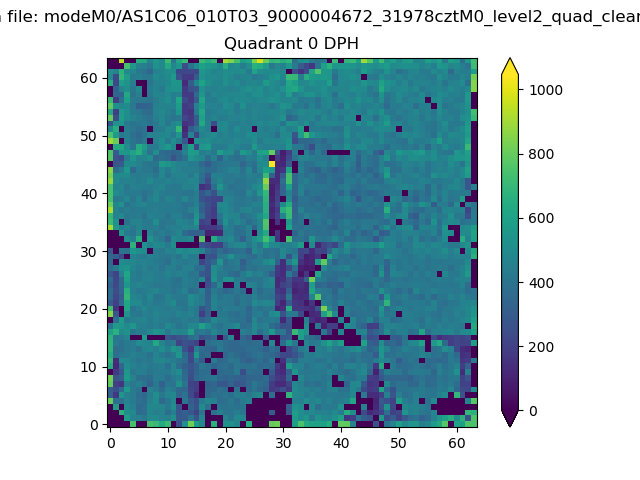 |
 |
Quadrant B |
|---|---|---|---|
| Quadrant D | 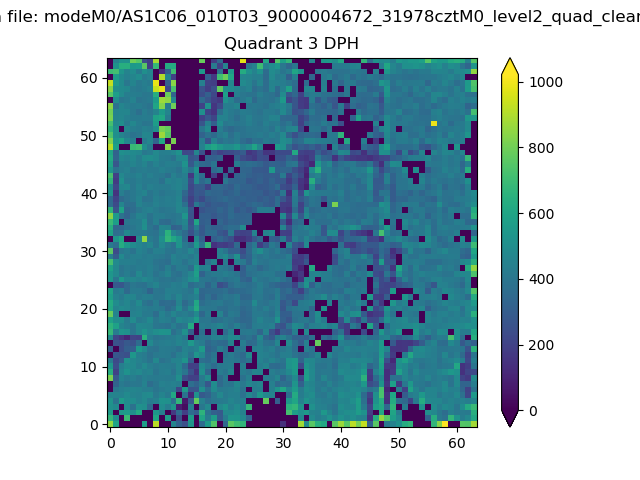 |
 |
Quadrant C |
| Plot type | Count rate plots | Images |
|---|---|---|
| Comparison with Poisson distribution Blue bars denote a histogram of data divided into 1 sec bins. Red curve is a Poisson curve with rate = median count rate of data. |
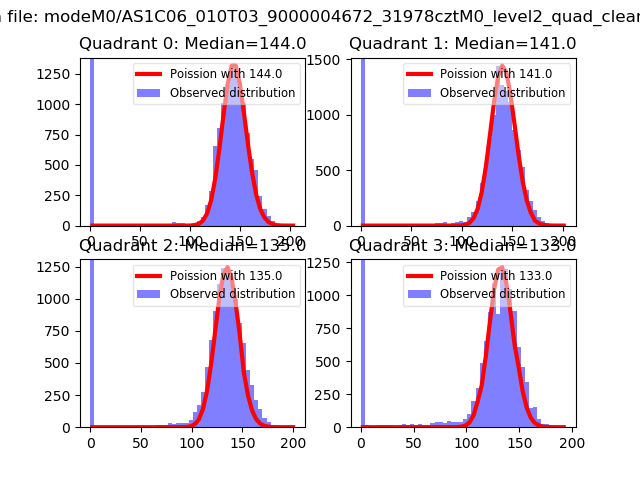 |
 |
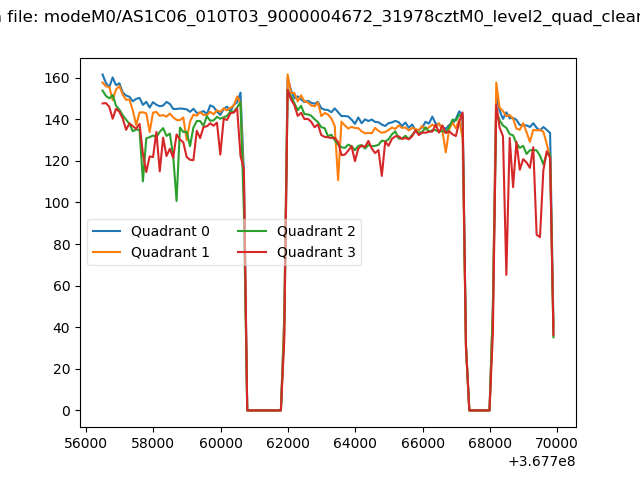
| Quadrant-wise count rates Data is divided into 100 sec bins |
 |
|
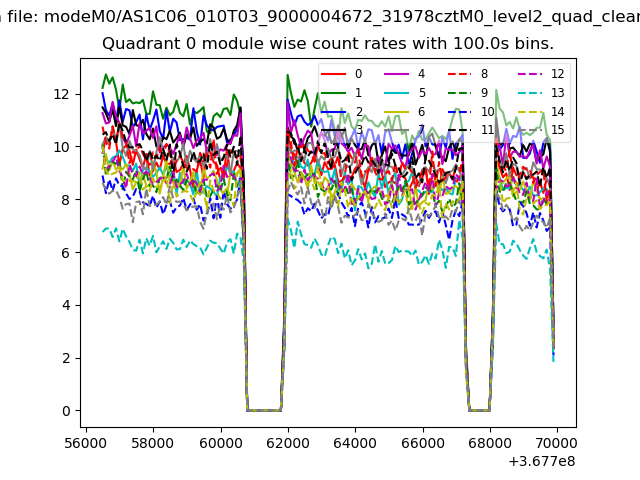
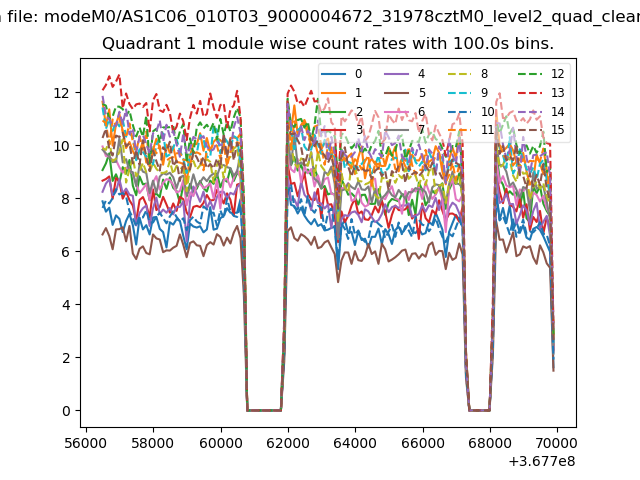
| Module-wise count rates for Quadrant A Data is divided into 100 sec bins |
 |
 |
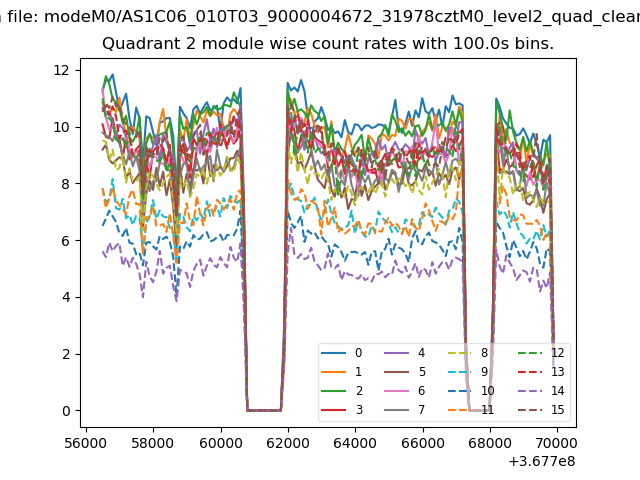
| Module-wise count rates for Quadrant B Data is divided into 100 sec bins |
 |
 |
| Module-wise count rates for Quadrant C Data is divided into 100 sec bins |
 |
 |
| Module-wise count rates for Quadrant D Data is divided into 100 sec bins |
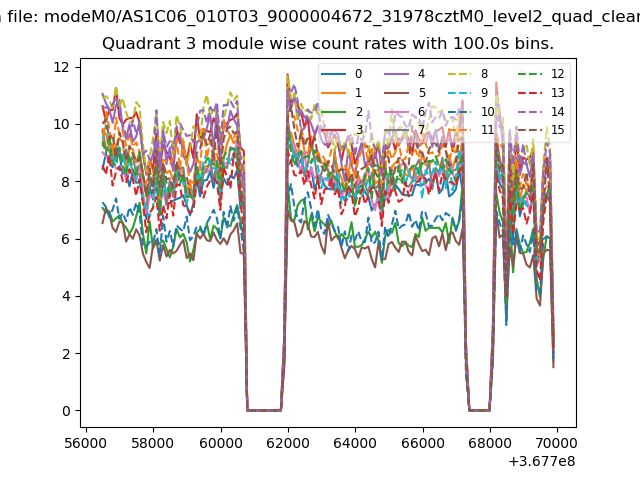 |
 |
| Parameter | Plot |
|---|---|
| CZT HV Monitor | 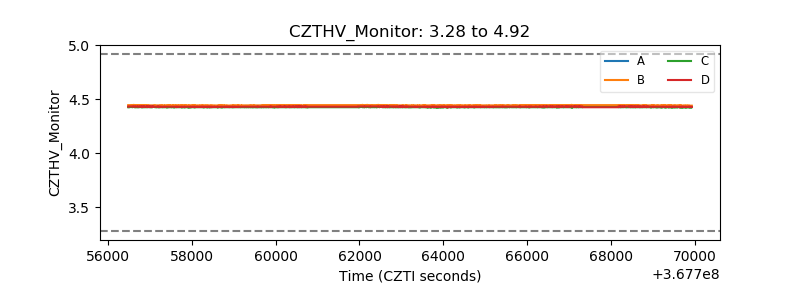 |
| D_VDD |  |
| Temperature 1 | 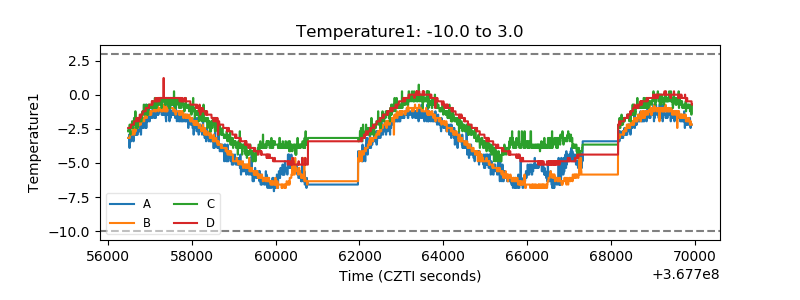 |
| Veto HV Monitor |  |
| Veto LLD | 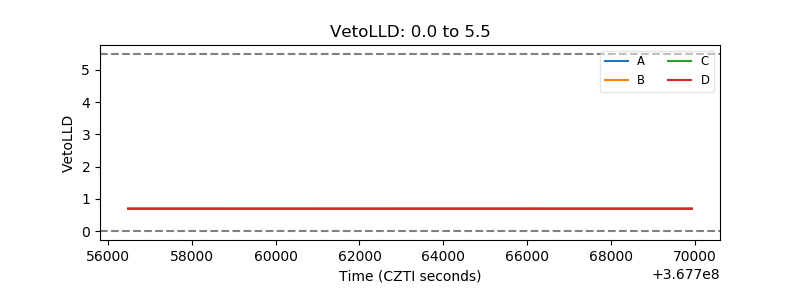 |
| Alpha Counter | 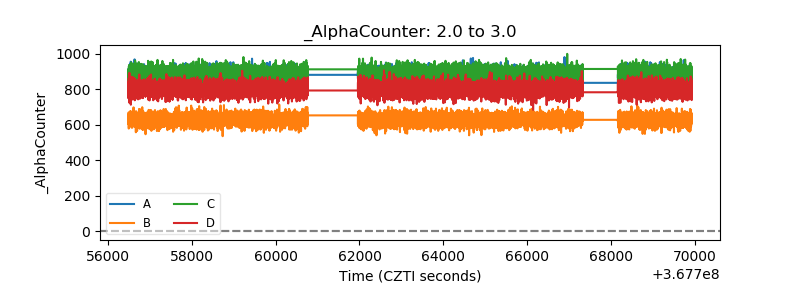 |
| _CPM_Rate | 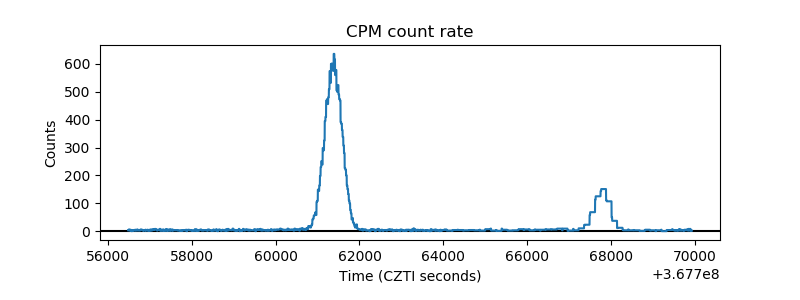 |
| CZT Counter |  |
| +2.5 Volts monitor |  |
| +5 Volts monitor |  |
| _ROLL_ROT | 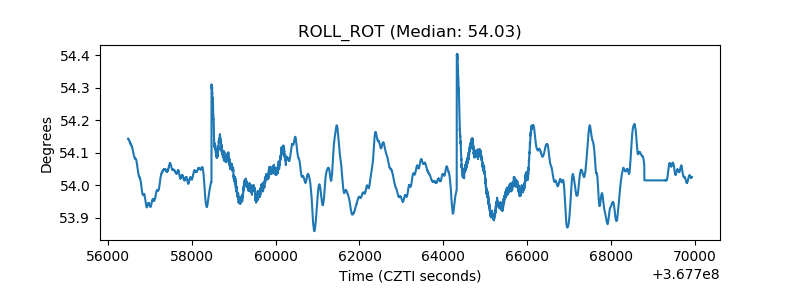 |
| _Roll_DEC | 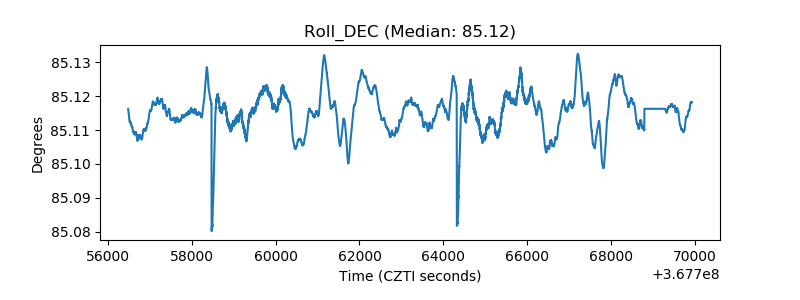 |
| _Roll_RA | 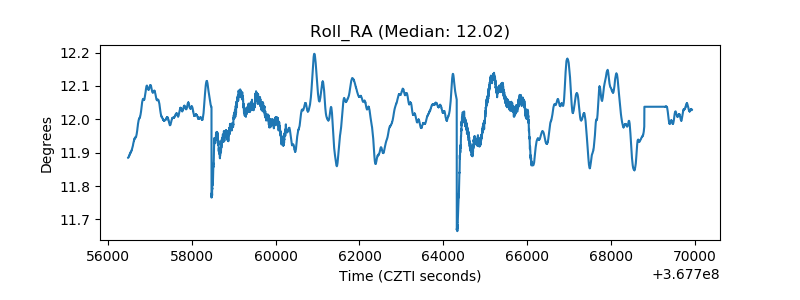 |
| Veto Counter | 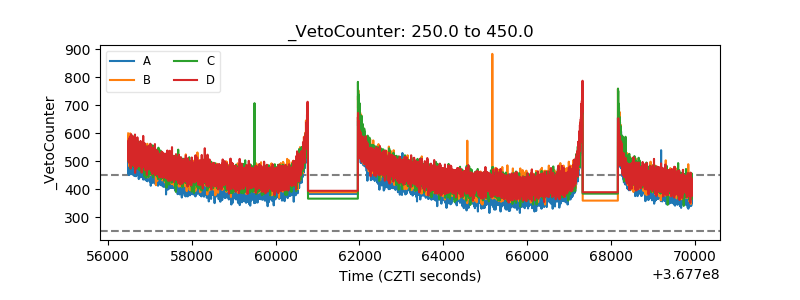 |