| Param | Original file | Final file |
|---|---|---|
| Filename | modeM0/AS1C06_010T03_9000004672_31979cztM0_level2.evt | modeM0/AS1C06_010T03_9000004672_31979cztM0_level2_quad_clean.evt |
| Size (bytes) | 216,872,640 | 38,390,400 |
| Size | 206.8 MB | 36.6 MB |
| Events in quadrant A | 946,270 | 274,755 |
| Events in quadrant B | 2,582,930 | 248,751 |
| Events in quadrant C | 1,204,191 | 249,343 |
| Events in quadrant D | 1,693,424 | 240,197 |
| Mode M0 | |||
|---|---|---|---|
| Quadrant | BADHDUFLAG | Total packets | Discarded packets |
| A | 0 | 4111 | 0 |
| B | 0 | 9084 | 0 |
| C | 0 | 4845 | 0 |
| D | 0 | 6404 | 0 |
| Mode SS | |||
|---|---|---|---|
| Quadrant | BADHDUFLAG | Total packets | Discarded packets |
| A | 0 | 42 | 0 |
| B | 0 | 42 | 0 |
| C | 0 | 42 | 0 |
| D | 0 | 42 | 0 |
| Quadrant | Total seconds | Saturated seconds | Saturation percentage |
|---|---|---|---|
| A | 2046 | 3 | 0.146628% |
| B | 2046 | 370 | 18.084066% |
| C | 2046 | 64 | 3.128055% |
| D | 2046 | 194 | 9.481916% |
Noise dominated data is calculated using 1-second bins in cleaned event files. If a bin has >2000 counts, and if more than 50% of those come from <1% of pixels, then it is considered to be noise-dominated and hence unusable.
| Quadrant | # 1 sec bins | Bins with >0 counts | Bins with >2000 counts | High rate bins dominated by noise | Noise dominated (total time) | Noise dominated (detector-on time) | Marked lightcurve |
|---|---|---|---|---|---|---|---|
| A | 2046 | 2046 | 0 | 0 | 0.00% | 0.00% | 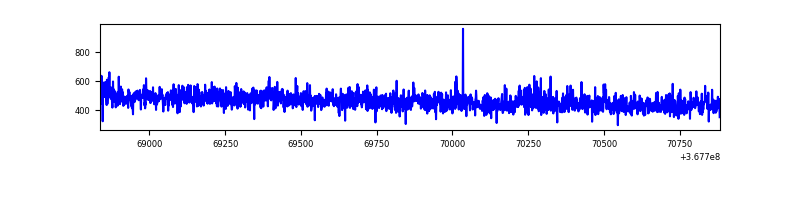 |
| B | 2045 | 2045 | 313 | 313 | 15.31% | 15.31% | 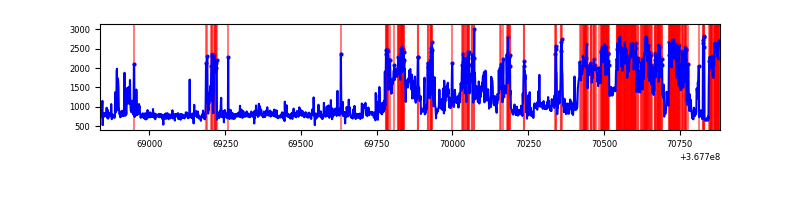 |
| C | 2046 | 2046 | 39 | 39 | 1.91% | 1.91% | 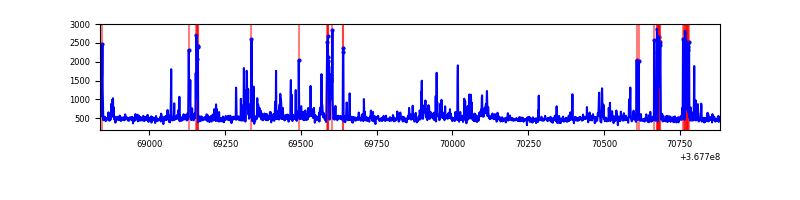 |
| D | 2046 | 2046 | 156 | 156 | 7.62% | 7.62% | 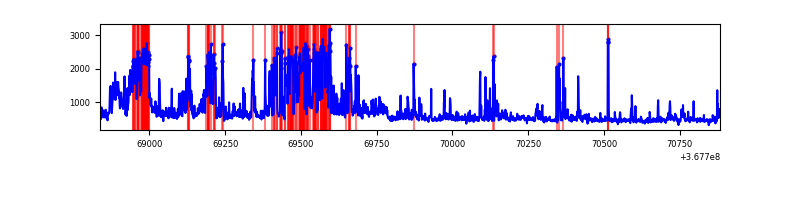 |
Top three noisy pixels from each quadrant. If the there are fewer than three noisy pixels in the level2.evt file, extra rows are filled as -1
| Pixel properties | Quadrant properties | ||||||
|---|---|---|---|---|---|---|---|
| Quadrant | DetID | PixID | Counts | Sigma | Mean | Median | Sigma |
| A | 14 | 238 | 16719 | 332.95 | 239 | 234 | 49.5 |
| A | 13 | 254 | 4045 | 76.97 | 239 | 234 | 49.5 |
| A | 13 | 6 | 3243 | 60.77 | 239 | 234 | 49.5 |
| B | 10 | 245 | 953659 | 21870.98 | 221 | 216 | 43.6 |
| B | 6 | 159 | 561328 | 12871.32 | 221 | 216 | 43.6 |
| B | 0 | 213 | 94680 | 2166.9 | 221 | 216 | 43.6 |
| C | 0 | 10 | 223206 | 4089.36 | 227 | 227 | 54.5 |
| C | 14 | 238 | 41519 | 757.28 | 227 | 227 | 54.5 |
| C | 3 | 233 | 29547 | 537.72 | 227 | 227 | 54.5 |
| D | 13 | 249 | 336073 | 6075.1 | 225 | 219 | 55.3 |
| D | 8 | 195 | 175458 | 3169.81 | 225 | 219 | 55.3 |
| D | 12 | 233 | 150769 | 2723.23 | 225 | 219 | 55.3 |
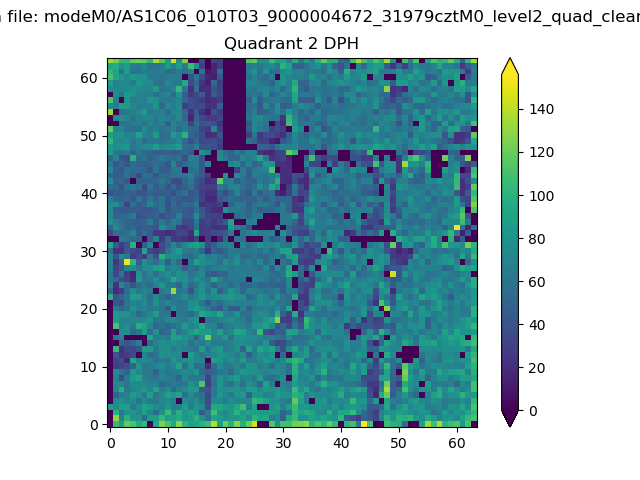
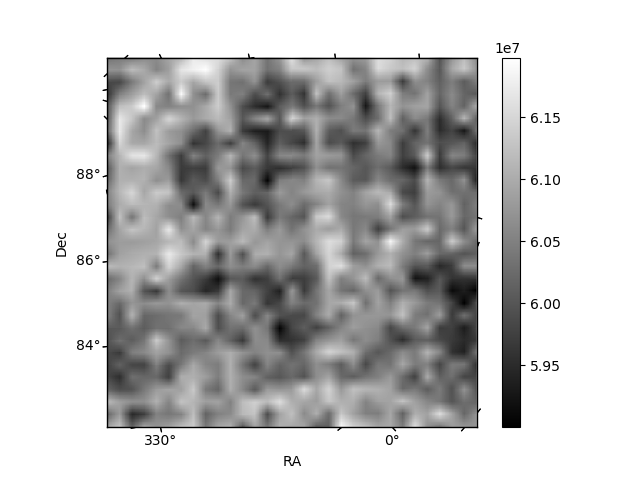
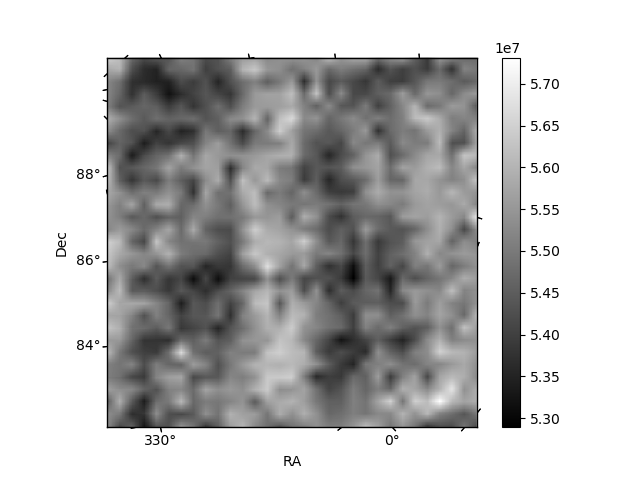
Histogram calculated using DETX and DETY for each event in the final _common_clean file
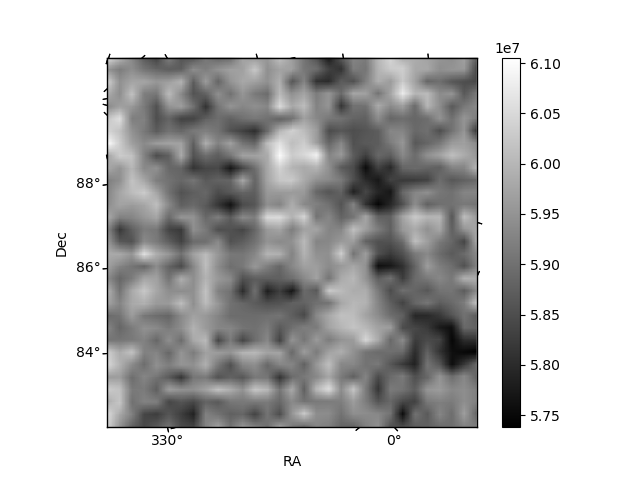
| Quadrant A | 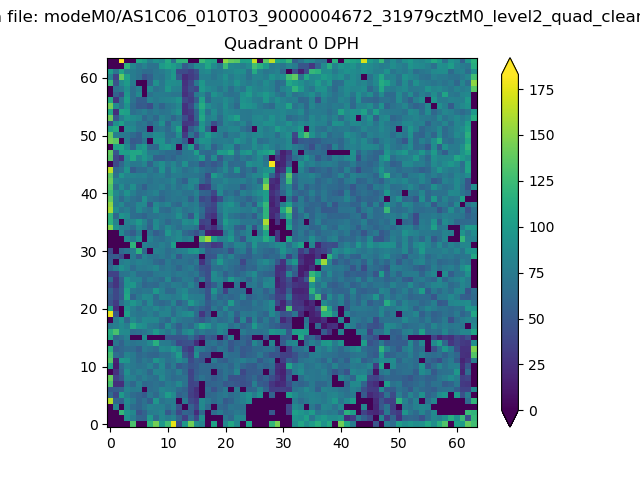 |
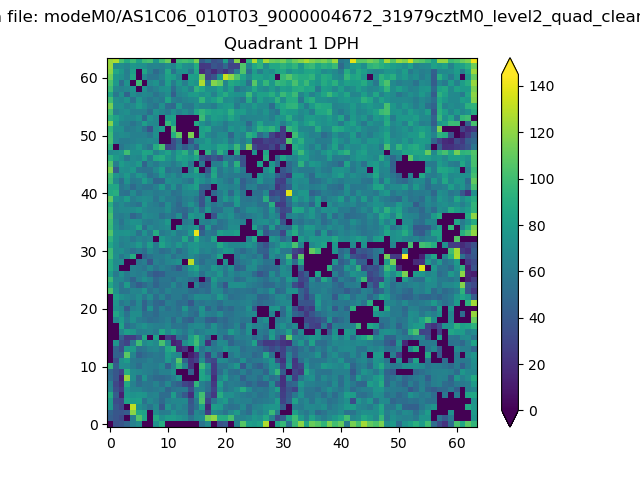 |
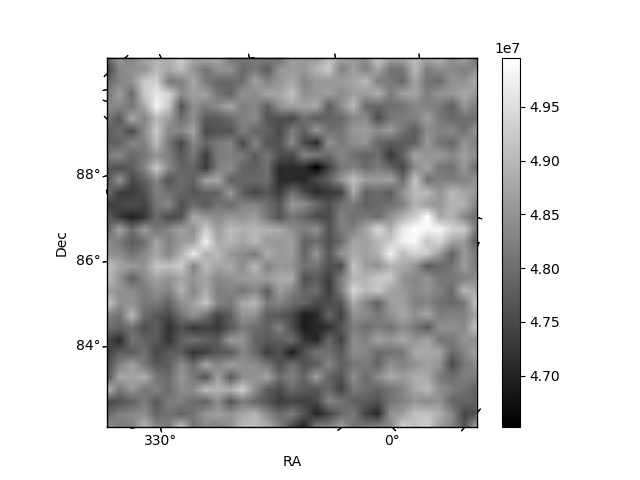
Quadrant B |
|---|---|---|---|
| Quadrant D | 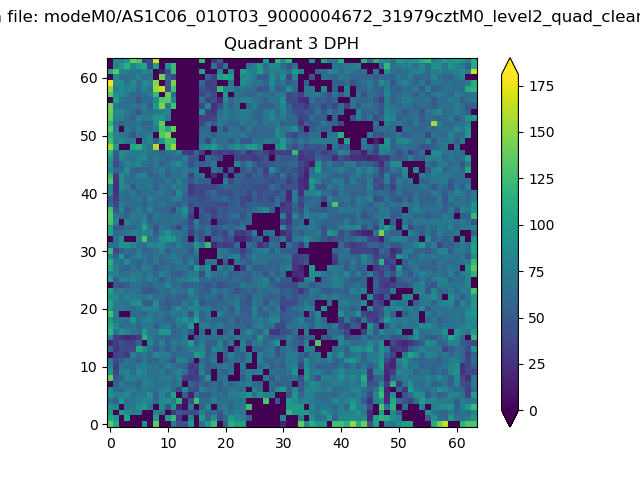 |
 |
Quadrant C |
| Plot type | Count rate plots | Images |
|---|---|---|
| Comparison with Poisson distribution Blue bars denote a histogram of data divided into 1 sec bins. Red curve is a Poisson curve with rate = median count rate of data. |
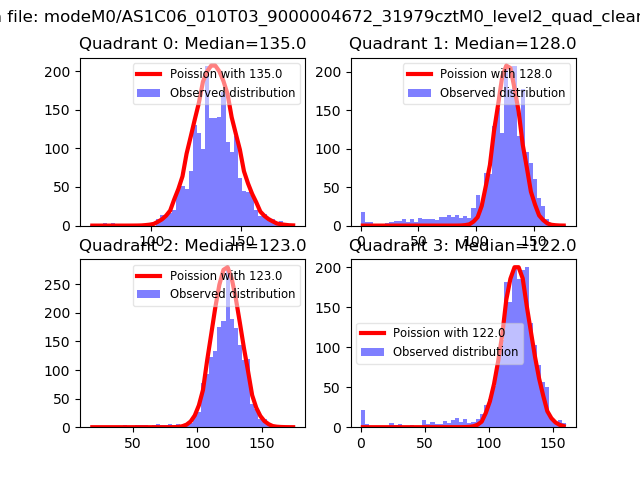 |
 |
| Quadrant-wise count rates Data is divided into 100 sec bins |
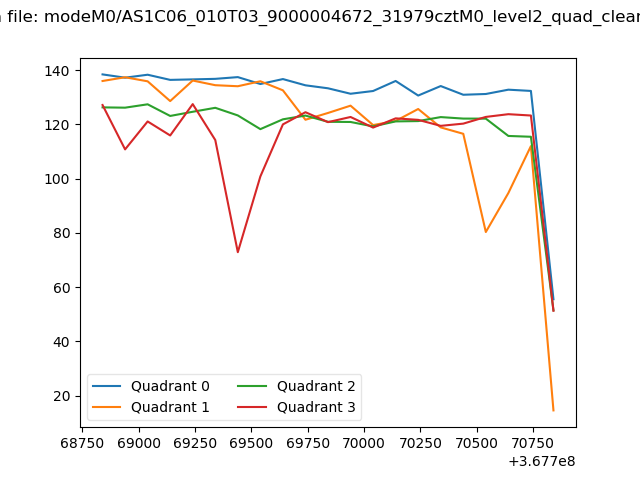 |
|
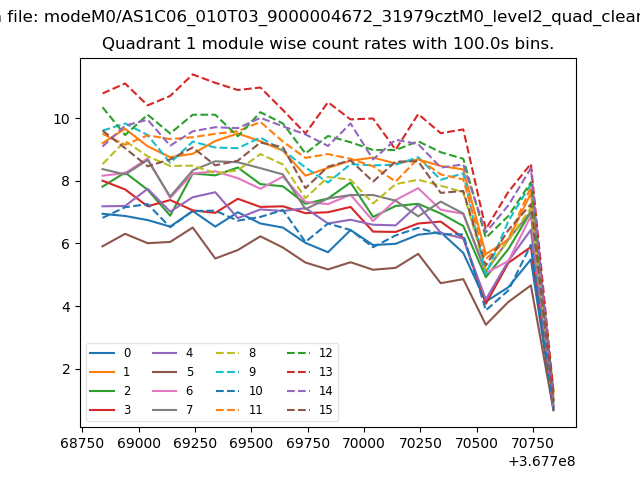
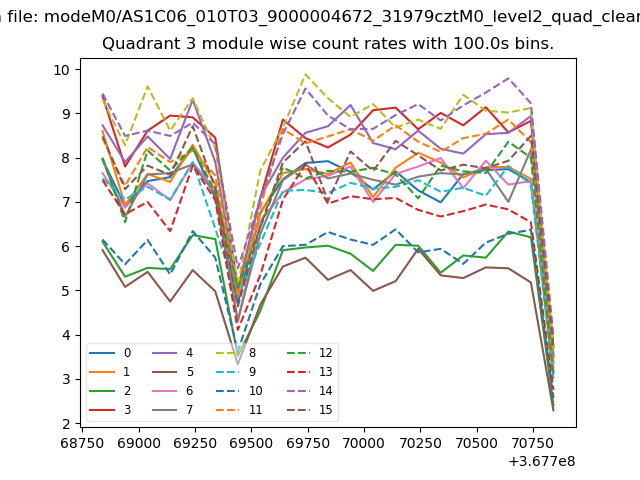
| Module-wise count rates for Quadrant A Data is divided into 100 sec bins |
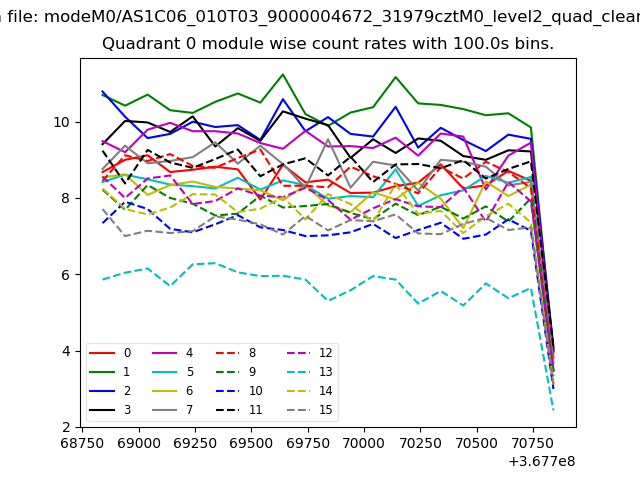 |
 |
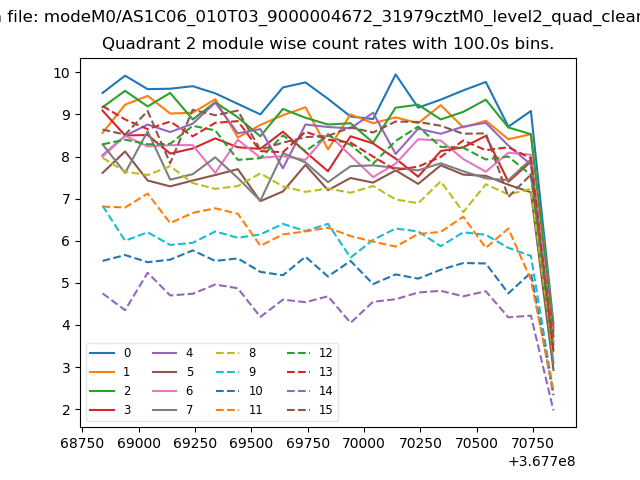
| Module-wise count rates for Quadrant B Data is divided into 100 sec bins |
 |
 |
| Module-wise count rates for Quadrant C Data is divided into 100 sec bins |
 |
 |
| Module-wise count rates for Quadrant D Data is divided into 100 sec bins |
 |
 |
| Parameter | Plot |
|---|---|
| CZT HV Monitor | 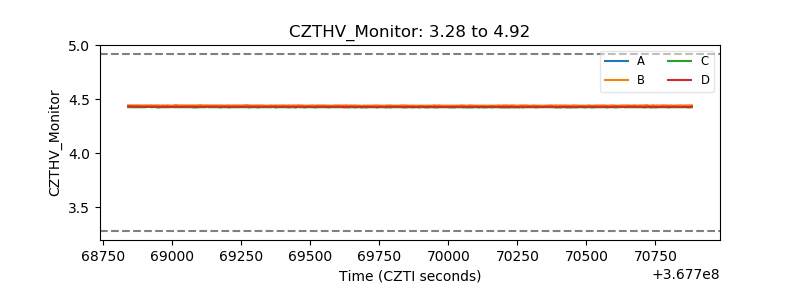 |
| D_VDD |  |
| Temperature 1 | 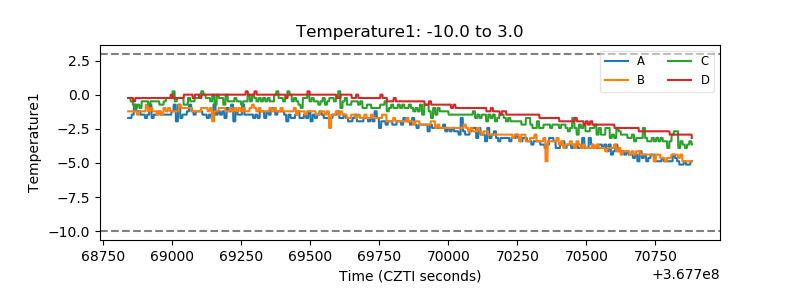 |
| Veto HV Monitor | 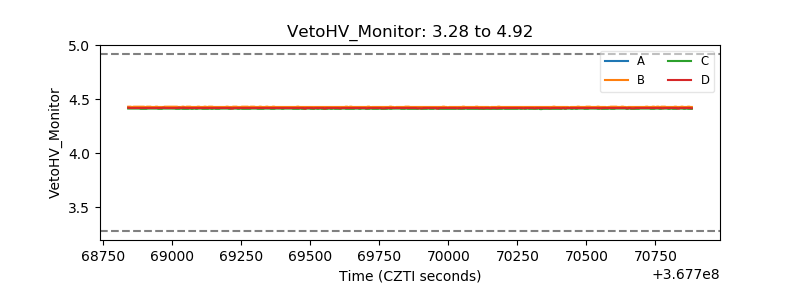 |
| Veto LLD | 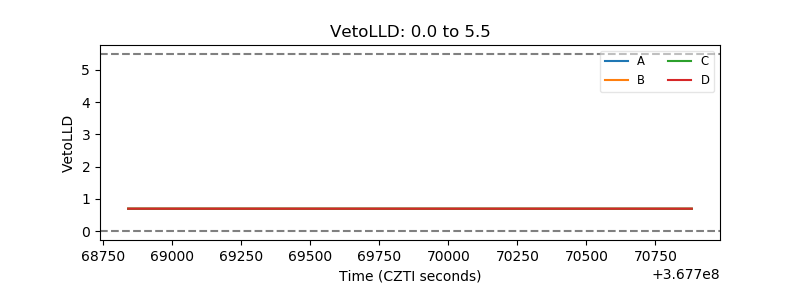 |
| Alpha Counter | 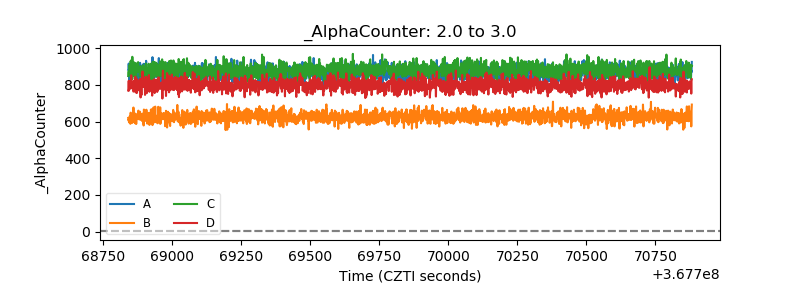 |
| _CPM_Rate |  |
| CZT Counter | 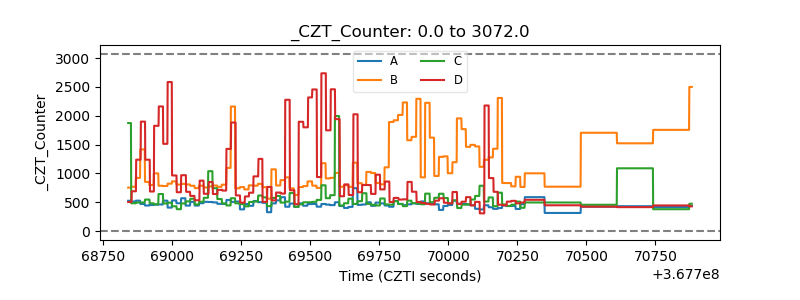 |
| +2.5 Volts monitor |  |
| +5 Volts monitor |  |
| _ROLL_ROT | 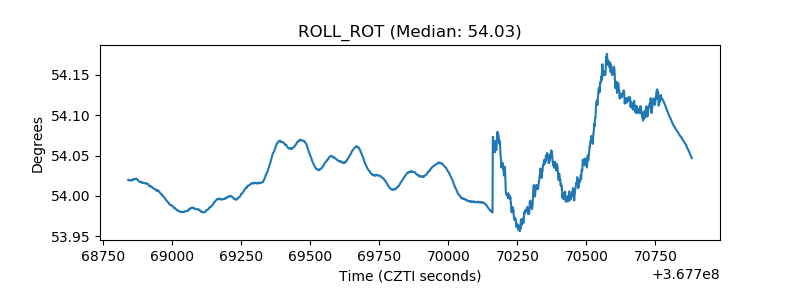 |
| _Roll_DEC | 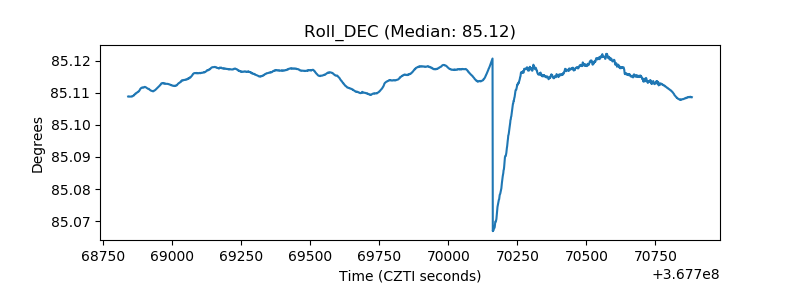 |
| _Roll_RA |  |
| Veto Counter | 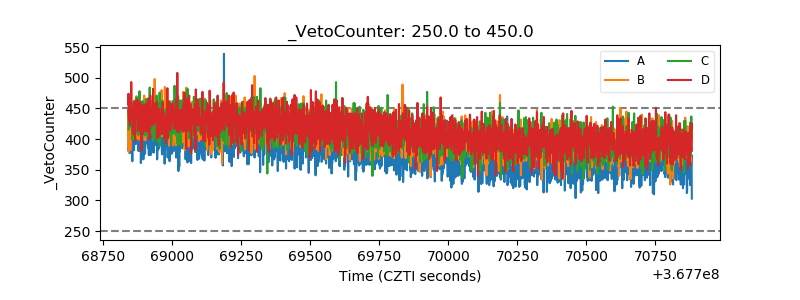 |