| Param | Original file | Final file |
|---|---|---|
| Filename | modeM0/AS1C06_010T03_9000004676_31995cztM0_level2.evt | modeM0/AS1C06_010T03_9000004676_31995cztM0_level2_quad_clean.evt |
| Size (bytes) | 428,126,400 | 97,902,720 |
| Size | 408.3 MB | 93.4 MB |
| Events in quadrant A | 2,419,976 | 673,306 |
| Events in quadrant B | 4,159,477 | 662,992 |
| Events in quadrant C | 3,324,094 | 630,200 |
| Events in quadrant D | 2,716,057 | 641,056 |
| Mode SS | |||
|---|---|---|---|
| Quadrant | BADHDUFLAG | Total packets | Discarded packets |
| A | 0 | 104 | 0 |
| B | 0 | 104 | 0 |
| C | 0 | 104 | 0 |
| D | 0 | 104 | 0 |
| Mode M0 | |||
|---|---|---|---|
| Quadrant | BADHDUFLAG | Total packets | Discarded packets |
| A | 0 | 10560 | 1 |
| B | 0 | 16187 | 1 |
| C | 0 | 13275 | 1 |
| D | 0 | 11826 | 2 |
| Mode M9 | |||
|---|---|---|---|
| Quadrant | BADHDUFLAG | Total packets | Discarded packets |
| A | 0 | 2 | 0 |
| B | 0 | 2 | 0 |
| C | 0 | 2 | 0 |
| D | 0 | 2 | 0 |
| Quadrant | Total seconds | Saturated seconds | Saturation percentage |
|---|---|---|---|
| A | 5099 | 40 | 0.784468% |
| B | 5099 | 253 | 4.961757% |
| C | 5099 | 300 | 5.883507% |
| D | 5098 | 92 | 1.804629% |
Noise dominated data is calculated using 1-second bins in cleaned event files. If a bin has >2000 counts, and if more than 50% of those come from <1% of pixels, then it is considered to be noise-dominated and hence unusable.
| Quadrant | # 1 sec bins | Bins with >0 counts | Bins with >2000 counts | High rate bins dominated by noise | Noise dominated (total time) | Noise dominated (detector-on time) | Marked lightcurve |
|---|---|---|---|---|---|---|---|
| A | 5309 | 5099 | 0 | 0 | 0.00% | 0.00% | 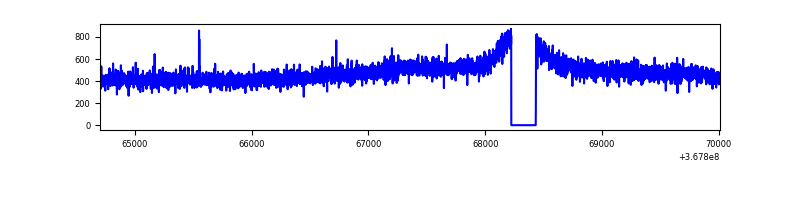 |
| B | 5309 | 5099 | 82 | 82 | 1.54% | 1.61% | 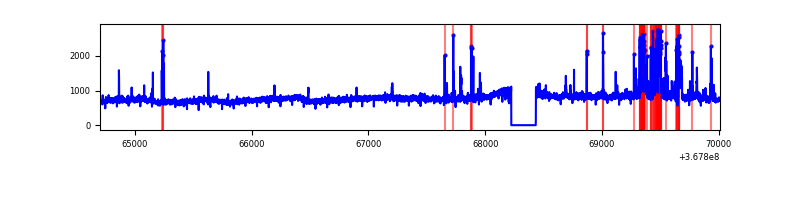 |
| C | 5309 | 5099 | 26 | 26 | 0.49% | 0.51% |  |
| D | 5308 | 5098 | 22 | 22 | 0.41% | 0.43% |  |
Top three noisy pixels from each quadrant. If the there are fewer than three noisy pixels in the level2.evt file, extra rows are filled as -1
| Pixel properties | Quadrant properties | ||||||
|---|---|---|---|---|---|---|---|
| Quadrant | DetID | PixID | Counts | Sigma | Mean | Median | Sigma |
| A | 13 | 6 | 12314 | 92.71 | 623 | 611 | 126.2 |
| A | 13 | 254 | 8510 | 62.58 | 623 | 611 | 126.2 |
| A | 3 | 137 | 6418 | 46.0 | 623 | 611 | 126.2 |
| B | 6 | 159 | 1424339 | 12103.61 | 611 | 595 | 117.6 |
| B | 10 | 245 | 233553 | 1980.44 | 611 | 595 | 117.6 |
| B | 5 | 172 | 63735 | 536.77 | 611 | 595 | 117.6 |
| C | 3 | 233 | 714011 | 5185.55 | 587 | 588 | 137.6 |
| C | 14 | 238 | 109047 | 788.34 | 587 | 588 | 137.6 |
| C | 0 | 10 | 65750 | 473.63 | 587 | 588 | 137.6 |
| D | 7 | 238 | 188886 | 1295.91 | 605 | 587 | 145.3 |
| D | 8 | 195 | 93892 | 642.14 | 605 | 587 | 145.3 |
| D | 2 | 250 | 61912 | 422.05 | 605 | 587 | 145.3 |
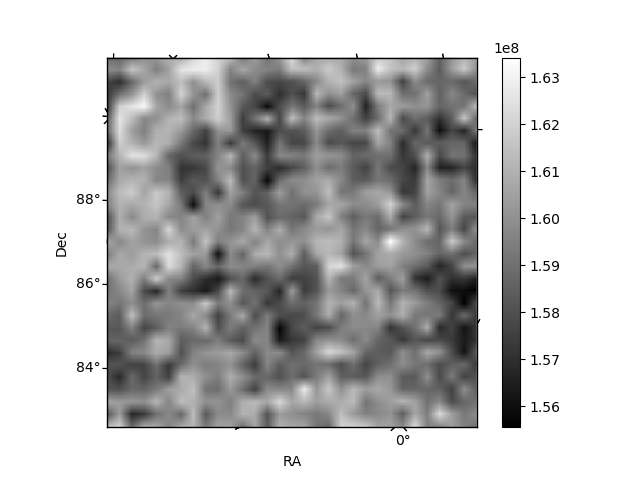
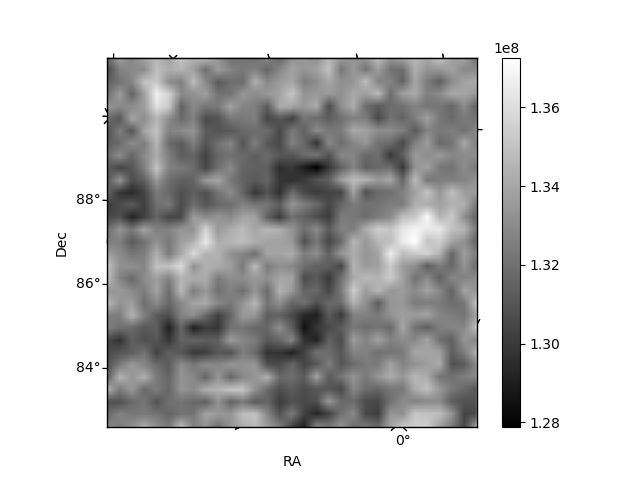
Histogram calculated using DETX and DETY for each event in the final _common_clean file
| Quadrant A | 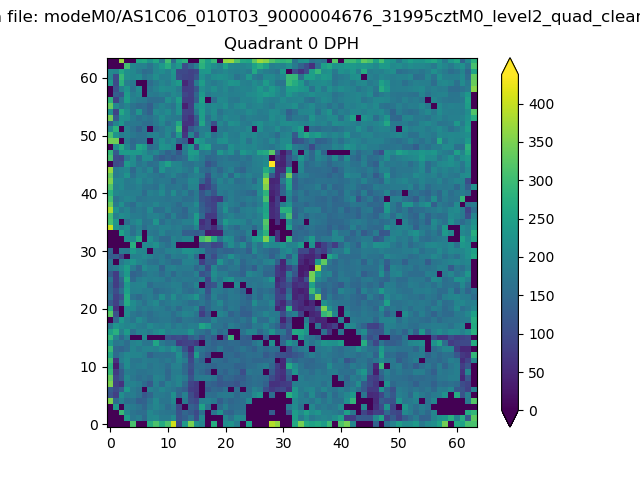 |
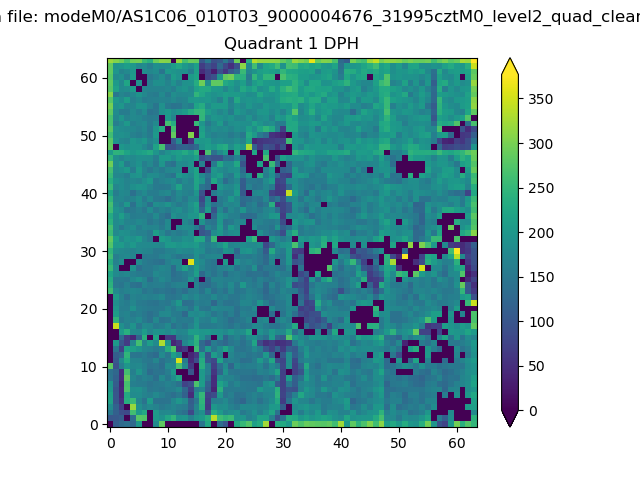 |
Quadrant B |
|---|---|---|---|
| Quadrant D |  |
 |
Quadrant C |
| Plot type | Count rate plots | Images |
|---|---|---|
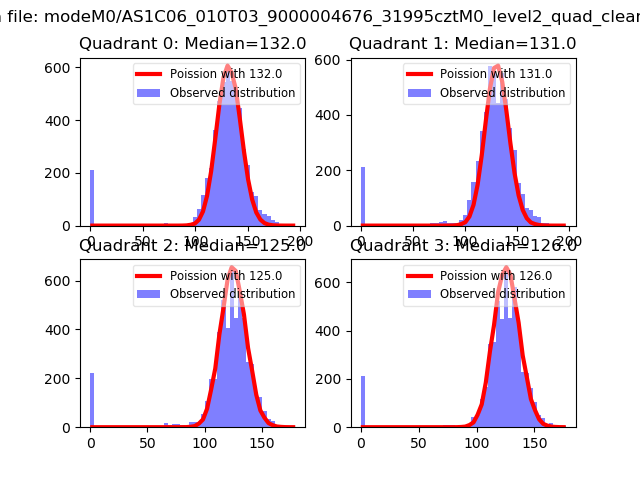
| Comparison with Poisson distribution Blue bars denote a histogram of data divided into 1 sec bins. Red curve is a Poisson curve with rate = median count rate of data. |
 |
 |
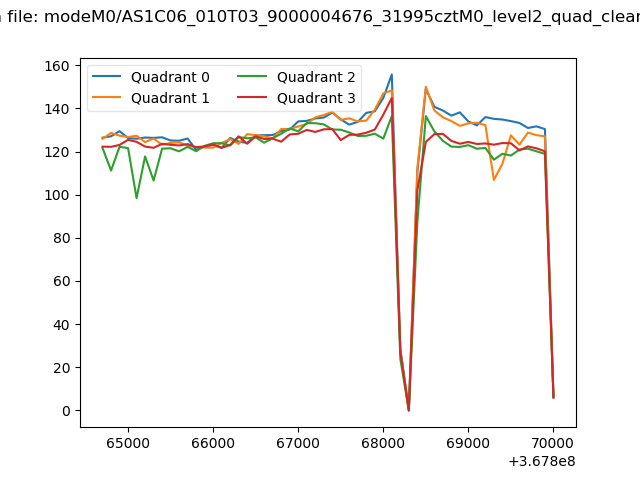
| Quadrant-wise count rates Data is divided into 100 sec bins |
 |
|
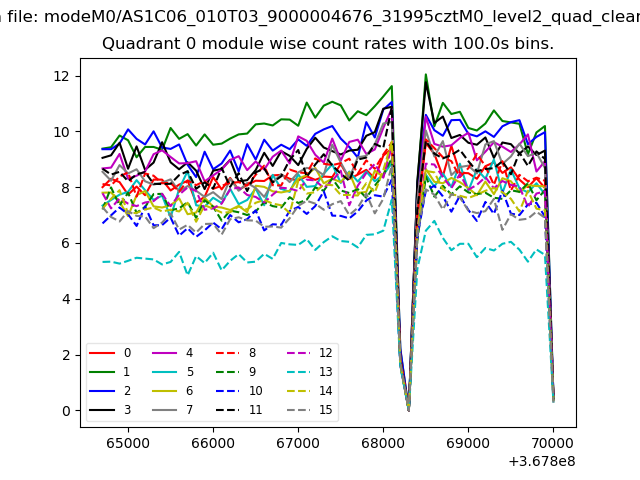
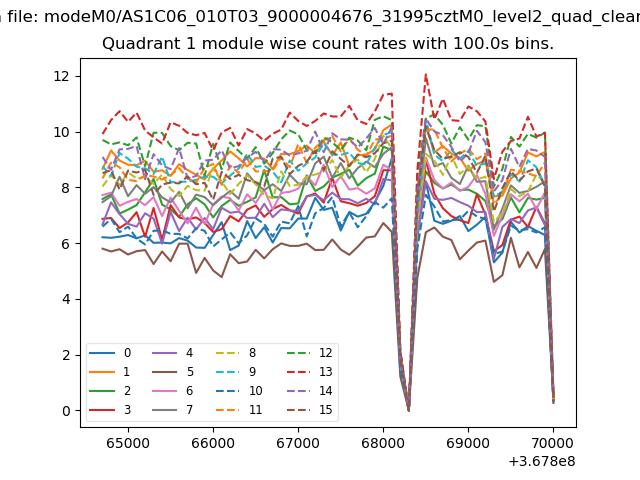
| Module-wise count rates for Quadrant A Data is divided into 100 sec bins |
 |
 |
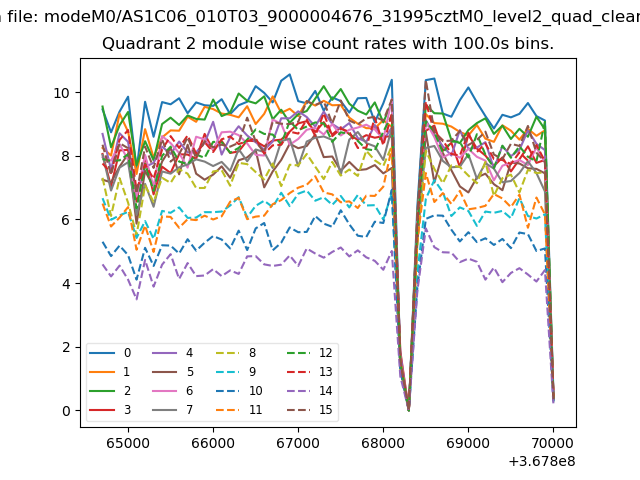
| Module-wise count rates for Quadrant B Data is divided into 100 sec bins |
 |
 |
| Module-wise count rates for Quadrant C Data is divided into 100 sec bins |
 |
 |
| Module-wise count rates for Quadrant D Data is divided into 100 sec bins |
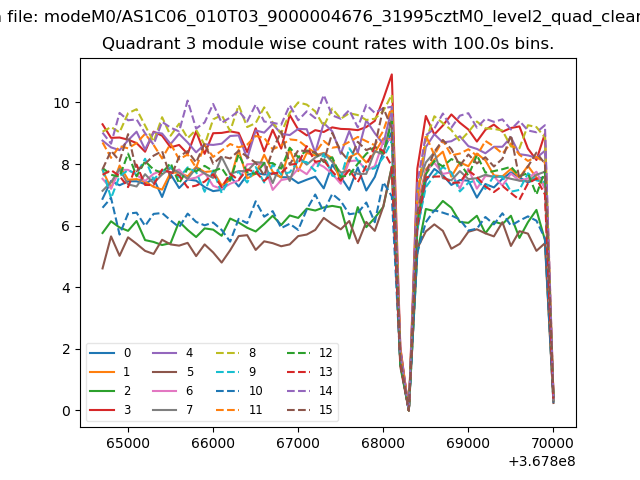 |
 |
| Parameter | Plot |
|---|---|
| CZT HV Monitor | 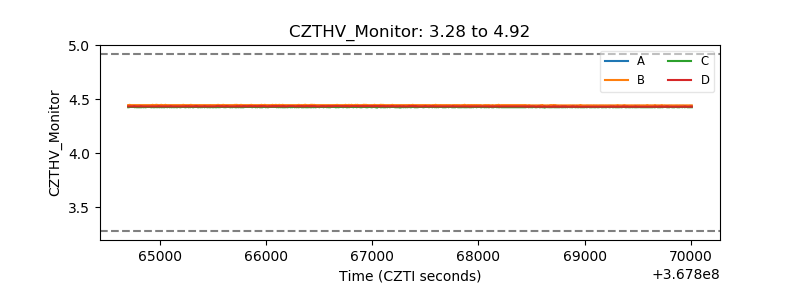 |
| D_VDD | 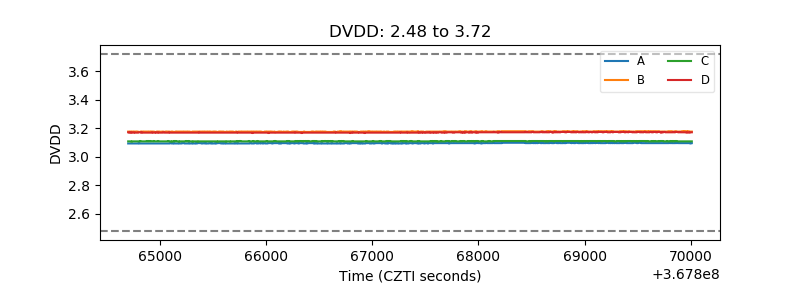 |
| Temperature 1 | 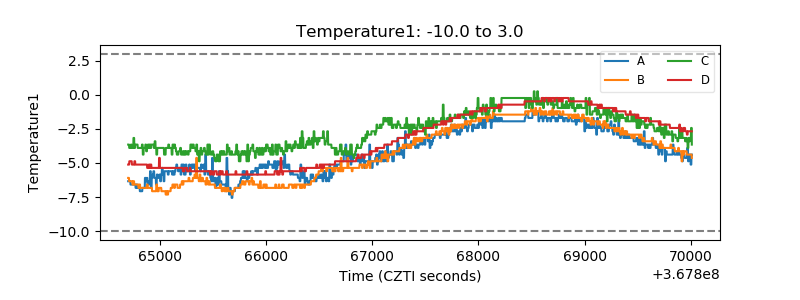 |
| Veto HV Monitor | 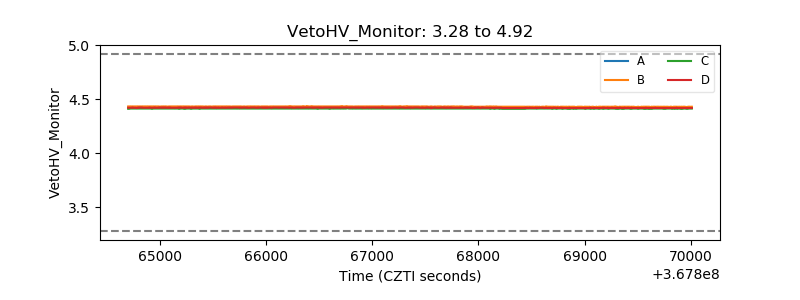 |
| Veto LLD | 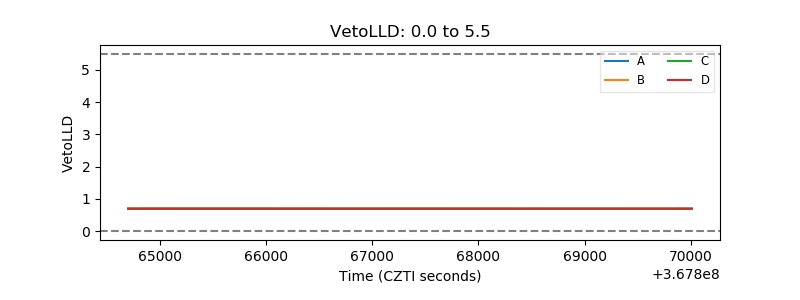 |
| Alpha Counter | 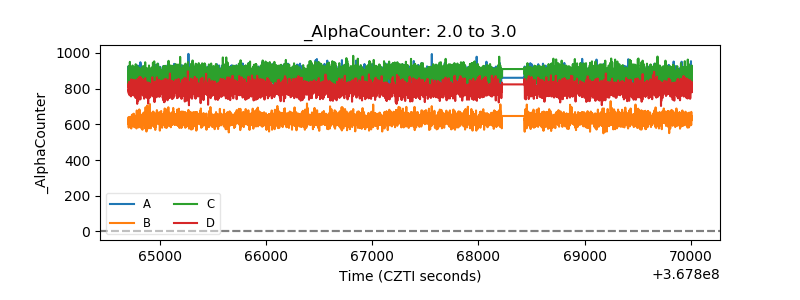 |
| _CPM_Rate | 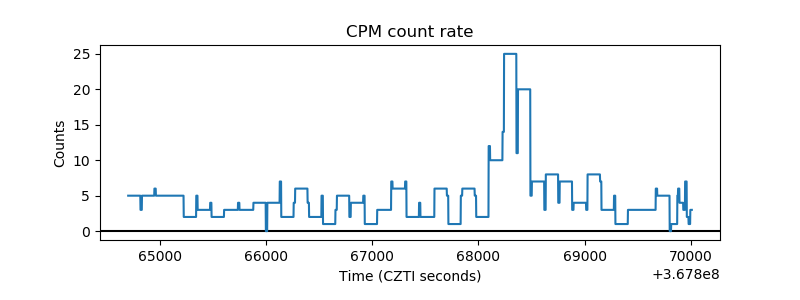 |
| CZT Counter |  |
| +2.5 Volts monitor |  |
| +5 Volts monitor |  |
| _ROLL_ROT | 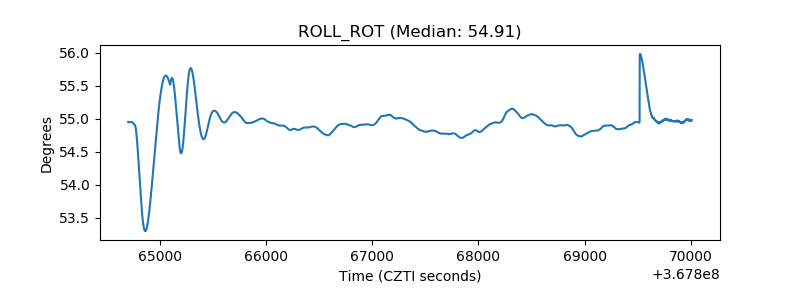 |
| _Roll_DEC | 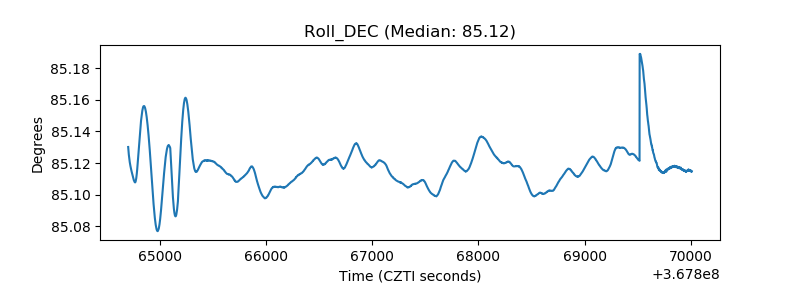 |
| _Roll_RA | 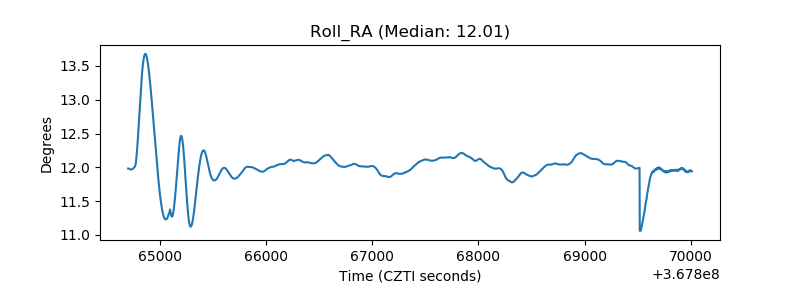 |
| Veto Counter | 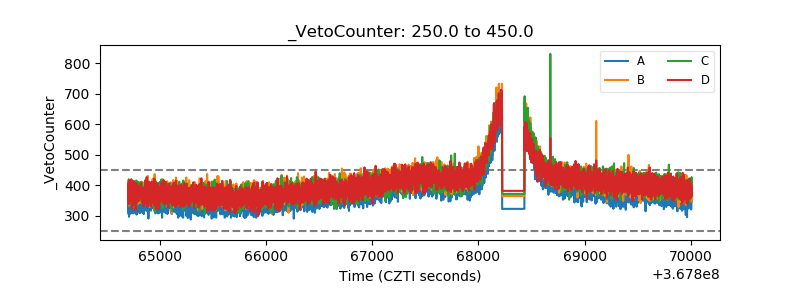 |