| Param | Original file | Final file |
|---|---|---|
| Filename | modeM0/AS1C06_010T03_9000004676_31996cztM0_level2.evt | modeM0/AS1C06_010T03_9000004676_31996cztM0_level2_quad_clean.evt |
| Size (bytes) | 669,479,040 | 142,367,040 |
| Size | 638.5 MB | 135.8 MB |
| Events in quadrant A | 3,604,651 | 986,765 |
| Events in quadrant B | 6,522,991 | 958,275 |
| Events in quadrant C | 4,934,071 | 924,530 |
| Events in quadrant D | 4,704,146 | 918,123 |
| Mode SS | |||
|---|---|---|---|
| Quadrant | BADHDUFLAG | Total packets | Discarded packets |
| A | 0 | 154 | 0 |
| B | 0 | 154 | 0 |
| C | 0 | 154 | 0 |
| D | 0 | 154 | 0 |
| Mode M0 | |||
|---|---|---|---|
| Quadrant | BADHDUFLAG | Total packets | Discarded packets |
| A | 0 | 15669 | 2 |
| B | 0 | 24984 | 2 |
| C | 0 | 19729 | 8 |
| D | 0 | 19060 | 2 |
| Mode M9 | |||
|---|---|---|---|
| Quadrant | BADHDUFLAG | Total packets | Discarded packets |
| A | 0 | 4 | 0 |
| B | 0 | 4 | 0 |
| C | 0 | 4 | 0 |
| D | 0 | 4 | 0 |
| Quadrant | Total seconds | Saturated seconds | Saturation percentage |
|---|---|---|---|
| A | 7528 | 54 | 0.717322% |
| B | 7528 | 374 | 4.968119% |
| C | 7528 | 295 | 3.918704% |
| D | 7528 | 303 | 4.024973% |
Noise dominated data is calculated using 1-second bins in cleaned event files. If a bin has >2000 counts, and if more than 50% of those come from <1% of pixels, then it is considered to be noise-dominated and hence unusable.
| Quadrant | # 1 sec bins | Bins with >0 counts | Bins with >2000 counts | High rate bins dominated by noise | Noise dominated (total time) | Noise dominated (detector-on time) | Marked lightcurve |
|---|---|---|---|---|---|---|---|
| A | 7963 | 7528 | 22 | 22 | 0.28% | 0.29% | 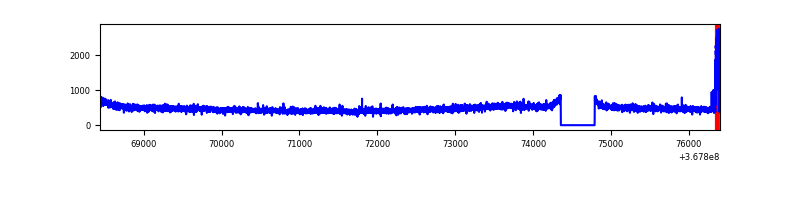 |
| B | 7963 | 7528 | 209 | 209 | 2.62% | 2.78% | 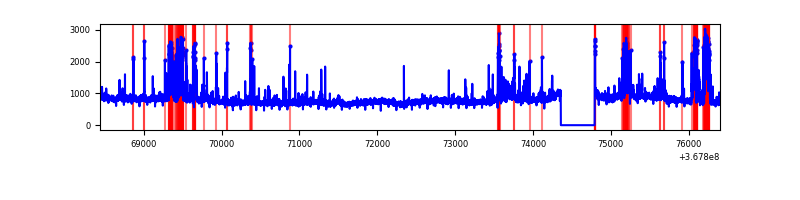 |
| C | 7962 | 7527 | 27 | 27 | 0.34% | 0.36% | 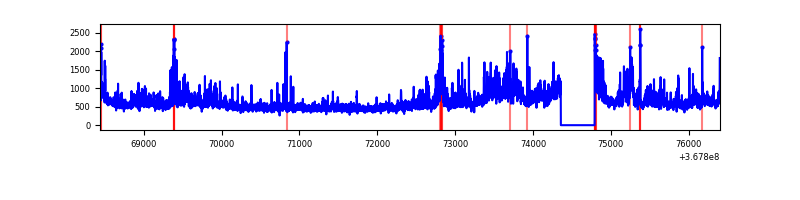 |
| D | 7962 | 7527 | 213 | 213 | 2.68% | 2.83% | 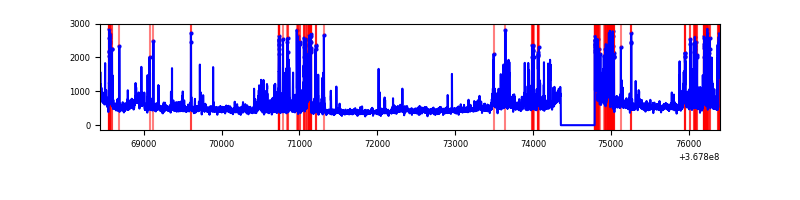 |
Top three noisy pixels from each quadrant. If the there are fewer than three noisy pixels in the level2.evt file, extra rows are filled as -1
| Pixel properties | Quadrant properties | ||||||
|---|---|---|---|---|---|---|---|
| Quadrant | DetID | PixID | Counts | Sigma | Mean | Median | Sigma |
| A | 15 | 174 | 73546 | 400.15 | 908 | 891 | 181.6 |
| A | 13 | 6 | 25389 | 134.92 | 908 | 891 | 181.6 |
| A | 13 | 254 | 13190 | 67.74 | 908 | 891 | 181.6 |
| B | 6 | 159 | 2122414 | 12632.46 | 884 | 861 | 167.9 |
| B | 10 | 245 | 599077 | 3561.98 | 884 | 861 | 167.9 |
| B | 5 | 172 | 190210 | 1127.45 | 884 | 861 | 167.9 |
| C | 3 | 233 | 1185286 | 5899.05 | 863 | 866 | 200.8 |
| C | 0 | 10 | 154016 | 762.77 | 863 | 866 | 200.8 |
| C | 14 | 238 | 140505 | 695.48 | 863 | 866 | 200.8 |
| D | 2 | 250 | 528252 | 2533.45 | 874 | 847 | 208.2 |
| D | 13 | 249 | 449168 | 2153.56 | 874 | 847 | 208.2 |
| D | 8 | 195 | 236570 | 1132.32 | 874 | 847 | 208.2 |
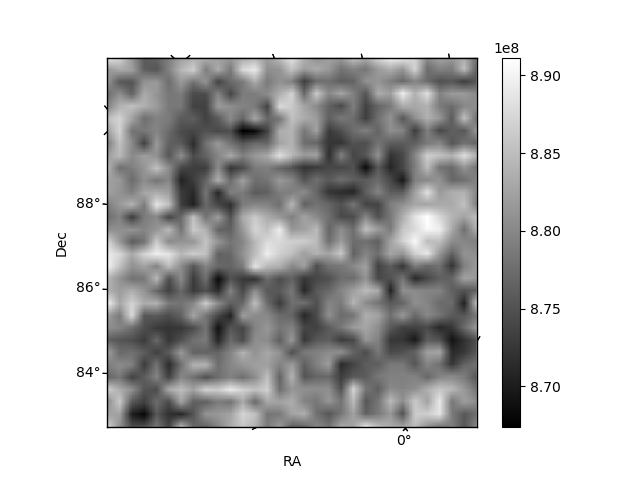
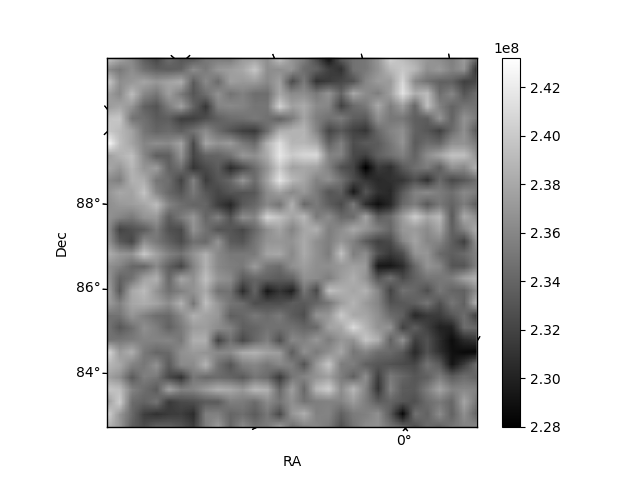
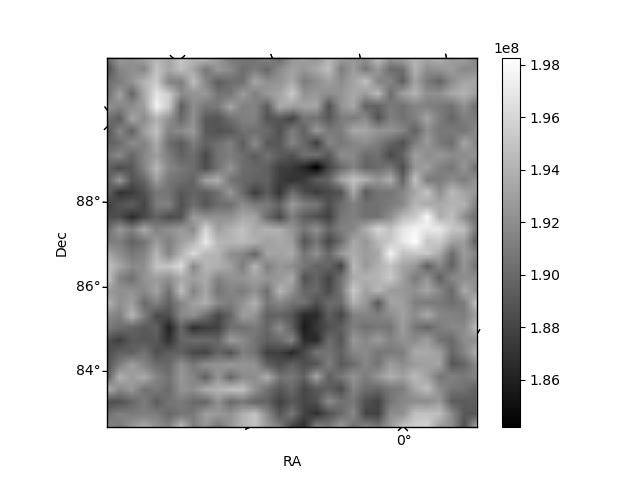
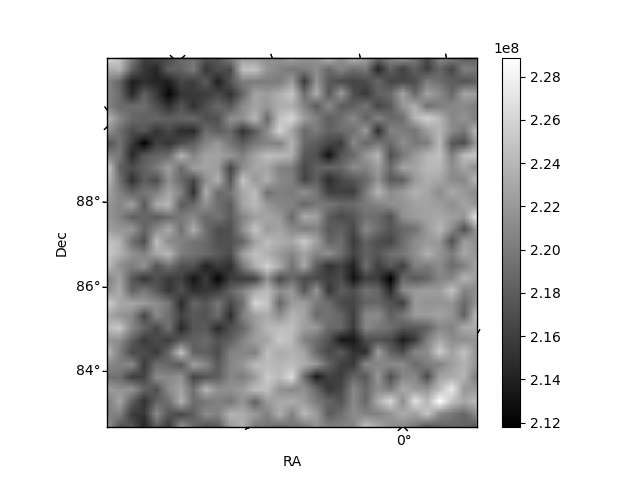
Histogram calculated using DETX and DETY for each event in the final _common_clean file
| Quadrant A | 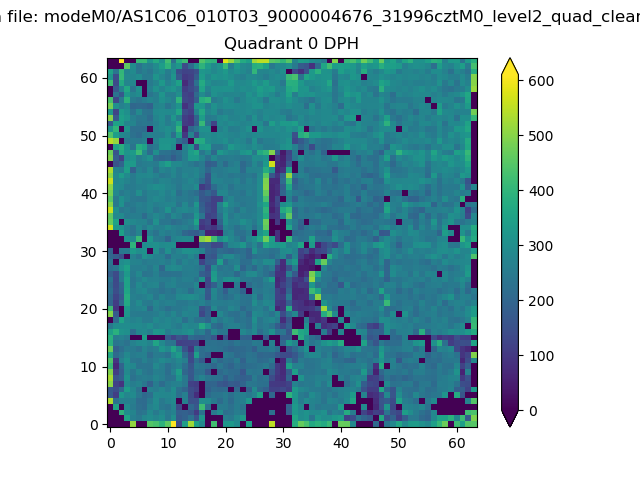 |
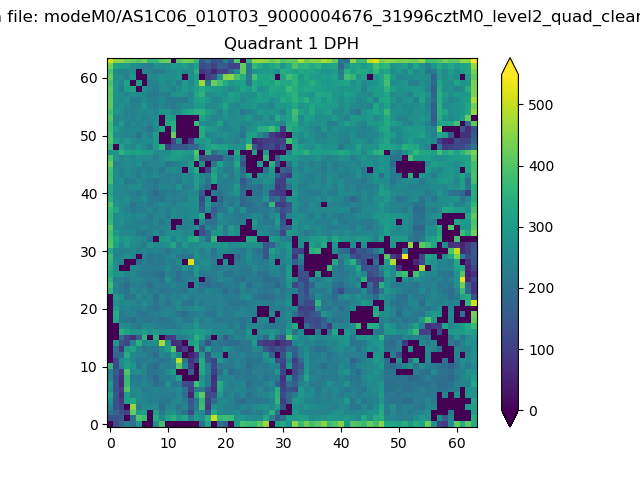 |
Quadrant B |
|---|---|---|---|
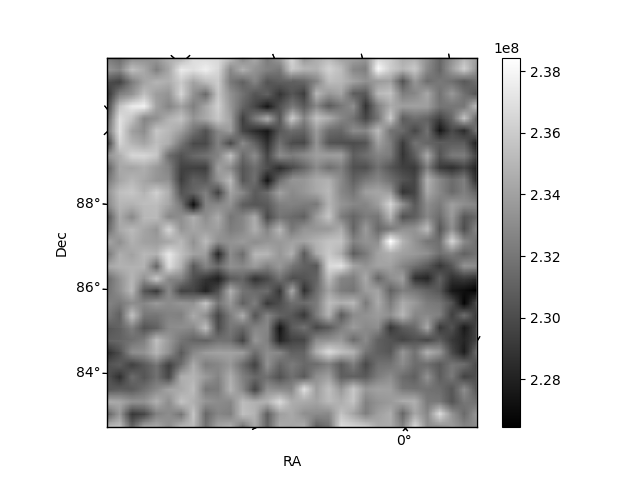
| Quadrant D |  |
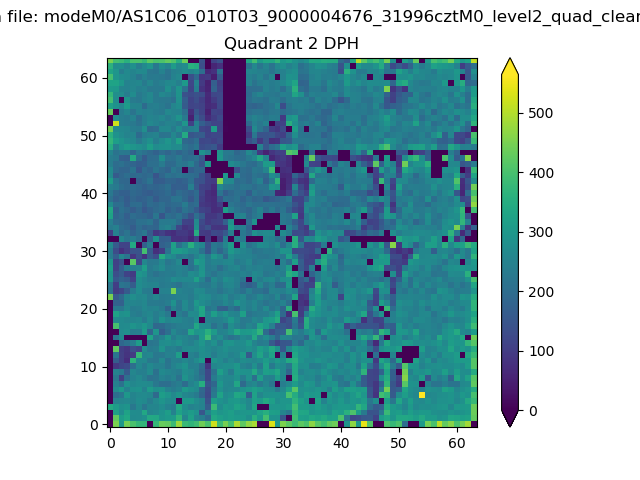 |
Quadrant C |
| Plot type | Count rate plots | Images |
|---|---|---|
| Comparison with Poisson distribution Blue bars denote a histogram of data divided into 1 sec bins. Red curve is a Poisson curve with rate = median count rate of data. |
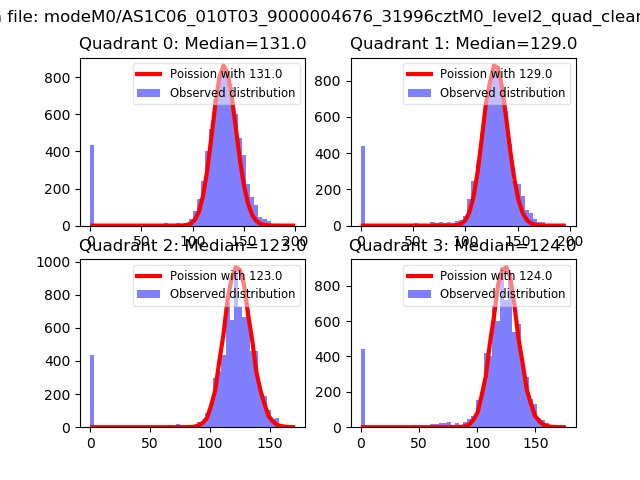 |
 |
| Quadrant-wise count rates Data is divided into 100 sec bins |
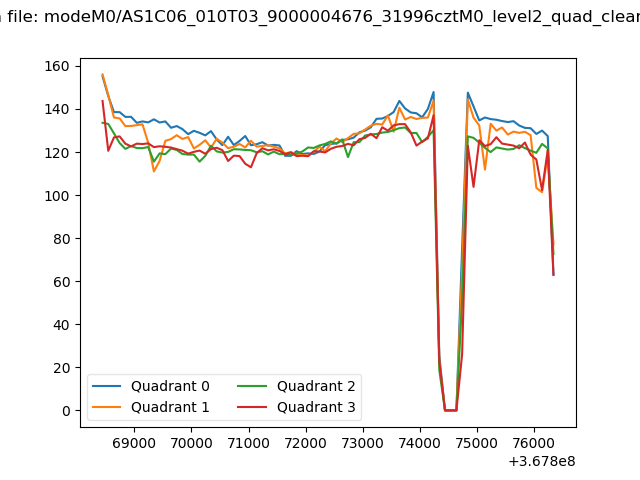 |
|
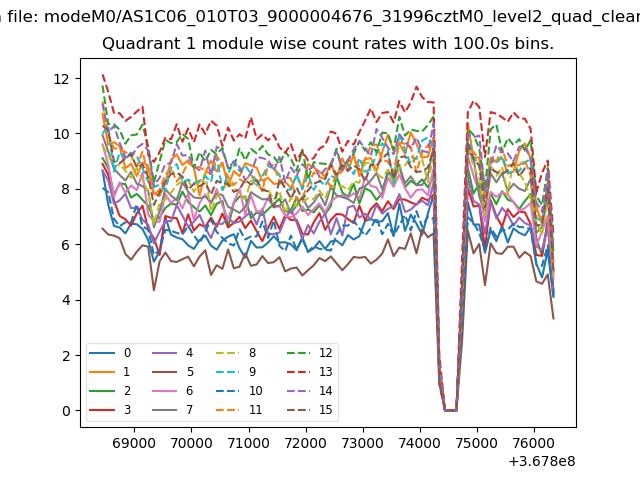
| Module-wise count rates for Quadrant A Data is divided into 100 sec bins |
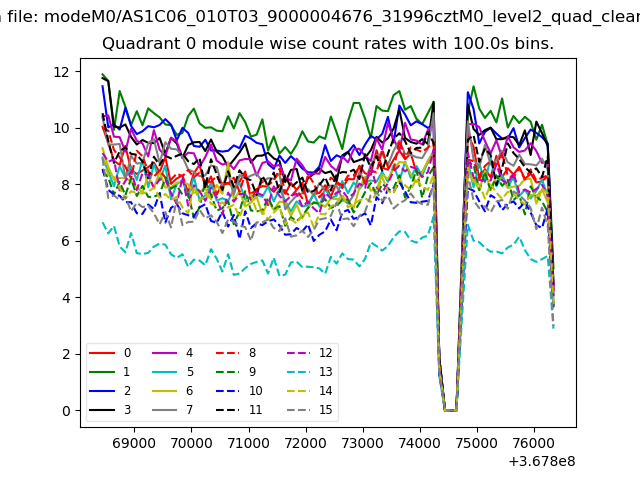 |
 |
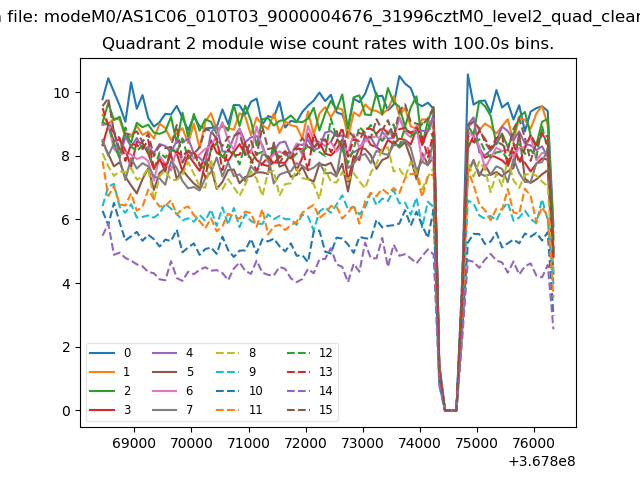
| Module-wise count rates for Quadrant B Data is divided into 100 sec bins |
 |
 |
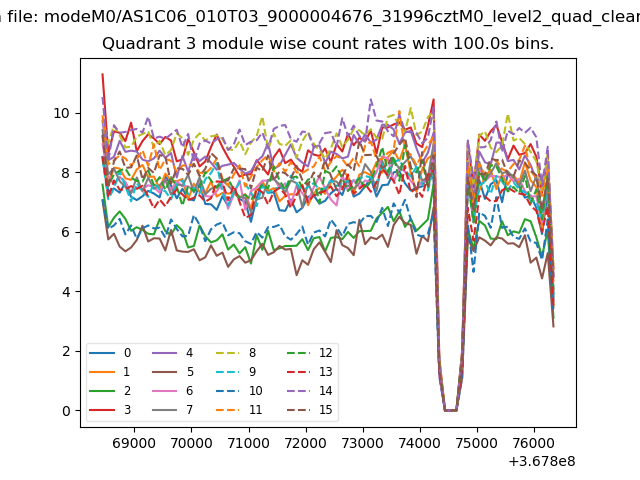
| Module-wise count rates for Quadrant C Data is divided into 100 sec bins |
 |
 |
| Module-wise count rates for Quadrant D Data is divided into 100 sec bins |
 |
 |
| Parameter | Plot |
|---|---|
| CZT HV Monitor | 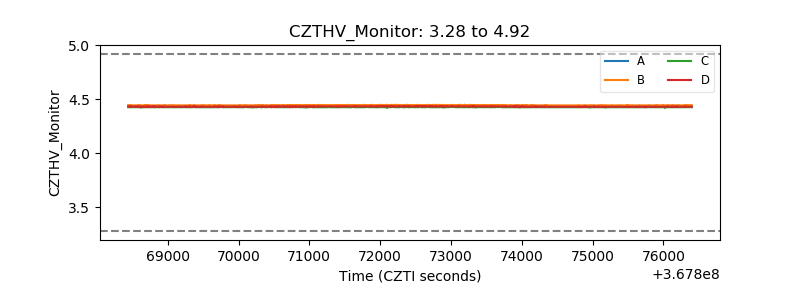 |
| D_VDD | 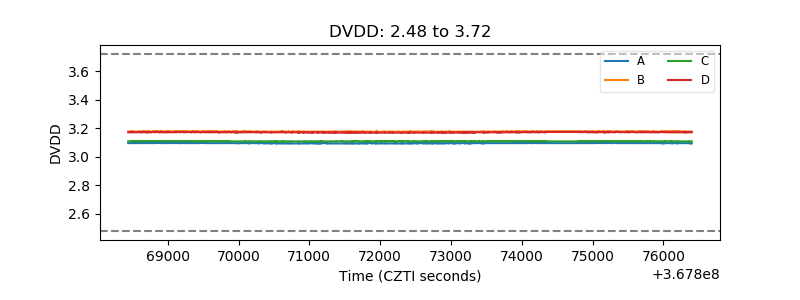 |
| Temperature 1 | 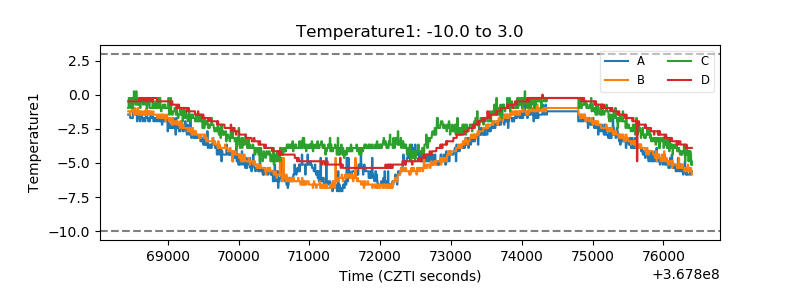 |
| Veto HV Monitor |  |
| Veto LLD | 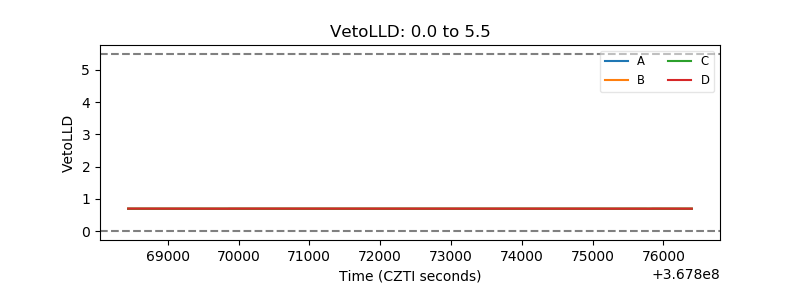 |
| Alpha Counter | 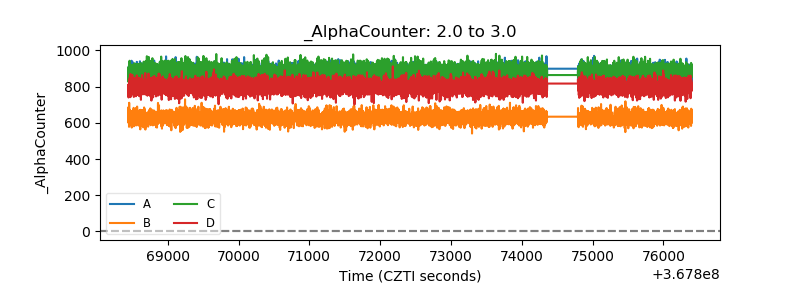 |
| _CPM_Rate | 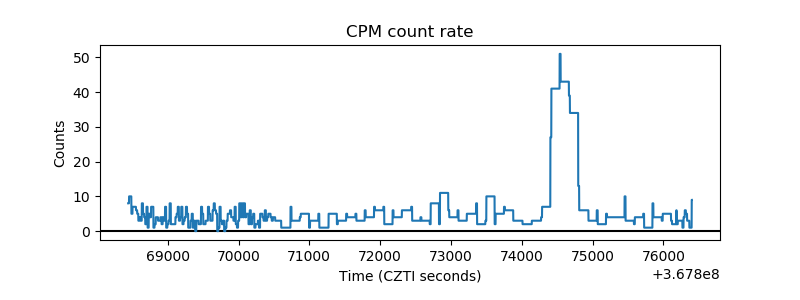 |
| CZT Counter | 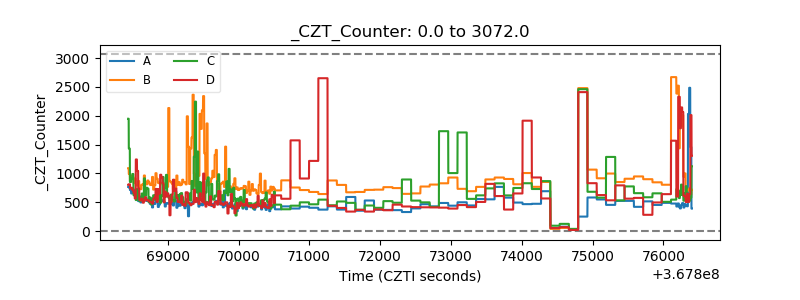 |
| +2.5 Volts monitor | 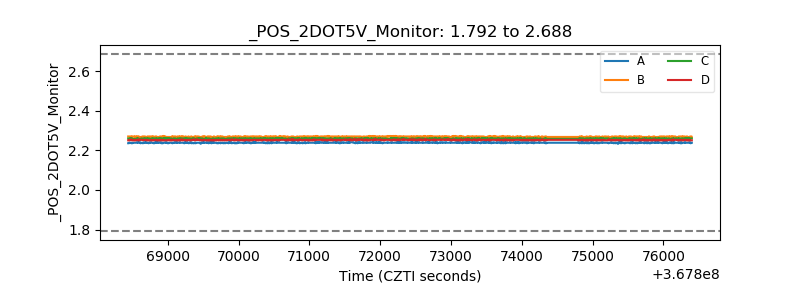 |
| +5 Volts monitor | 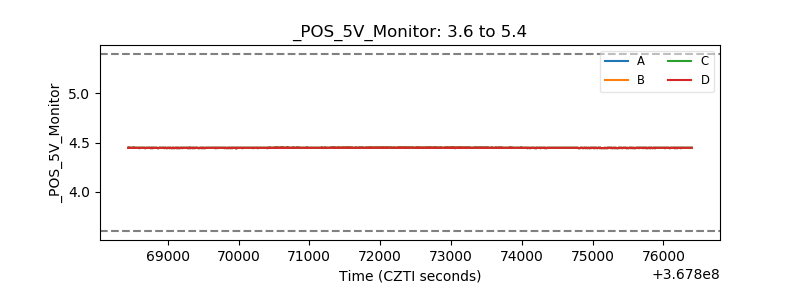 |
| _ROLL_ROT | 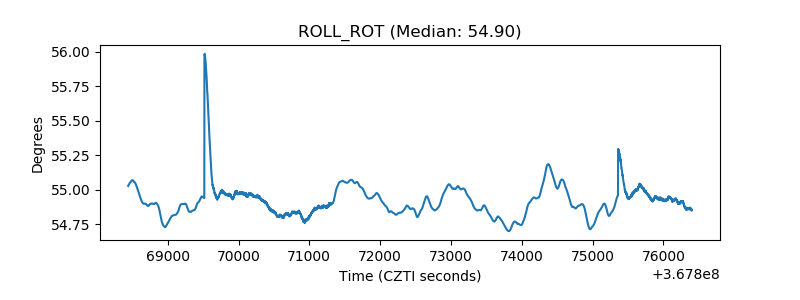 |
| _Roll_DEC | 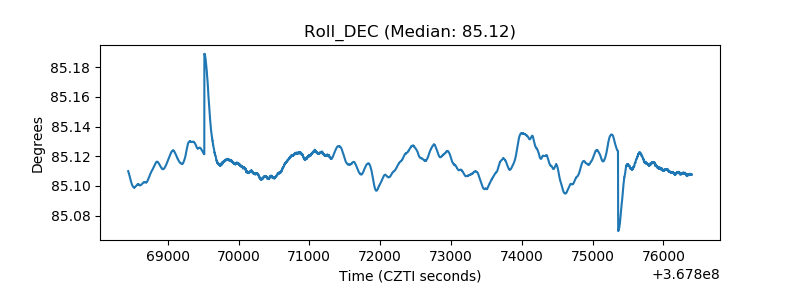 |
| _Roll_RA | 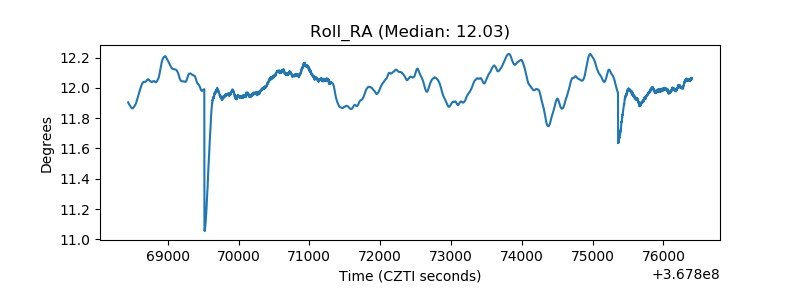 |
| Veto Counter | 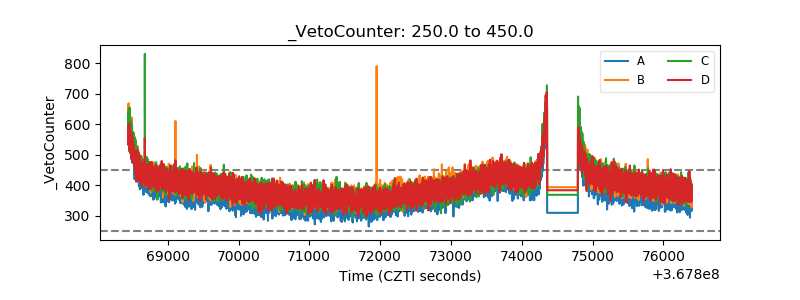 |