| Param | Original file | Final file |
|---|---|---|
| Filename | modeM0/AS1C06_010T03_9000004676_31999cztM0_level2.evt | modeM0/AS1C06_010T03_9000004676_31999cztM0_level2_quad_clean.evt |
| Size (bytes) | 570,090,240 | 131,374,080 |
| Size | 543.7 MB | 125.3 MB |
| Events in quadrant A | 3,161,717 | 900,090 |
| Events in quadrant B | 5,581,971 | 893,909 |
| Events in quadrant C | 3,849,766 | 862,495 |
| Events in quadrant D | 4,207,497 | 844,963 |
| Mode SS | |||
|---|---|---|---|
| Quadrant | BADHDUFLAG | Total packets | Discarded packets |
| A | 0 | 140 | 0 |
| B | 0 | 140 | 0 |
| C | 0 | 140 | 0 |
| D | 0 | 140 | 0 |
| Mode M0 | |||
|---|---|---|---|
| Quadrant | BADHDUFLAG | Total packets | Discarded packets |
| A | 0 | 13948 | 3 |
| B | 0 | 21713 | 2 |
| C | 0 | 15952 | 2 |
| D | 0 | 17264 | 2 |
| Mode M9 | |||
|---|---|---|---|
| Quadrant | BADHDUFLAG | Total packets | Discarded packets |
| A | 0 | 11 | 0 |
| B | 0 | 12 | 0 |
| C | 0 | 12 | 0 |
| D | 0 | 12 | 0 |
| Quadrant | Total seconds | Saturated seconds | Saturation percentage |
|---|---|---|---|
| A | 6851 | 16 | 0.233543% |
| B | 6851 | 198 | 2.890089% |
| C | 6851 | 174 | 2.539775% |
| D | 6851 | 247 | 3.605313% |
Noise dominated data is calculated using 1-second bins in cleaned event files. If a bin has >2000 counts, and if more than 50% of those come from <1% of pixels, then it is considered to be noise-dominated and hence unusable.
| Quadrant | # 1 sec bins | Bins with >0 counts | Bins with >2000 counts | High rate bins dominated by noise | Noise dominated (total time) | Noise dominated (detector-on time) | Marked lightcurve |
|---|---|---|---|---|---|---|---|
| A | 7806 | 6852 | 0 | 0 | 0.00% | 0.00% |  |
| B | 7806 | 6851 | 110 | 110 | 1.41% | 1.61% | 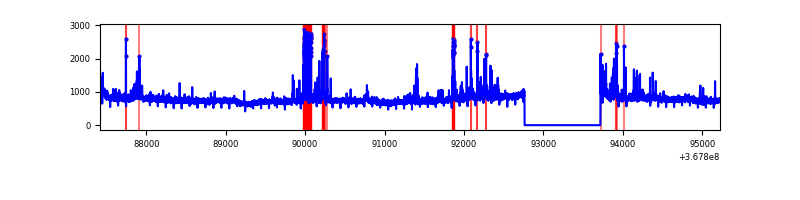 |
| C | 7806 | 6851 | 42 | 42 | 0.54% | 0.61% |  |
| D | 7806 | 6852 | 214 | 214 | 2.74% | 3.12% | 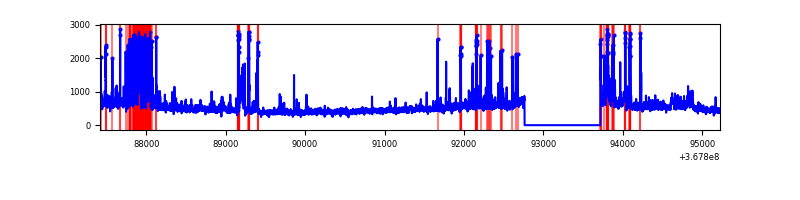 |
Top three noisy pixels from each quadrant. If the there are fewer than three noisy pixels in the level2.evt file, extra rows are filled as -1
| Pixel properties | Quadrant properties | ||||||
|---|---|---|---|---|---|---|---|
| Quadrant | DetID | PixID | Counts | Sigma | Mean | Median | Sigma |
| A | 13 | 6 | 14357 | 83.03 | 815 | 797 | 163.3 |
| A | 13 | 254 | 11744 | 67.03 | 815 | 797 | 163.3 |
| A | 3 | 137 | 8198 | 45.31 | 815 | 797 | 163.3 |
| B | 6 | 159 | 1940068 | 12607.55 | 806 | 786 | 153.8 |
| B | 10 | 245 | 363810 | 2360.07 | 806 | 786 | 153.8 |
| B | 5 | 172 | 38611 | 245.91 | 806 | 786 | 153.8 |
| C | 3 | 233 | 442139 | 2416.09 | 780 | 784 | 182.7 |
| C | 0 | 10 | 190428 | 1038.16 | 780 | 784 | 182.7 |
| C | 14 | 238 | 128606 | 699.73 | 780 | 784 | 182.7 |
| D | 13 | 249 | 495053 | 2664.47 | 777 | 756 | 185.5 |
| D | 8 | 195 | 383019 | 2060.56 | 777 | 756 | 185.5 |
| D | 12 | 218 | 201774 | 1083.57 | 777 | 756 | 185.5 |
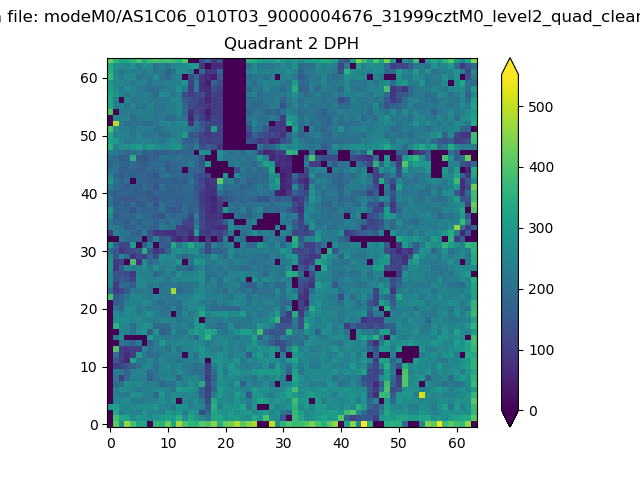
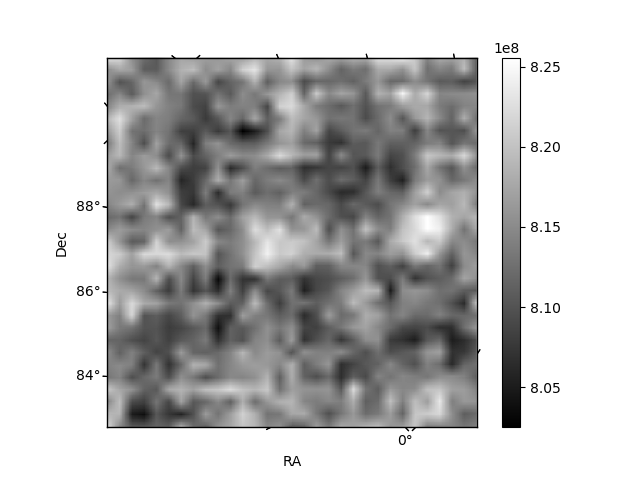
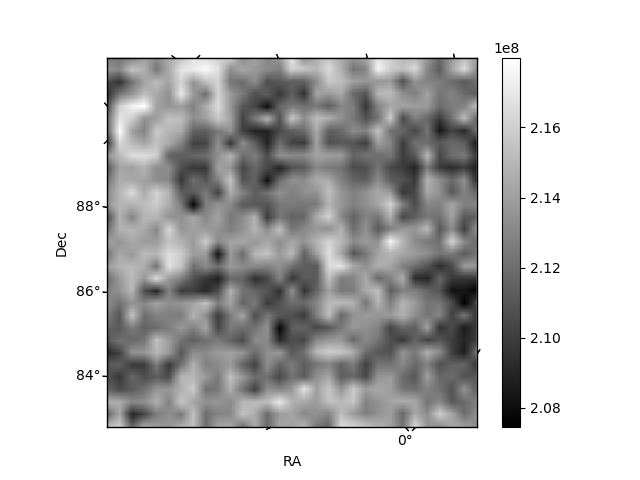
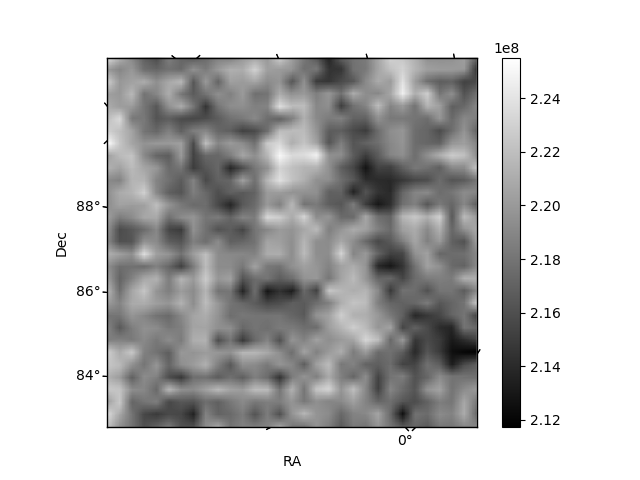
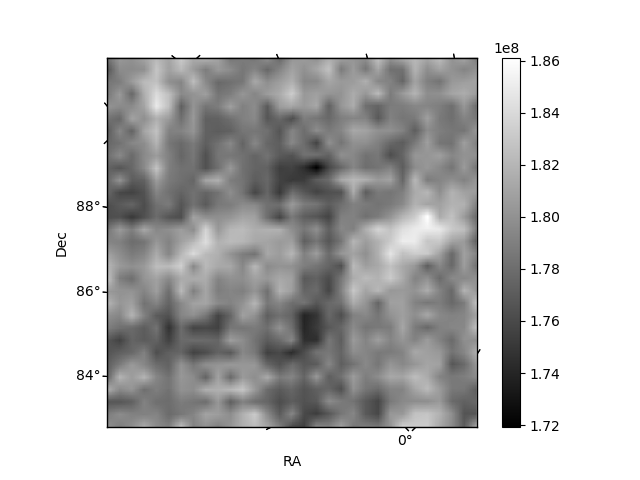
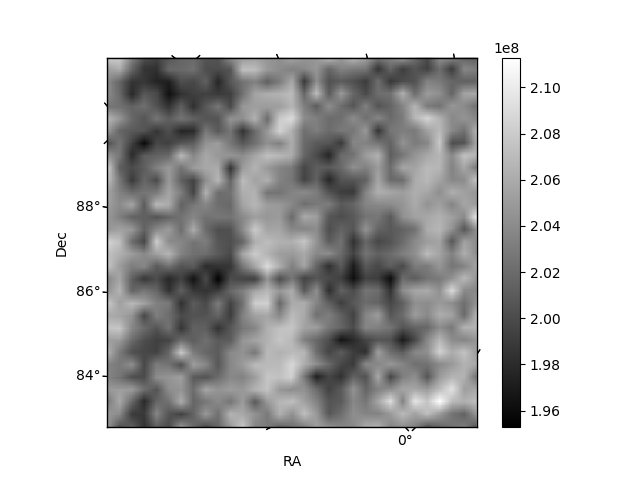
Histogram calculated using DETX and DETY for each event in the final _common_clean file
| Quadrant A | 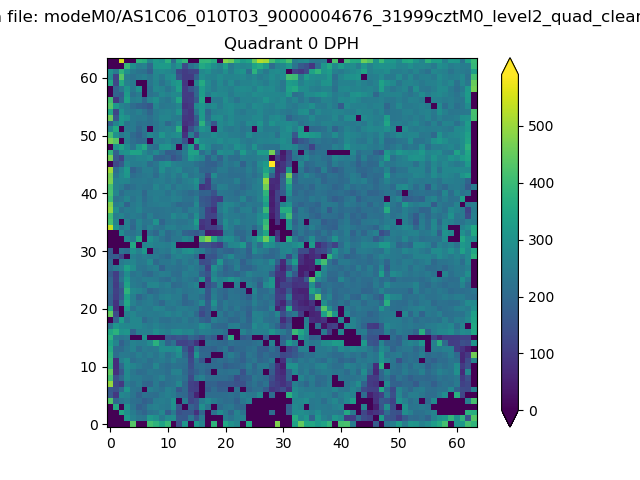 |
 |
Quadrant B |
|---|---|---|---|
| Quadrant D |  |
 |
Quadrant C |
| Plot type | Count rate plots | Images |
|---|---|---|
| Comparison with Poisson distribution Blue bars denote a histogram of data divided into 1 sec bins. Red curve is a Poisson curve with rate = median count rate of data. |
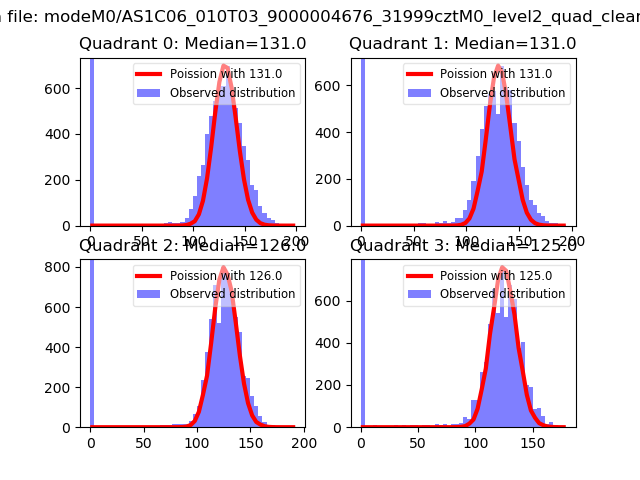 |
 |
| Quadrant-wise count rates Data is divided into 100 sec bins |
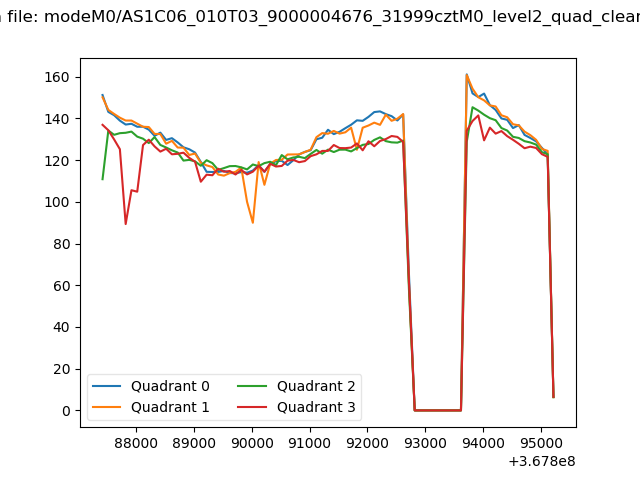 |
|
| Module-wise count rates for Quadrant A Data is divided into 100 sec bins |
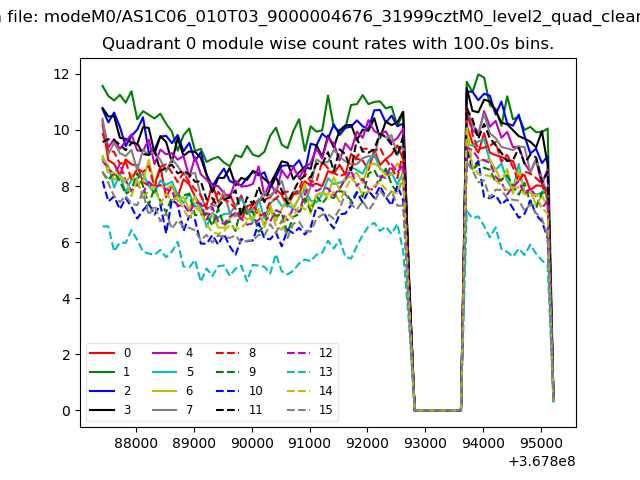 |
 |
| Module-wise count rates for Quadrant B Data is divided into 100 sec bins |
 |
 |
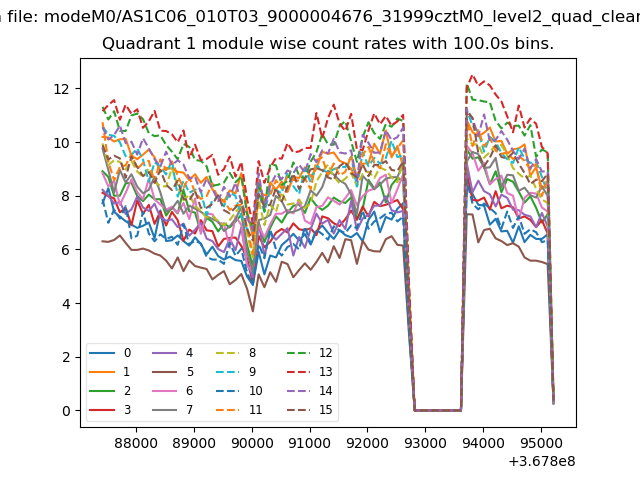
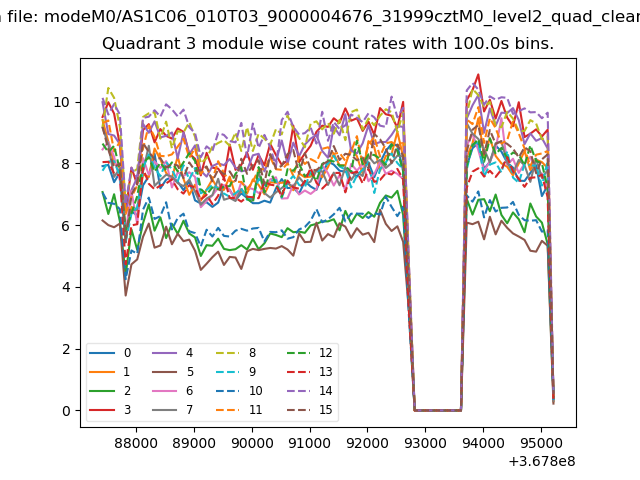
| Module-wise count rates for Quadrant C Data is divided into 100 sec bins |
 |
 |
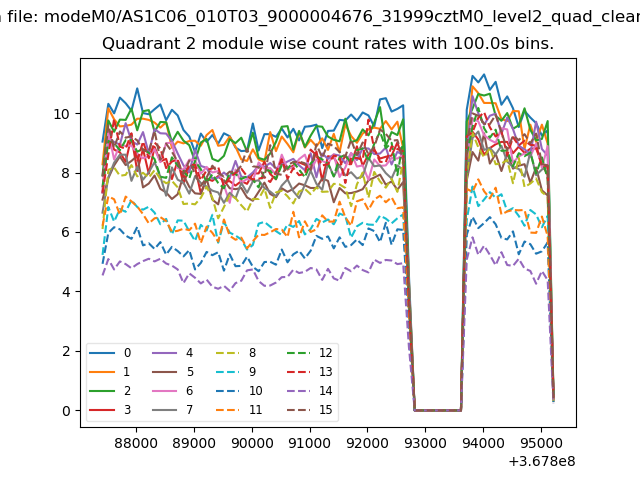
| Module-wise count rates for Quadrant D Data is divided into 100 sec bins |
 |
 |
| Parameter | Plot |
|---|---|
| CZT HV Monitor | 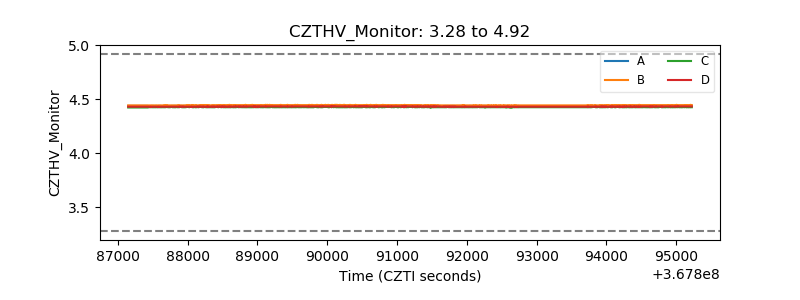 |
| D_VDD | 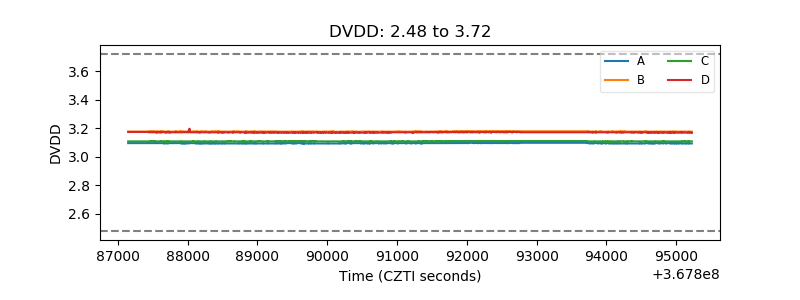 |
| Temperature 1 | 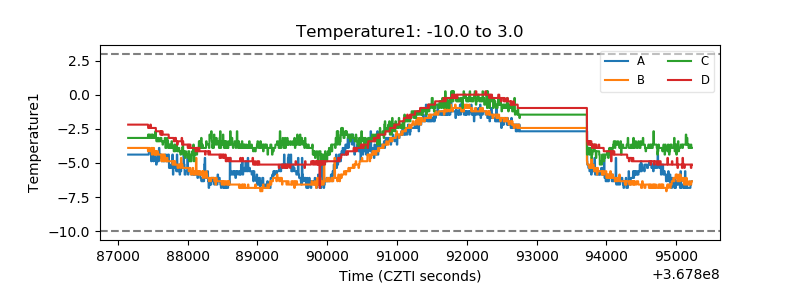 |
| Veto HV Monitor | 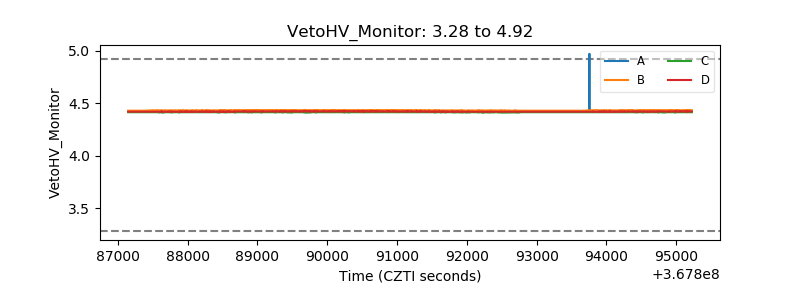 |
| Veto LLD | 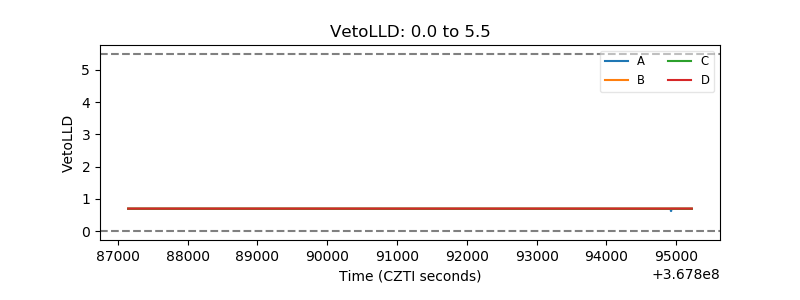 |
| Alpha Counter | 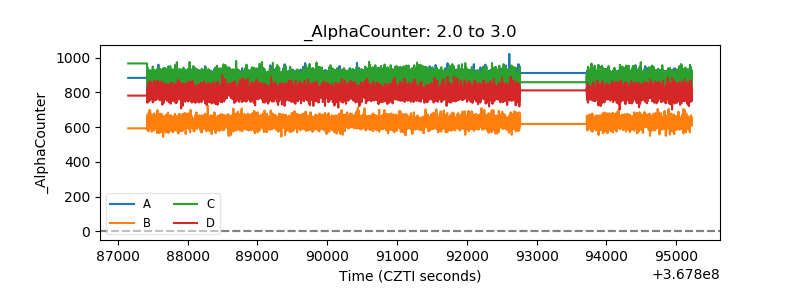 |
| _CPM_Rate | 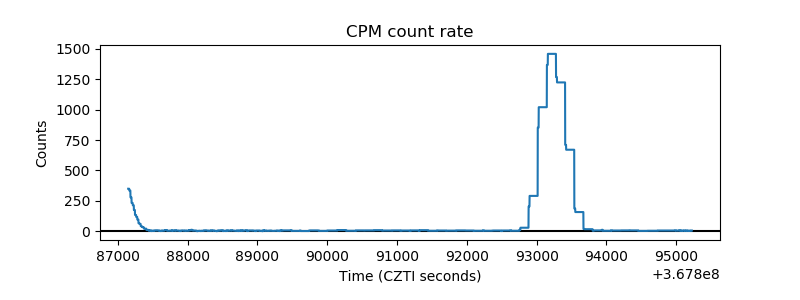 |
| CZT Counter |  |
| +2.5 Volts monitor |  |
| +5 Volts monitor |  |
| _ROLL_ROT | 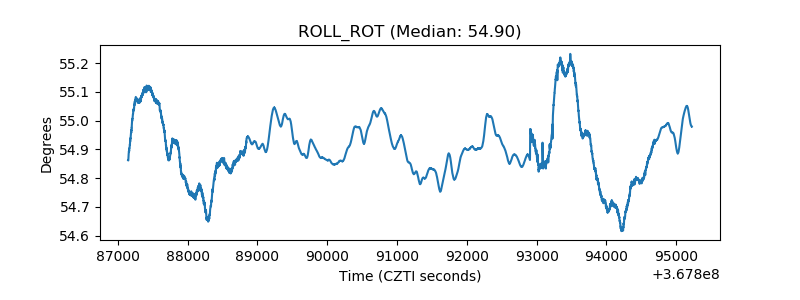 |
| _Roll_DEC | 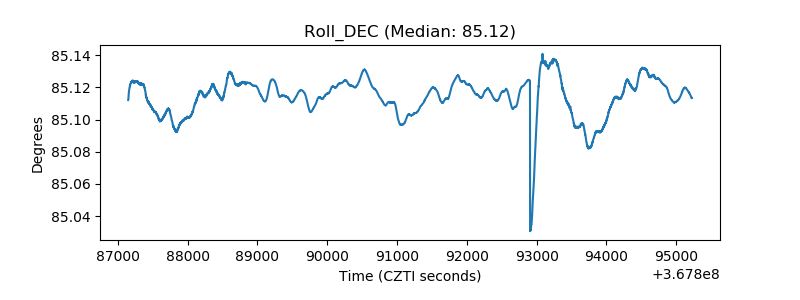 |
| _Roll_RA | 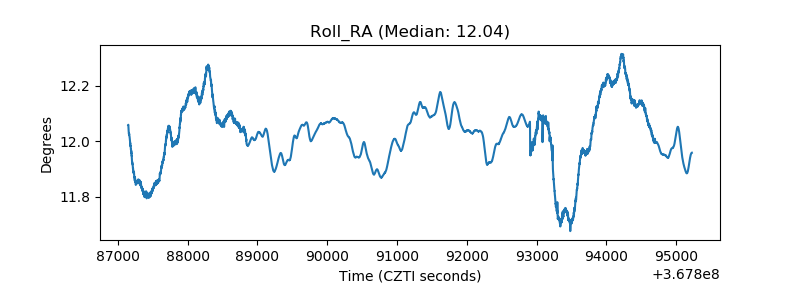 |
| Veto Counter | 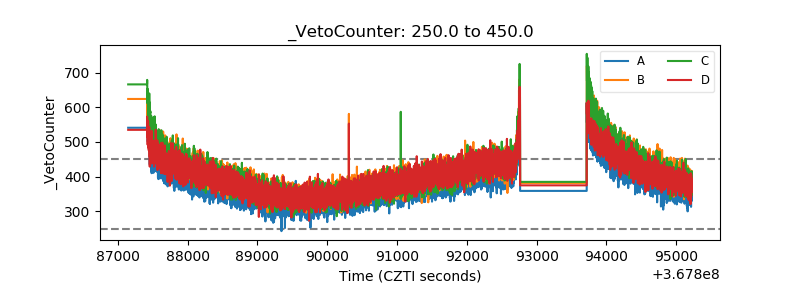 |