| Param | Original file | Final file |
|---|---|---|
| Filename | modeM0/AS1C06_010T03_9000004676_32000cztM0_level2.evt | modeM0/AS1C06_010T03_9000004676_32000cztM0_level2_quad_clean.evt |
| Size (bytes) | 545,034,240 | 123,744,960 |
| Size | 519.8 MB | 118.0 MB |
| Events in quadrant A | 2,927,011 | 850,682 |
| Events in quadrant B | 4,919,334 | 853,645 |
| Events in quadrant C | 4,571,094 | 801,477 |
| Events in quadrant D | 3,661,946 | 802,059 |
| Mode SS | |||
|---|---|---|---|
| Quadrant | BADHDUFLAG | Total packets | Discarded packets |
| A | 0 | 128 | 0 |
| B | 0 | 128 | 0 |
| C | 0 | 128 | 0 |
| D | 0 | 128 | 0 |
| Mode M0 | |||
|---|---|---|---|
| Quadrant | BADHDUFLAG | Total packets | Discarded packets |
| A | 0 | 12856 | 1 |
| B | 0 | 19378 | 1 |
| C | 0 | 17764 | 1 |
| D | 0 | 15112 | 1 |
| Mode M9 | |||
|---|---|---|---|
| Quadrant | BADHDUFLAG | Total packets | Discarded packets |
| A | 0 | 11 | 0 |
| B | 0 | 11 | 0 |
| C | 0 | 11 | 0 |
| D | 0 | 11 | 0 |
| Quadrant | Total seconds | Saturated seconds | Saturation percentage |
|---|---|---|---|
| A | 6304 | 18 | 0.285533% |
| B | 6305 | 110 | 1.744647% |
| C | 6305 | 389 | 6.169707% |
| D | 6305 | 113 | 1.792228% |
Noise dominated data is calculated using 1-second bins in cleaned event files. If a bin has >2000 counts, and if more than 50% of those come from <1% of pixels, then it is considered to be noise-dominated and hence unusable.
| Quadrant | # 1 sec bins | Bins with >0 counts | Bins with >2000 counts | High rate bins dominated by noise | Noise dominated (total time) | Noise dominated (detector-on time) | Marked lightcurve |
|---|---|---|---|---|---|---|---|
| A | 7384 | 6304 | 0 | 0 | 0.00% | 0.00% | 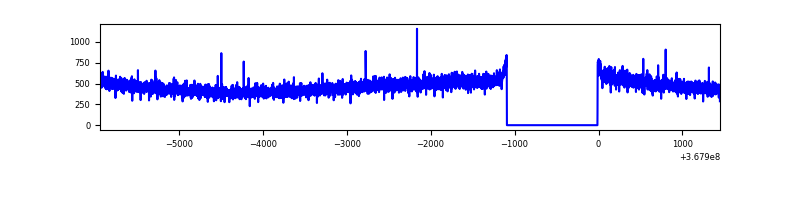 |
| B | 7385 | 6305 | 29 | 29 | 0.39% | 0.46% | 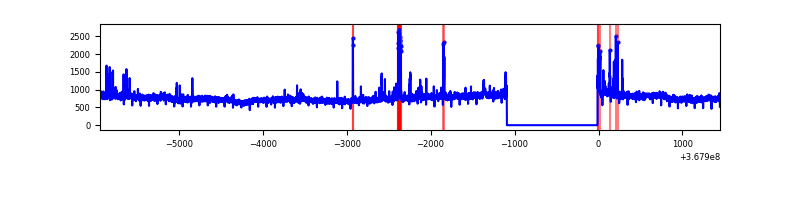 |
| C | 7385 | 6305 | 52 | 52 | 0.70% | 0.82% | 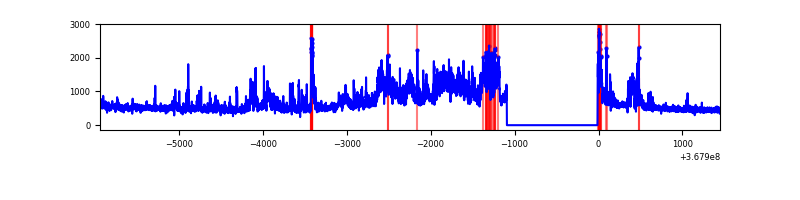 |
| D | 7385 | 6306 | 78 | 78 | 1.06% | 1.24% | 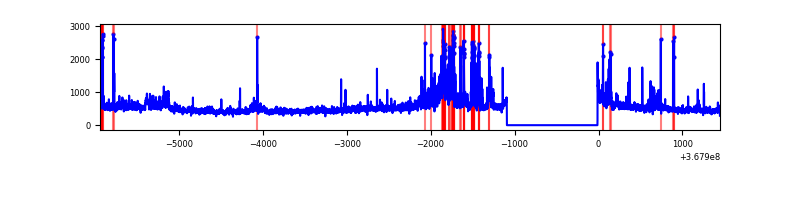 |
Top three noisy pixels from each quadrant. If the there are fewer than three noisy pixels in the level2.evt file, extra rows are filled as -1
| Pixel properties | Quadrant properties | ||||||
|---|---|---|---|---|---|---|---|
| Quadrant | DetID | PixID | Counts | Sigma | Mean | Median | Sigma |
| A | 13 | 254 | 11540 | 71.77 | 756 | 742 | 150.4 |
| A | 13 | 6 | 7625 | 45.75 | 756 | 742 | 150.4 |
| A | 3 | 137 | 7469 | 44.71 | 756 | 742 | 150.4 |
| B | 6 | 159 | 1776451 | 12614.0 | 748 | 728 | 140.8 |
| B | 10 | 245 | 92259 | 650.2 | 748 | 728 | 140.8 |
| B | 0 | 190 | 70496 | 495.6 | 748 | 728 | 140.8 |
| C | 3 | 233 | 1280184 | 7654.64 | 712 | 717 | 167.1 |
| C | 0 | 10 | 301593 | 1800.04 | 712 | 717 | 167.1 |
| C | 14 | 238 | 133457 | 794.14 | 712 | 717 | 167.1 |
| D | 8 | 195 | 455596 | 2687.69 | 721 | 702 | 169.3 |
| D | 13 | 249 | 149993 | 882.07 | 721 | 702 | 169.3 |
| D | 2 | 250 | 113843 | 668.48 | 721 | 702 | 169.3 |
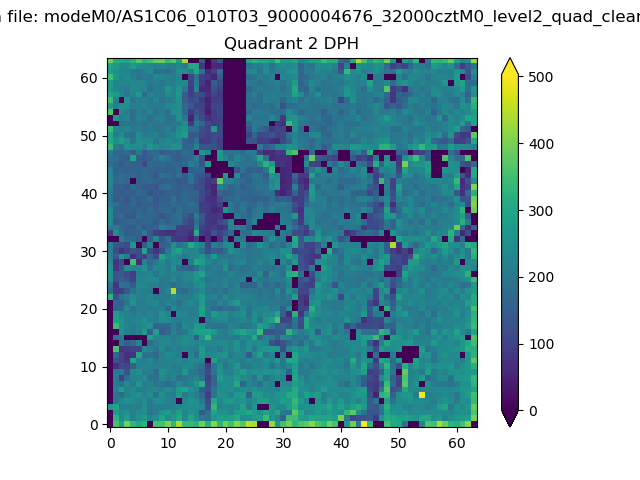
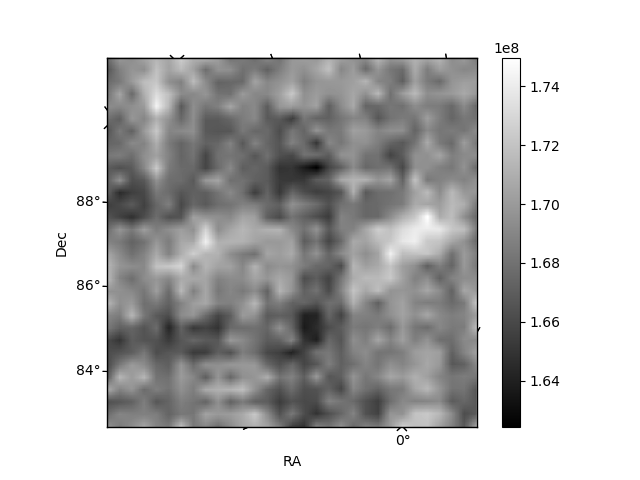
Histogram calculated using DETX and DETY for each event in the final _common_clean file
| Quadrant A | 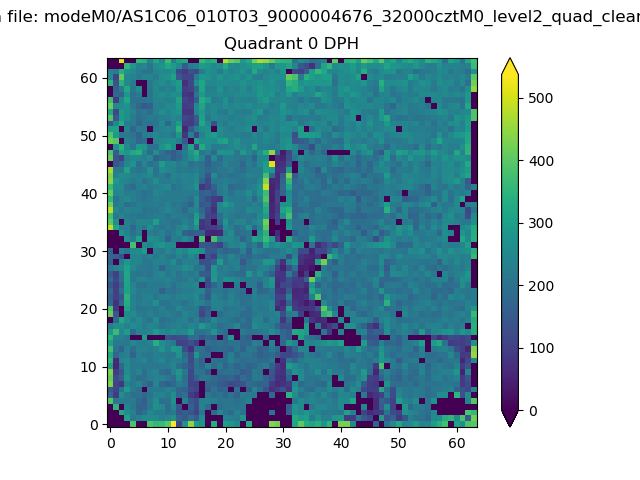 |
 |
Quadrant B |
|---|---|---|---|
| Quadrant D |  |
 |
Quadrant C |
| Plot type | Count rate plots | Images |
|---|---|---|
| Comparison with Poisson distribution Blue bars denote a histogram of data divided into 1 sec bins. Red curve is a Poisson curve with rate = median count rate of data. |
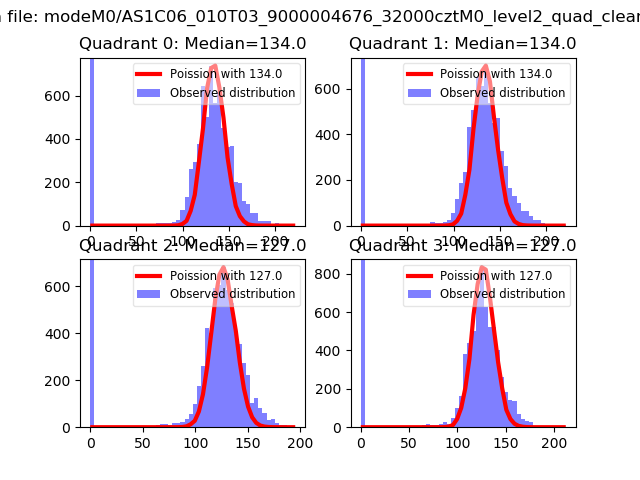 |
 |
| Quadrant-wise count rates Data is divided into 100 sec bins |
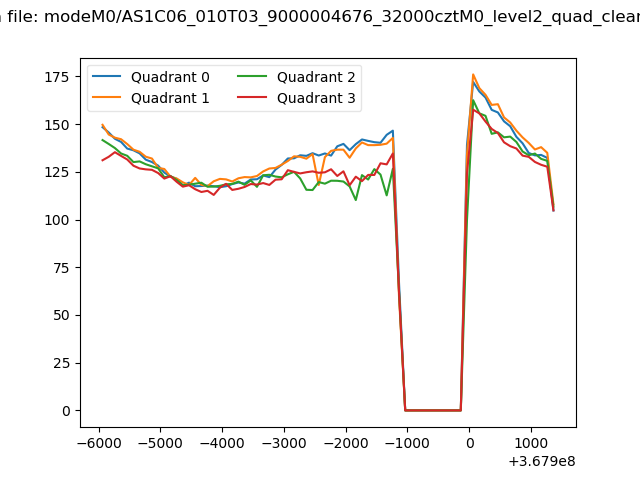 |
|
| Module-wise count rates for Quadrant A Data is divided into 100 sec bins |
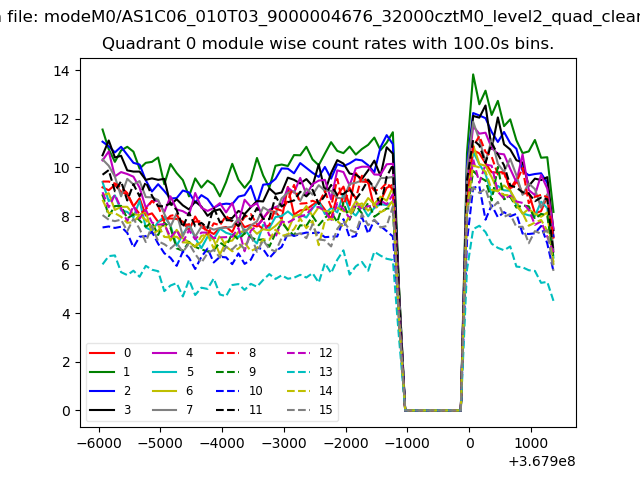 |
 |
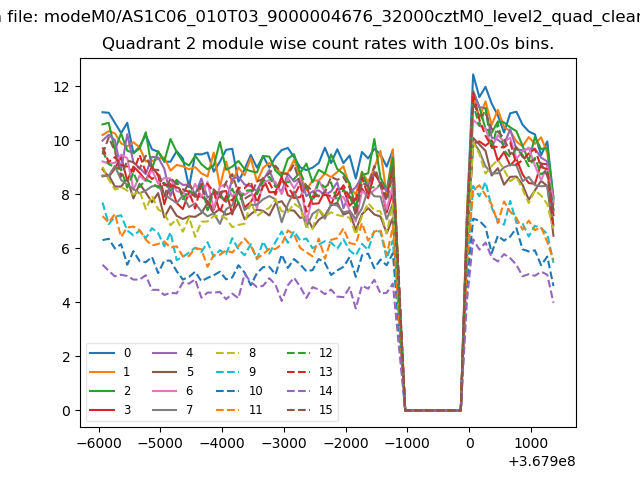
| Module-wise count rates for Quadrant B Data is divided into 100 sec bins |
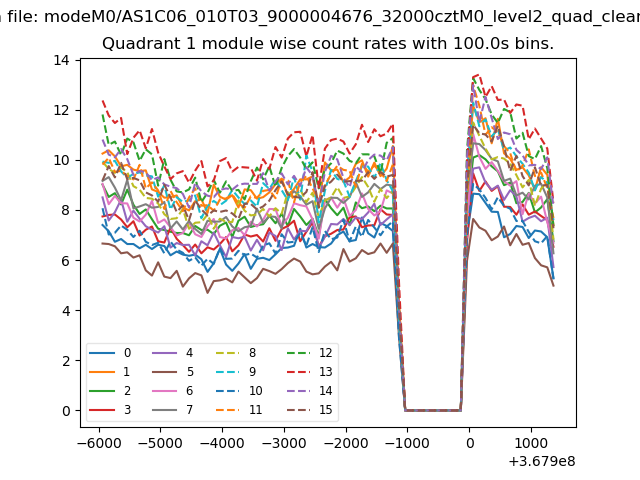 |
 |
| Module-wise count rates for Quadrant C Data is divided into 100 sec bins |
 |
 |
| Module-wise count rates for Quadrant D Data is divided into 100 sec bins |
 |
 |
| Parameter | Plot |
|---|---|
| CZT HV Monitor | 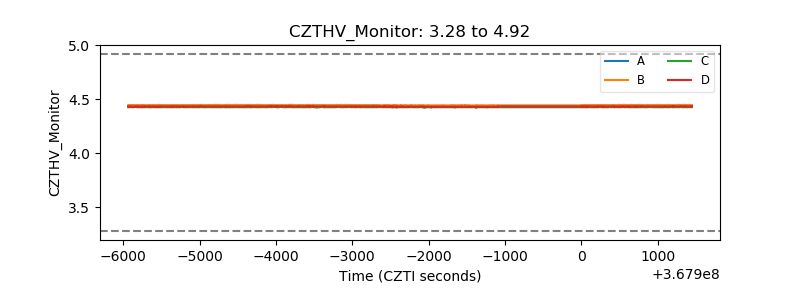 |
| D_VDD | 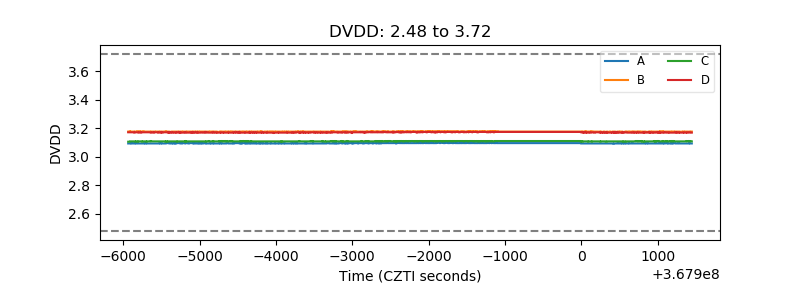 |
| Temperature 1 | 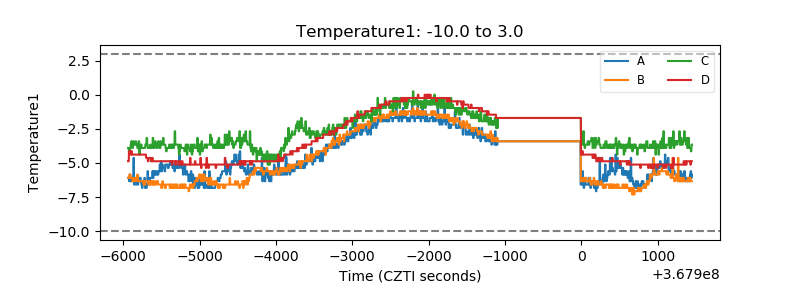 |
| Veto HV Monitor | 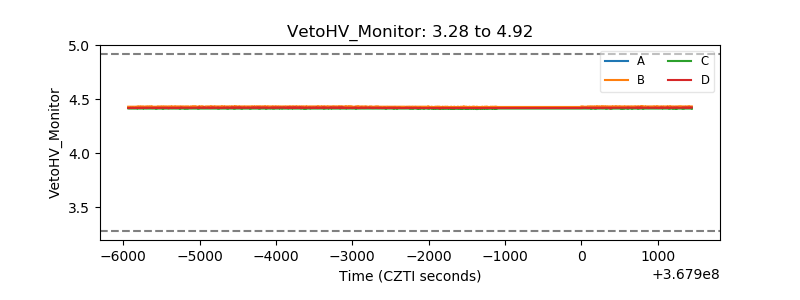 |
| Veto LLD | 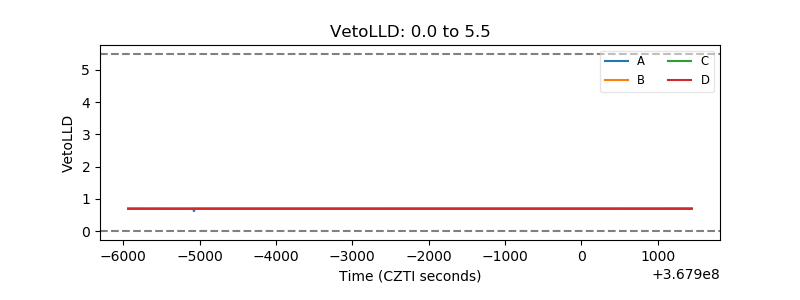 |
| Alpha Counter | 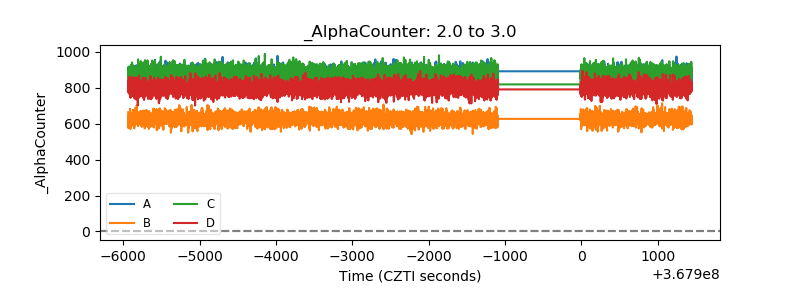 |
| _CPM_Rate | 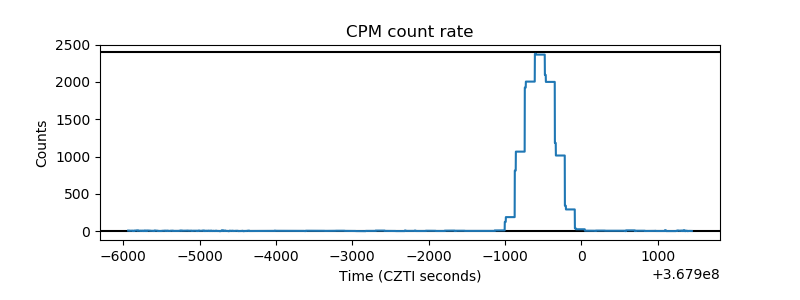 |
| CZT Counter | 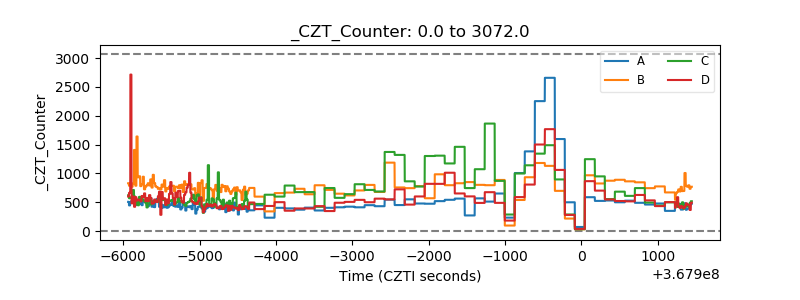 |
| +2.5 Volts monitor |  |
| +5 Volts monitor |  |
| _ROLL_ROT | 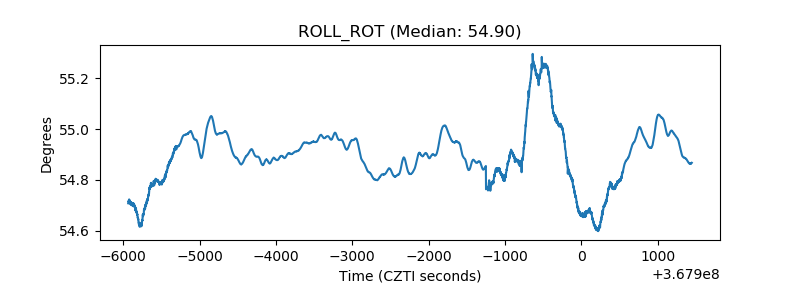 |
| _Roll_DEC | 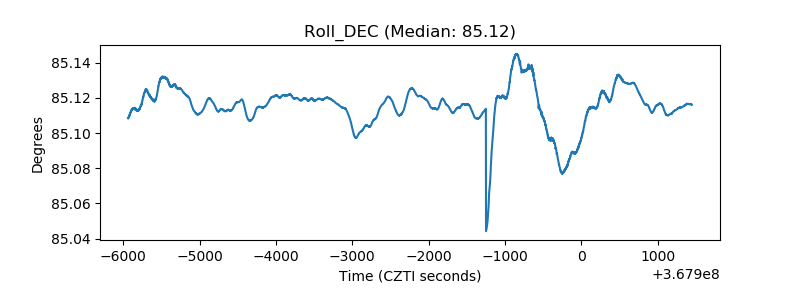 |
| _Roll_RA | 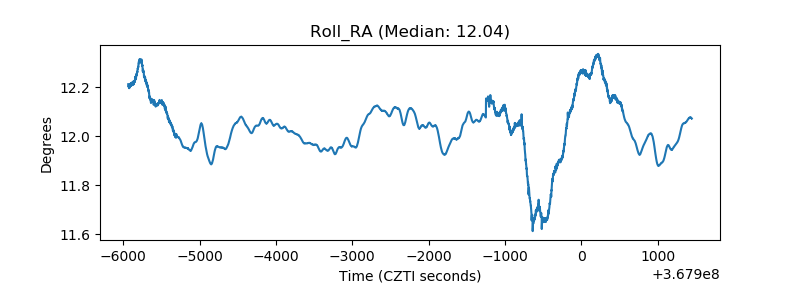 |
| Veto Counter | 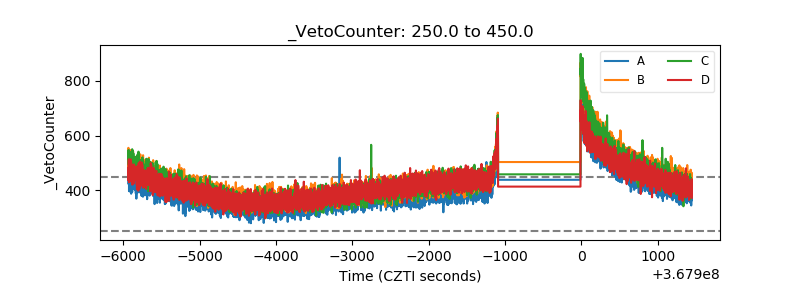 |