| Param | Original file | Final file |
|---|---|---|
| Filename | modeM0/AS1C06_010T03_9000004676_32002cztM0_level2.evt | modeM0/AS1C06_010T03_9000004676_32002cztM0_level2_quad_clean.evt |
| Size (bytes) | 463,619,520 | 118,820,160 |
| Size | 442.1 MB | 113.3 MB |
| Events in quadrant A | 2,767,157 | 821,727 |
| Events in quadrant B | 4,599,200 | 823,114 |
| Events in quadrant C | 3,045,251 | 777,990 |
| Events in quadrant D | 3,234,455 | 769,514 |
| Mode SS | |||
|---|---|---|---|
| Quadrant | BADHDUFLAG | Total packets | Discarded packets |
| A | 0 | 120 | 0 |
| B | 0 | 120 | 0 |
| C | 0 | 120 | 0 |
| D | 0 | 120 | 0 |
| Mode M0 | |||
|---|---|---|---|
| Quadrant | BADHDUFLAG | Total packets | Discarded packets |
| A | 0 | 11959 | 1 |
| B | 0 | 17946 | 1 |
| C | 0 | 12728 | 1 |
| D | 0 | 13472 | 1 |
| Mode M9 | |||
|---|---|---|---|
| Quadrant | BADHDUFLAG | Total packets | Discarded packets |
| A | 0 | 12 | 0 |
| B | 0 | 12 | 0 |
| C | 0 | 12 | 0 |
| D | 0 | 12 | 0 |
| Quadrant | Total seconds | Saturated seconds | Saturation percentage |
|---|---|---|---|
| A | 5810 | 20 | 0.344234% |
| B | 5811 | 107 | 1.841335% |
| C | 5811 | 109 | 1.875753% |
| D | 5811 | 59 | 1.015316% |
Noise dominated data is calculated using 1-second bins in cleaned event files. If a bin has >2000 counts, and if more than 50% of those come from <1% of pixels, then it is considered to be noise-dominated and hence unusable.
| Quadrant | # 1 sec bins | Bins with >0 counts | Bins with >2000 counts | High rate bins dominated by noise | Noise dominated (total time) | Noise dominated (detector-on time) | Marked lightcurve |
|---|---|---|---|---|---|---|---|
| A | 7010 | 5810 | 0 | 0 | 0.00% | 0.00% | 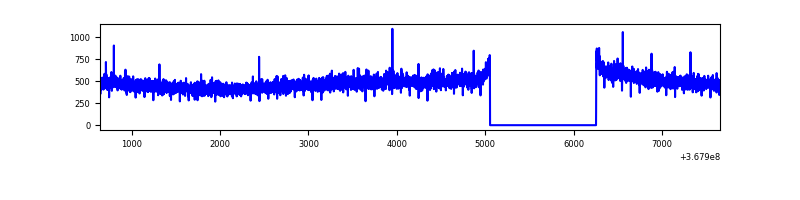 |
| B | 7011 | 5811 | 38 | 38 | 0.54% | 0.65% | 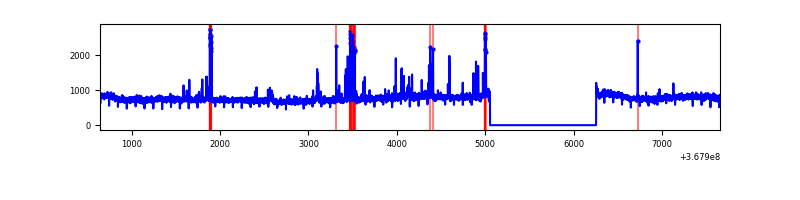 |
| C | 7011 | 5812 | 37 | 37 | 0.53% | 0.64% |  |
| D | 7011 | 5812 | 40 | 40 | 0.57% | 0.69% | 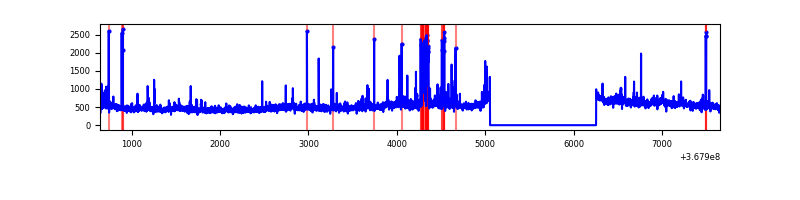 |
Top three noisy pixels from each quadrant. If the there are fewer than three noisy pixels in the level2.evt file, extra rows are filled as -1
| Pixel properties | Quadrant properties | ||||||
|---|---|---|---|---|---|---|---|
| Quadrant | DetID | PixID | Counts | Sigma | Mean | Median | Sigma |
| A | 13 | 254 | 10707 | 70.53 | 714 | 701 | 141.9 |
| A | 13 | 6 | 7799 | 50.03 | 714 | 701 | 141.9 |
| A | 3 | 137 | 6601 | 41.59 | 714 | 701 | 141.9 |
| B | 6 | 159 | 1599997 | 12142.9 | 705 | 689 | 131.7 |
| B | 5 | 172 | 97800 | 737.32 | 705 | 689 | 131.7 |
| B | 10 | 245 | 50227 | 376.12 | 705 | 689 | 131.7 |
| C | 3 | 233 | 119076 | 763.85 | 669 | 673 | 155.0 |
| C | 14 | 238 | 117946 | 756.56 | 669 | 673 | 155.0 |
| C | 0 | 10 | 112021 | 718.34 | 669 | 673 | 155.0 |
| D | 8 | 195 | 380674 | 2407.64 | 677 | 659 | 157.8 |
| D | 13 | 249 | 110213 | 694.1 | 677 | 659 | 157.8 |
| D | 12 | 79 | 72517 | 455.27 | 677 | 659 | 157.8 |
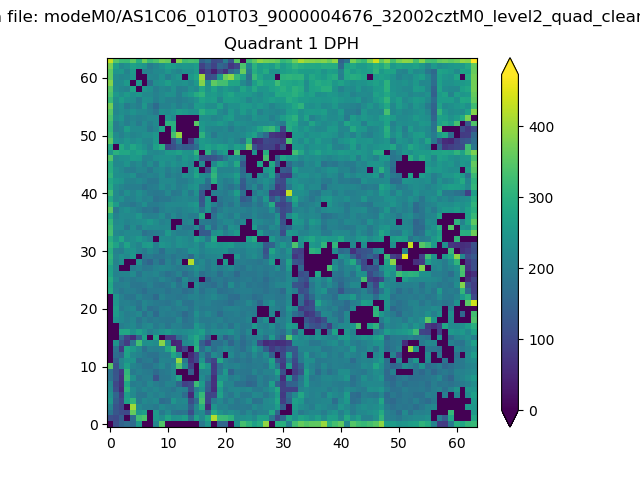
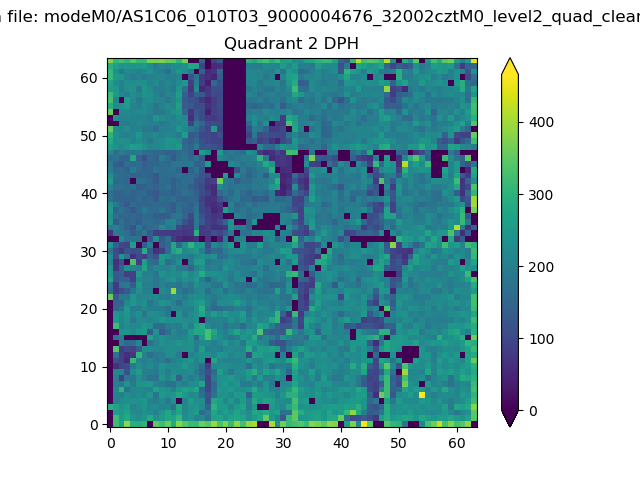
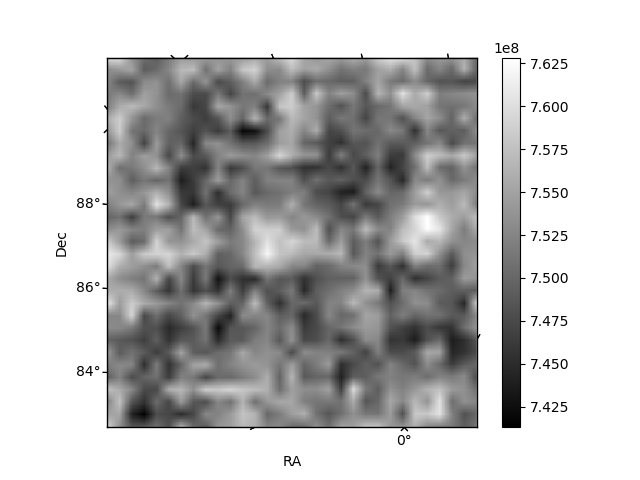
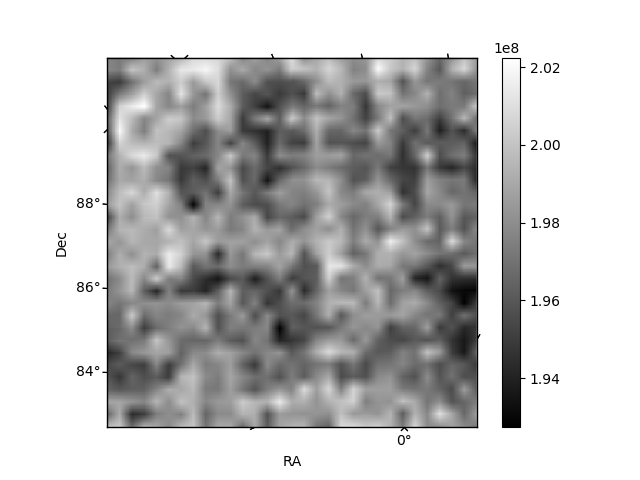
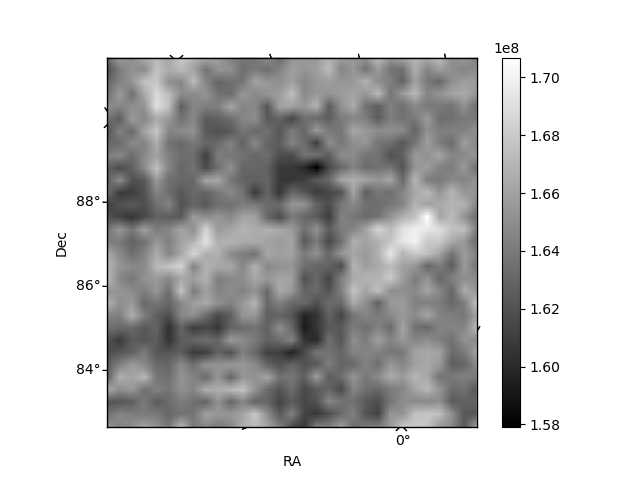
Histogram calculated using DETX and DETY for each event in the final _common_clean file
| Quadrant A | 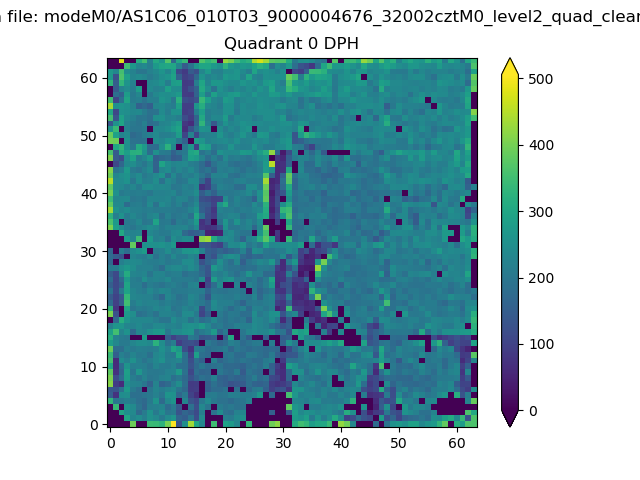 |
 |
Quadrant B |
|---|---|---|---|
| Quadrant D | 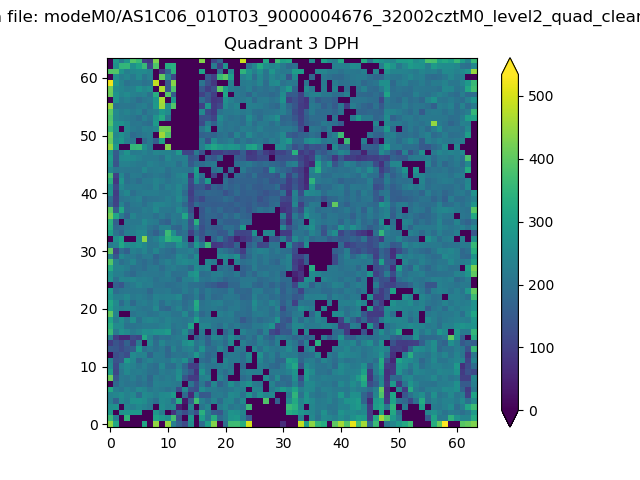 |
 |
Quadrant C |
| Plot type | Count rate plots | Images |
|---|---|---|
| Comparison with Poisson distribution Blue bars denote a histogram of data divided into 1 sec bins. Red curve is a Poisson curve with rate = median count rate of data. |
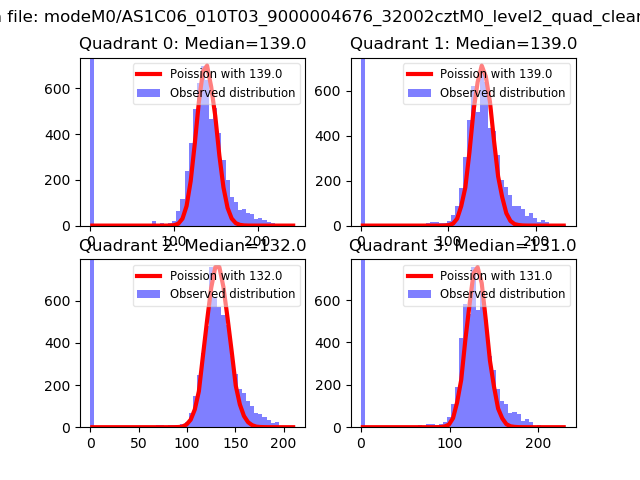 |
 |
| Quadrant-wise count rates Data is divided into 100 sec bins |
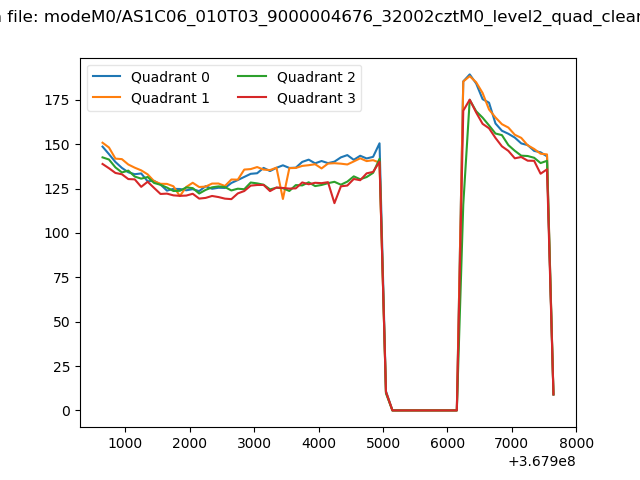 |
|
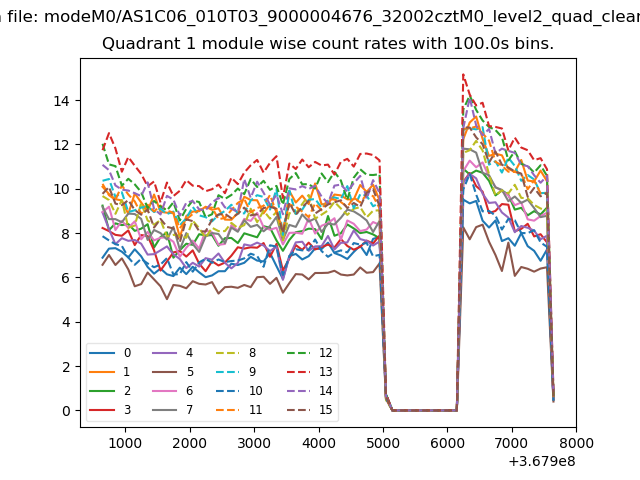
| Module-wise count rates for Quadrant A Data is divided into 100 sec bins |
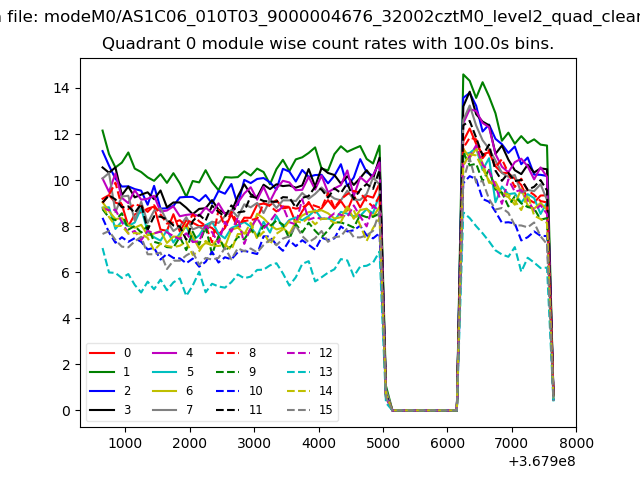 |
 |
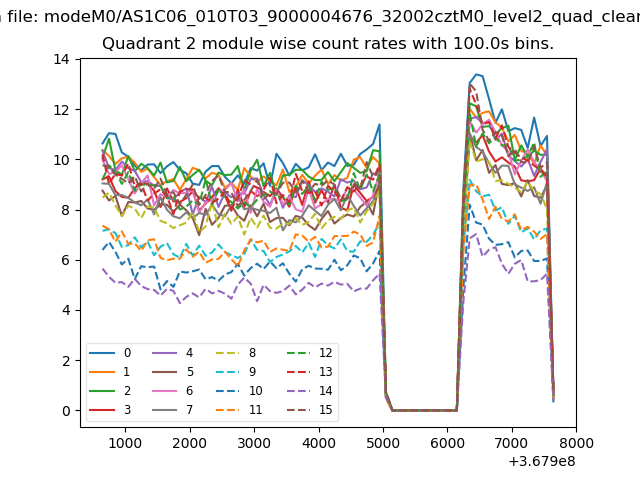
| Module-wise count rates for Quadrant B Data is divided into 100 sec bins |
 |
 |
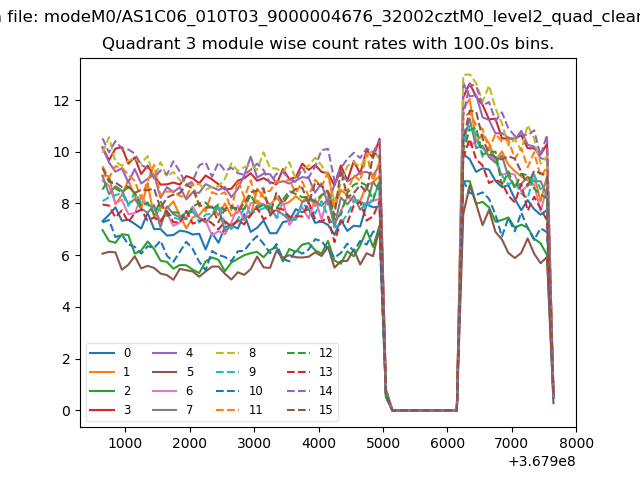
| Module-wise count rates for Quadrant C Data is divided into 100 sec bins |
 |
 |
| Module-wise count rates for Quadrant D Data is divided into 100 sec bins |
 |
 |
| Parameter | Plot |
|---|---|
| CZT HV Monitor | 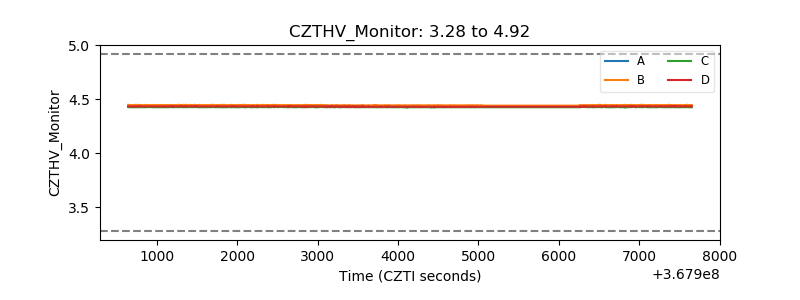 |
| D_VDD | 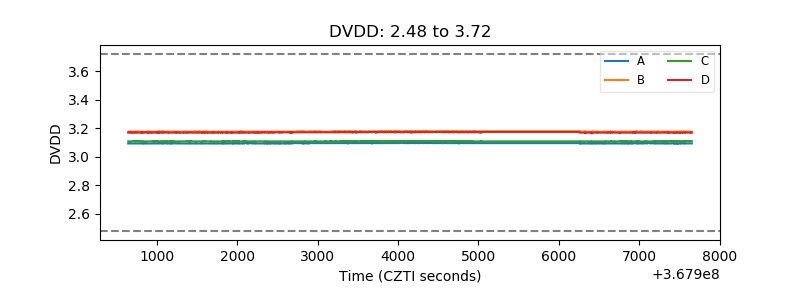 |
| Temperature 1 | 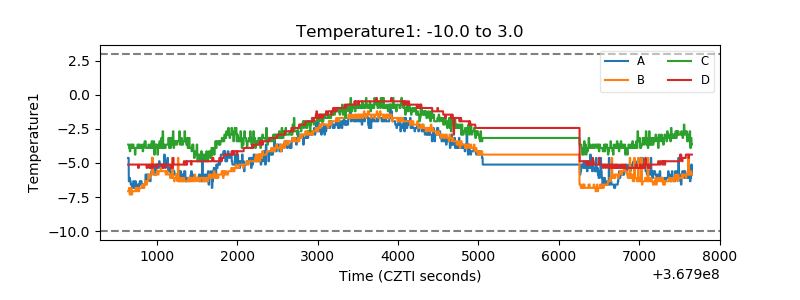 |
| Veto HV Monitor |  |
| Veto LLD | 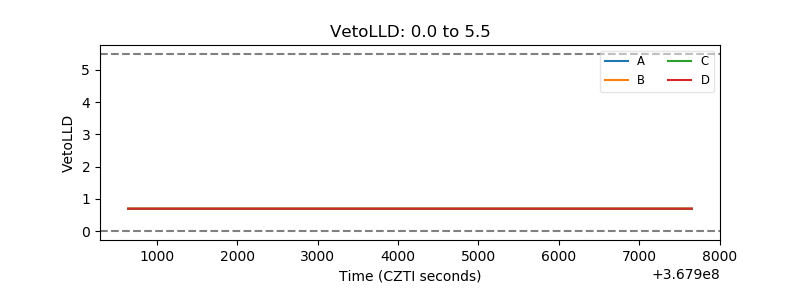 |
| Alpha Counter | 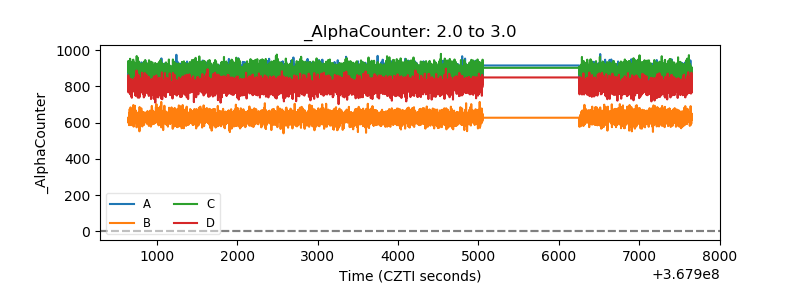 |
| _CPM_Rate | 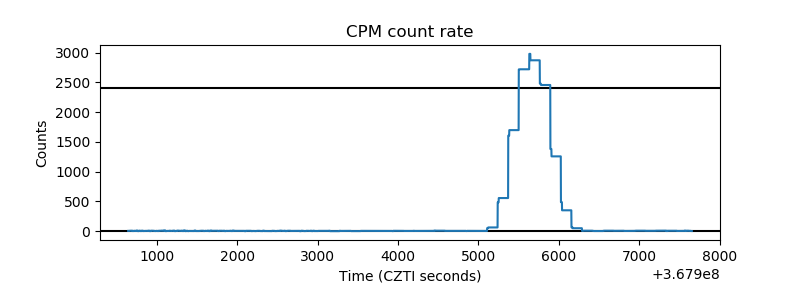 |
| CZT Counter | 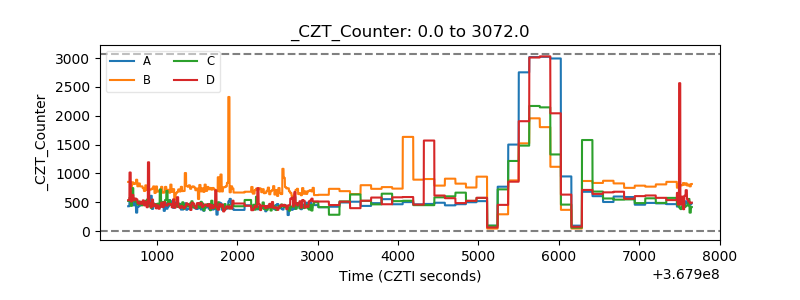 |
| +2.5 Volts monitor |  |
| +5 Volts monitor |  |
| _ROLL_ROT | 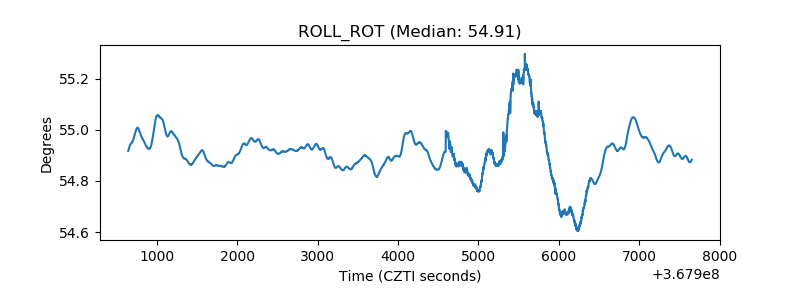 |
| _Roll_DEC | 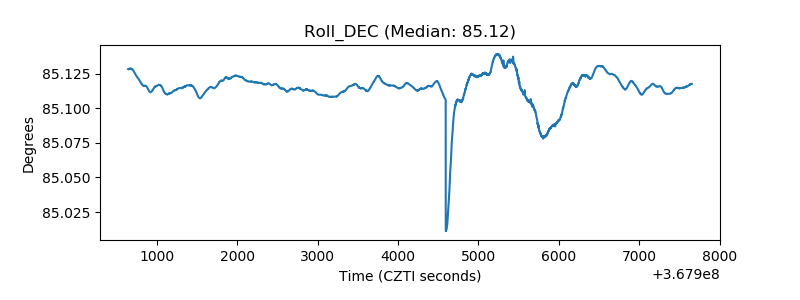 |
| _Roll_RA | 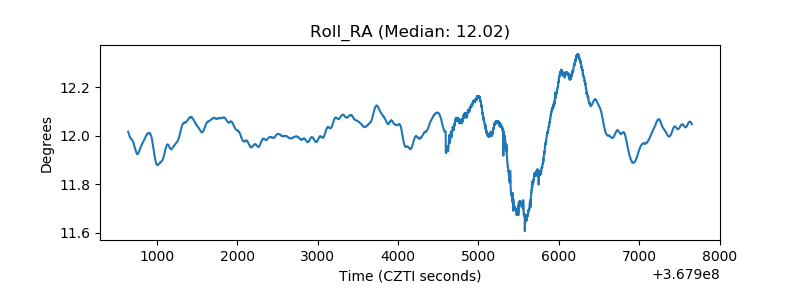 |
| Veto Counter | 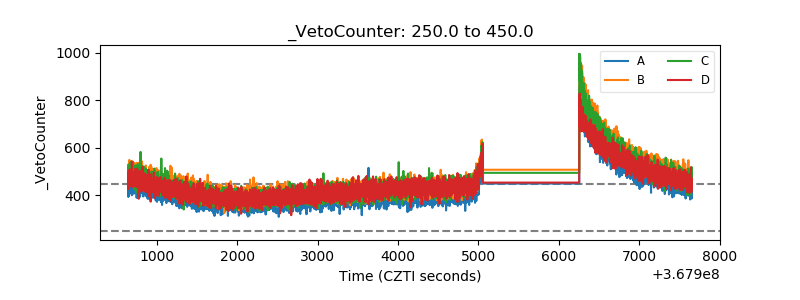 |