| Param | Original file | Final file |
|---|---|---|
| Filename | modeM0/AS1C06_010T03_9000004676_32003cztM0_level2.evt | modeM0/AS1C06_010T03_9000004676_32003cztM0_level2_quad_clean.evt |
| Size (bytes) | 536,420,160 | 136,304,640 |
| Size | 511.6 MB | 130.0 MB |
| Events in quadrant A | 3,171,319 | 961,681 |
| Events in quadrant B | 5,094,315 | 957,626 |
| Events in quadrant C | 3,500,825 | 891,887 |
| Events in quadrant D | 4,053,554 | 878,854 |
| Mode SS | |||
|---|---|---|---|
| Quadrant | BADHDUFLAG | Total packets | Discarded packets |
| A | 0 | 126 | 0 |
| B | 0 | 126 | 0 |
| C | 0 | 126 | 0 |
| D | 0 | 126 | 0 |
| Mode M0 | |||
|---|---|---|---|
| Quadrant | BADHDUFLAG | Total packets | Discarded packets |
| A | 0 | 13230 | 2 |
| B | 0 | 19463 | 2 |
| C | 0 | 14378 | 2 |
| D | 0 | 16165 | 2 |
| Mode M9 | |||
|---|---|---|---|
| Quadrant | BADHDUFLAG | Total packets | Discarded packets |
| A | 0 | 16 | 0 |
| B | 0 | 17 | 0 |
| C | 0 | 17 | 0 |
| D | 0 | 17 | 0 |
| Quadrant | Total seconds | Saturated seconds | Saturation percentage |
|---|---|---|---|
| A | 6287 | 21 | 0.334023% |
| B | 6287 | 122 | 1.940512% |
| C | 6287 | 158 | 2.513122% |
| D | 6287 | 174 | 2.767616% |
Noise dominated data is calculated using 1-second bins in cleaned event files. If a bin has >2000 counts, and if more than 50% of those come from <1% of pixels, then it is considered to be noise-dominated and hence unusable.
| Quadrant | # 1 sec bins | Bins with >0 counts | Bins with >2000 counts | High rate bins dominated by noise | Noise dominated (total time) | Noise dominated (detector-on time) | Marked lightcurve |
|---|---|---|---|---|---|---|---|
| A | 7567 | 6287 | 0 | 0 | 0.00% | 0.00% | 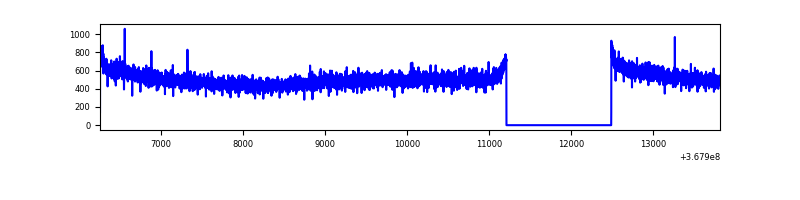 |
| B | 7567 | 6287 | 33 | 33 | 0.44% | 0.52% | 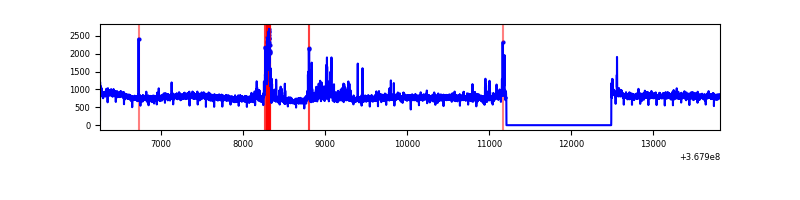 |
| C | 7567 | 6287 | 55 | 55 | 0.73% | 0.87% | 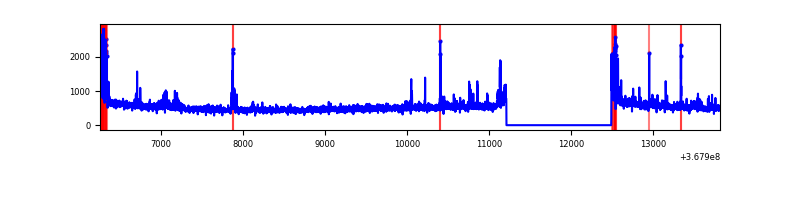 |
| D | 7567 | 6287 | 146 | 146 | 1.93% | 2.32% | 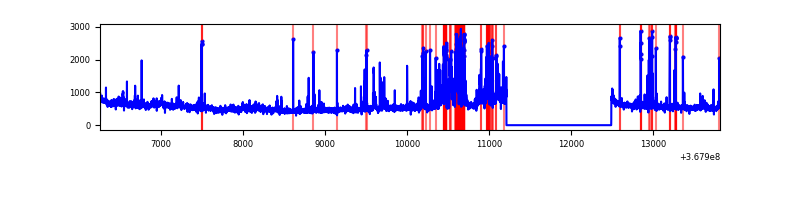 |
Top three noisy pixels from each quadrant. If the there are fewer than three noisy pixels in the level2.evt file, extra rows are filled as -1
| Pixel properties | Quadrant properties | ||||||
|---|---|---|---|---|---|---|---|
| Quadrant | DetID | PixID | Counts | Sigma | Mean | Median | Sigma |
| A | 13 | 6 | 11888 | 69.09 | 816 | 803 | 160.4 |
| A | 13 | 254 | 11196 | 64.78 | 816 | 803 | 160.4 |
| A | 14 | 238 | 7930 | 44.42 | 816 | 803 | 160.4 |
| B | 6 | 159 | 1685518 | 11509.64 | 801 | 784 | 146.4 |
| B | 10 | 245 | 117843 | 799.72 | 801 | 784 | 146.4 |
| B | 15 | 33 | 75828 | 512.68 | 801 | 784 | 146.4 |
| C | 0 | 10 | 243325 | 1398.14 | 754 | 759 | 173.5 |
| C | 14 | 238 | 127759 | 732.02 | 754 | 759 | 173.5 |
| C | 3 | 233 | 115282 | 660.11 | 754 | 759 | 173.5 |
| D | 8 | 195 | 488024 | 2750.6 | 765 | 747 | 177.2 |
| D | 13 | 249 | 407477 | 2295.93 | 765 | 747 | 177.2 |
| D | 2 | 250 | 76135 | 425.55 | 765 | 747 | 177.2 |
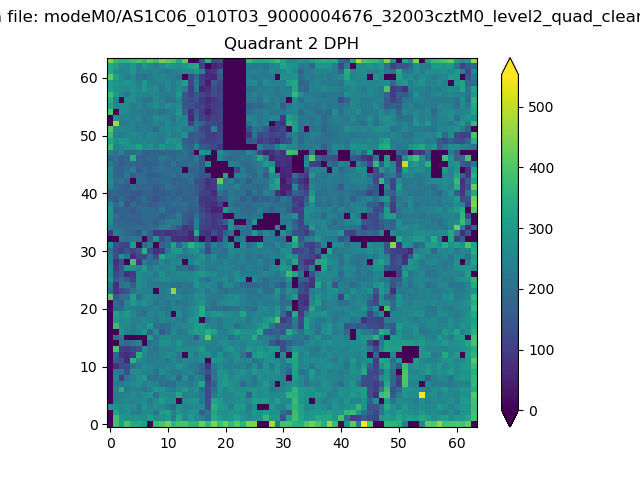
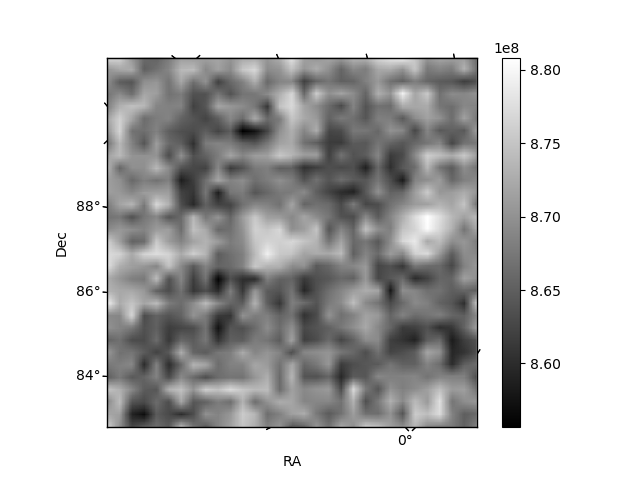
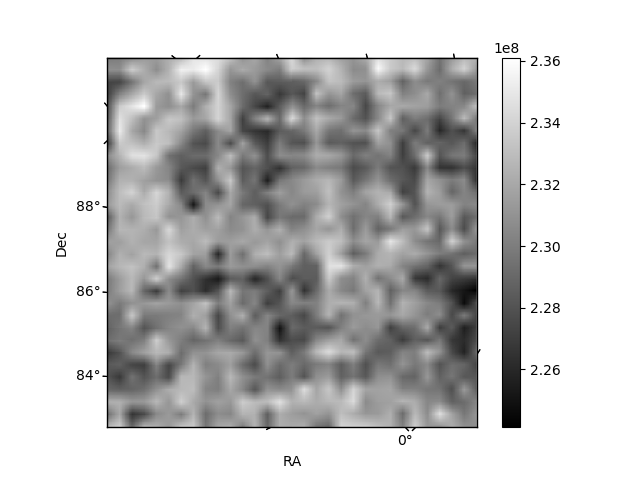
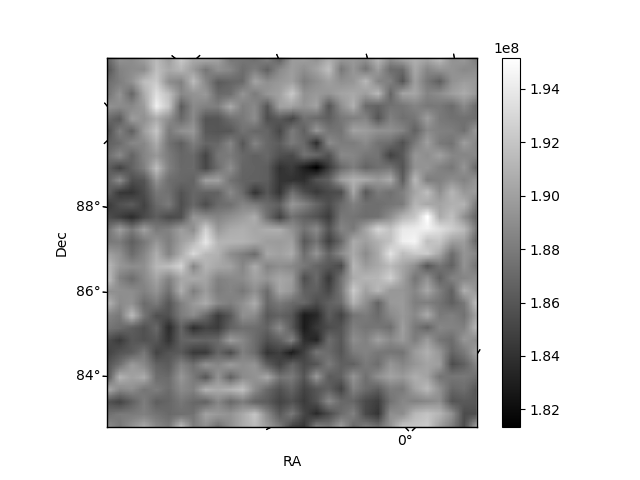
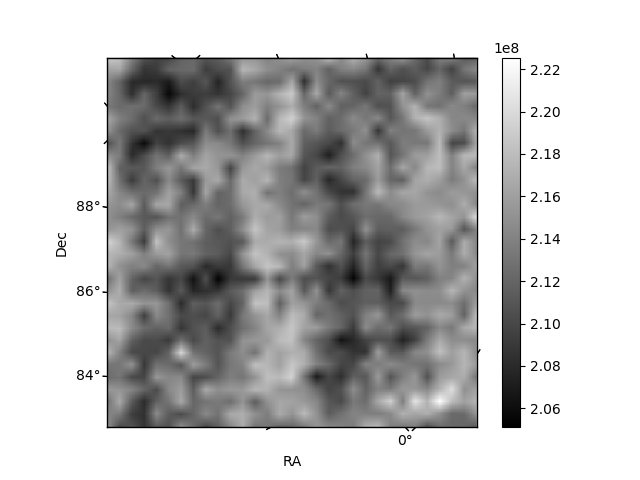
Histogram calculated using DETX and DETY for each event in the final _common_clean file
| Quadrant A | 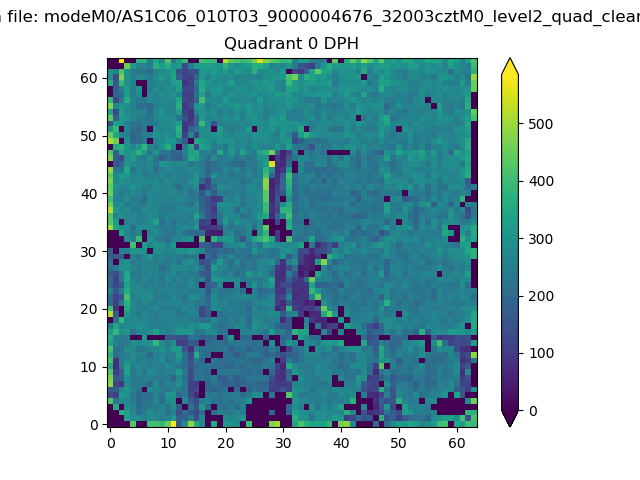 |
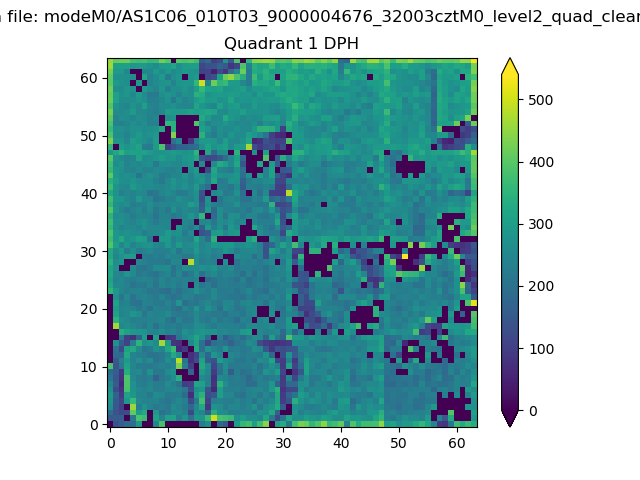 |
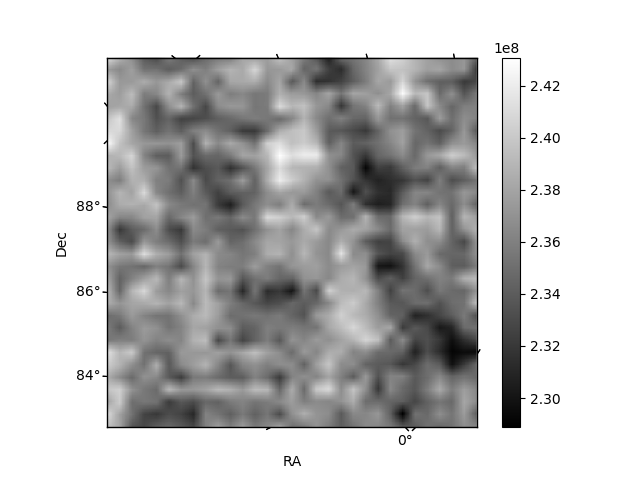
Quadrant B |
|---|---|---|---|
| Quadrant D | 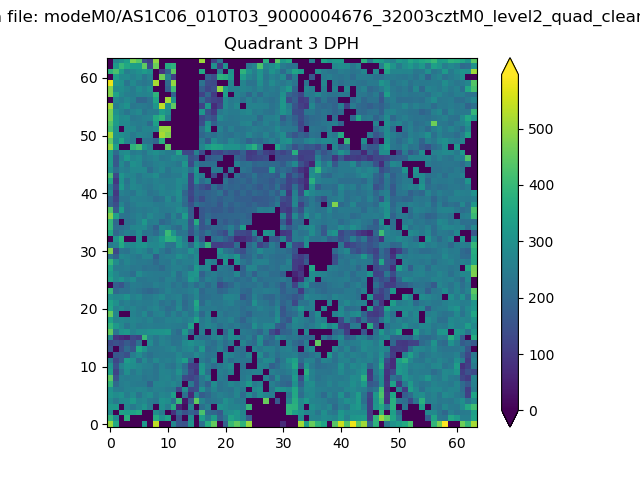 |
 |
Quadrant C |
| Plot type | Count rate plots | Images |
|---|---|---|
| Comparison with Poisson distribution Blue bars denote a histogram of data divided into 1 sec bins. Red curve is a Poisson curve with rate = median count rate of data. |
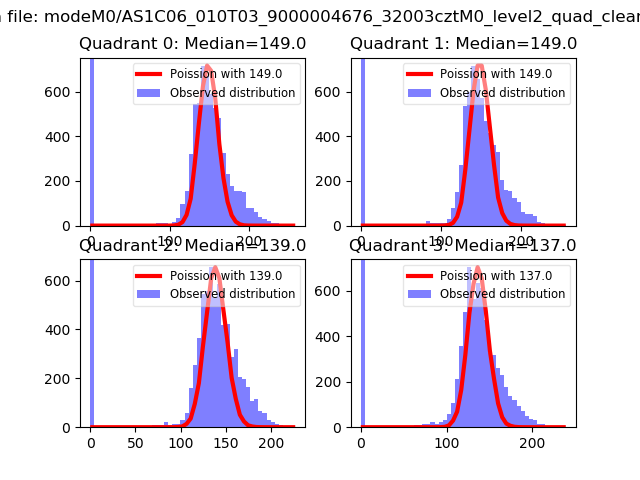 |
 |
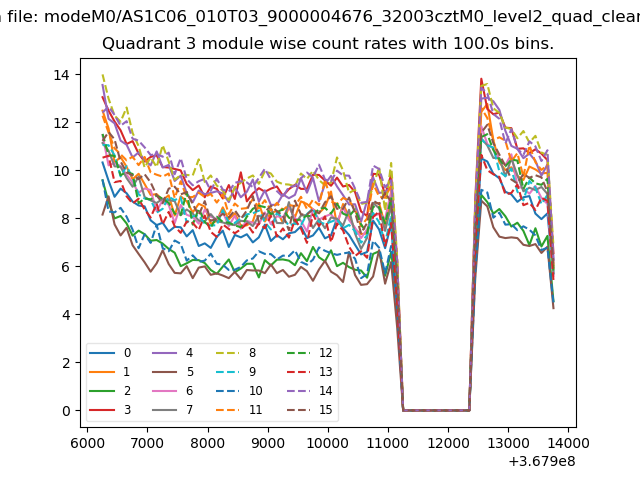
| Quadrant-wise count rates Data is divided into 100 sec bins |
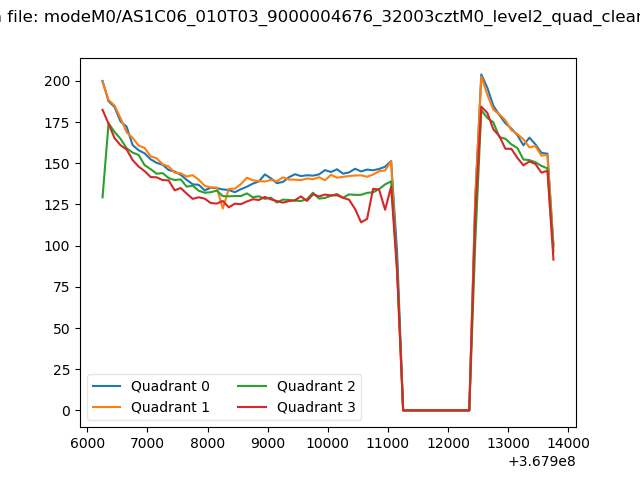 |
|
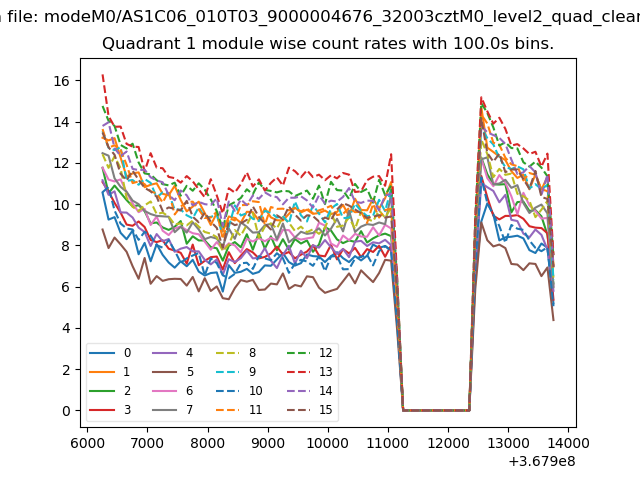
| Module-wise count rates for Quadrant A Data is divided into 100 sec bins |
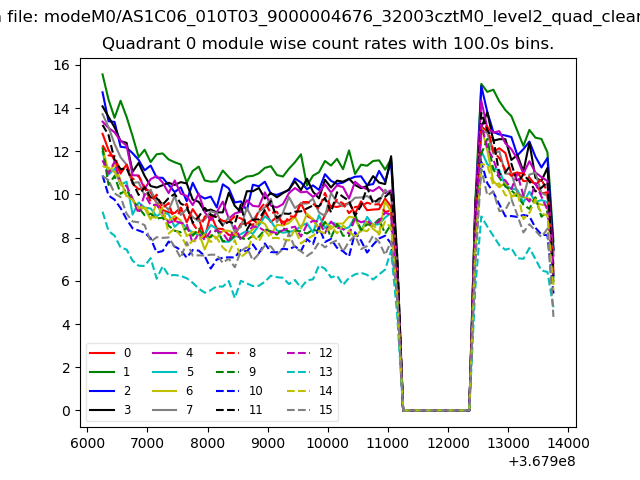 |
 |
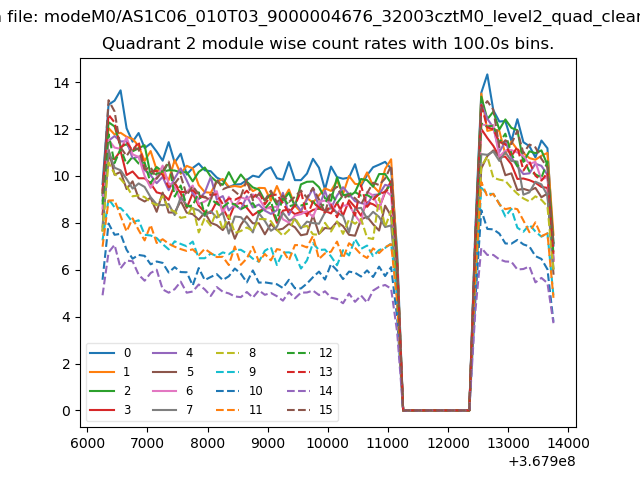
| Module-wise count rates for Quadrant B Data is divided into 100 sec bins |
 |
 |
| Module-wise count rates for Quadrant C Data is divided into 100 sec bins |
 |
 |
| Module-wise count rates for Quadrant D Data is divided into 100 sec bins |
 |
 |
| Parameter | Plot |
|---|---|
| CZT HV Monitor | 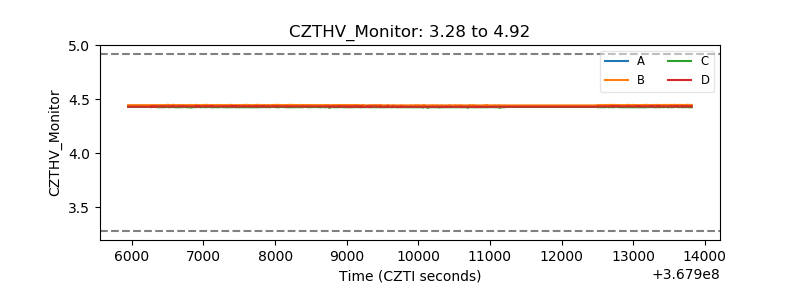 |
| D_VDD | 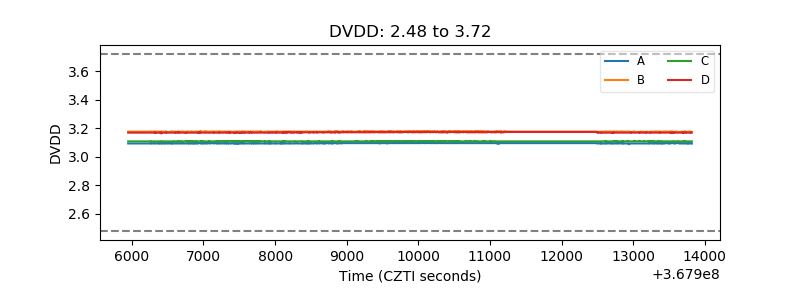 |
| Temperature 1 | 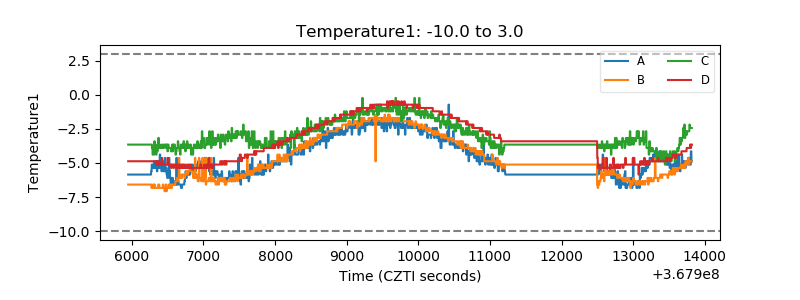 |
| Veto HV Monitor |  |
| Veto LLD | 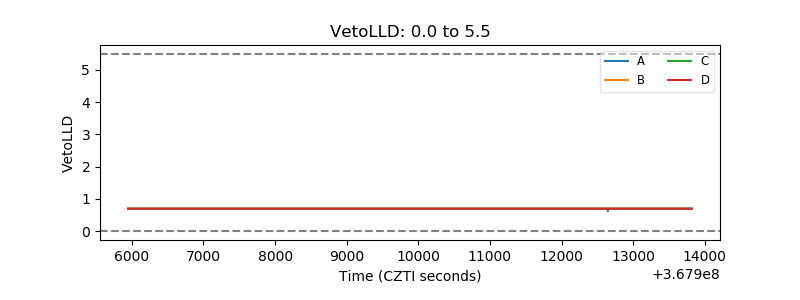 |
| Alpha Counter | 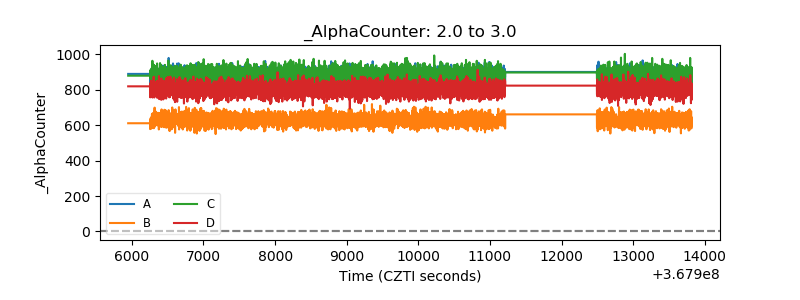 |
| _CPM_Rate | 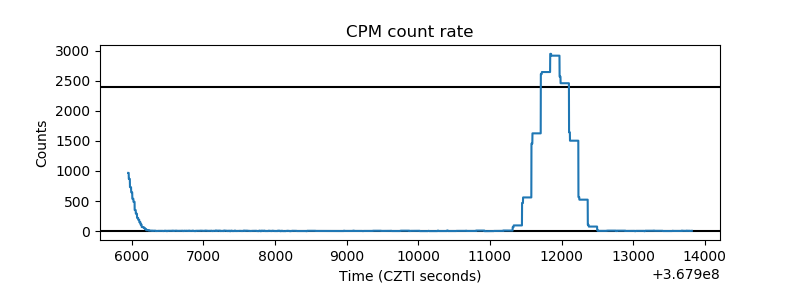 |
| CZT Counter | 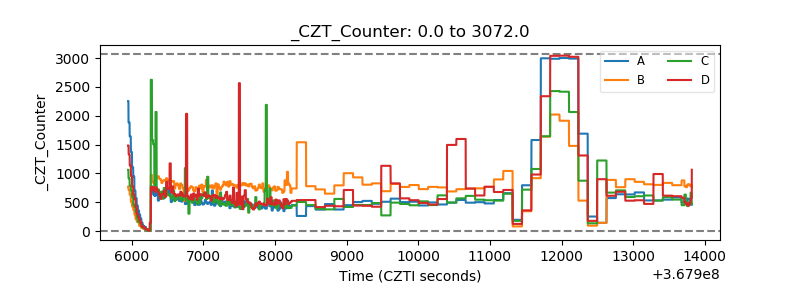 |
| +2.5 Volts monitor |  |
| +5 Volts monitor |  |
| _ROLL_ROT | 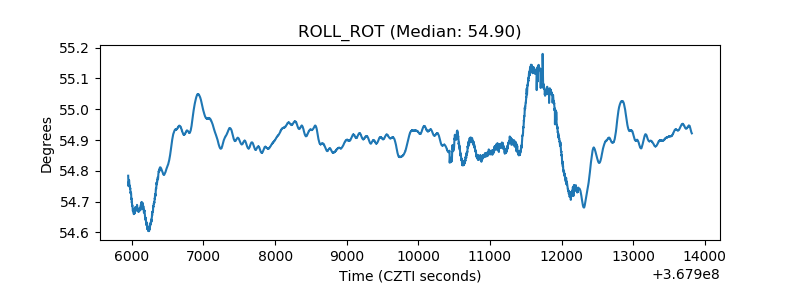 |
| _Roll_DEC | 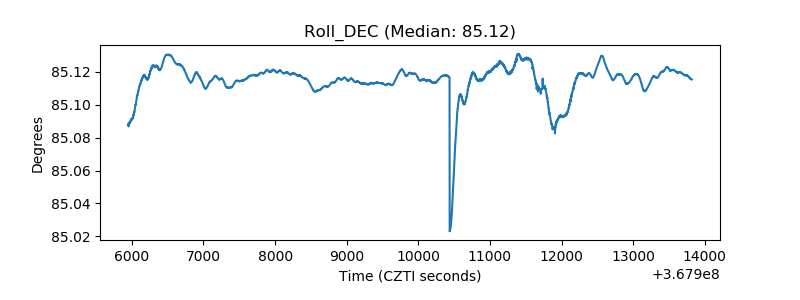 |
| _Roll_RA | 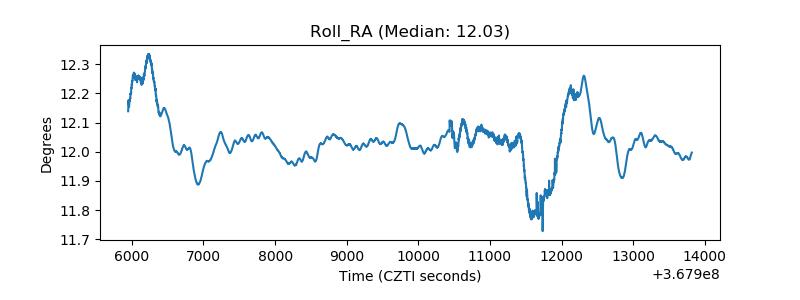 |
| Veto Counter | 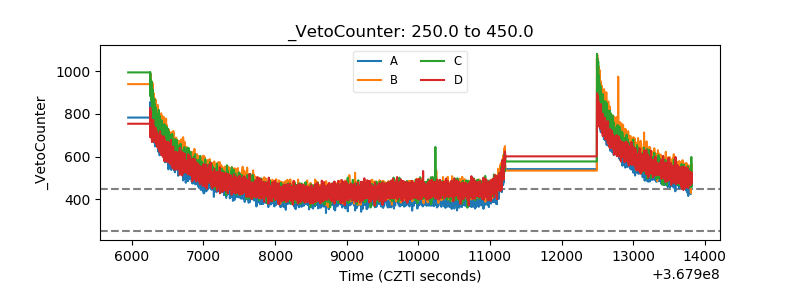 |