| Param | Original file | Final file |
|---|---|---|
| Filename | modeM0/AS1C06_010T03_9000004676_32005cztM0_level2.evt | modeM0/AS1C06_010T03_9000004676_32005cztM0_level2_quad_clean.evt |
| Size (bytes) | 552,104,640 | 133,845,120 |
| Size | 526.5 MB | 127.6 MB |
| Events in quadrant A | 3,113,871 | 954,812 |
| Events in quadrant B | 5,095,681 | 930,538 |
| Events in quadrant C | 3,950,009 | 869,073 |
| Events in quadrant D | 4,147,506 | 872,950 |
| Mode SS | |||
|---|---|---|---|
| Quadrant | BADHDUFLAG | Total packets | Discarded packets |
| A | 0 | 124 | 0 |
| B | 0 | 124 | 0 |
| C | 0 | 124 | 0 |
| D | 0 | 124 | 0 |
| Mode M0 | |||
|---|---|---|---|
| Quadrant | BADHDUFLAG | Total packets | Discarded packets |
| A | 0 | 12744 | 1 |
| B | 0 | 19301 | 1 |
| C | 0 | 15646 | 1 |
| D | 0 | 16275 | 1 |
| Mode M9 | |||
|---|---|---|---|
| Quadrant | BADHDUFLAG | Total packets | Discarded packets |
| A | 0 | 13 | 0 |
| B | 0 | 13 | 0 |
| C | 0 | 13 | 0 |
| D | 0 | 13 | 0 |
| Quadrant | Total seconds | Saturated seconds | Saturation percentage |
|---|---|---|---|
| A | 6109 | 84 | 1.375020% |
| B | 6109 | 217 | 3.552136% |
| C | 6109 | 203 | 3.322966% |
| D | 6109 | 234 | 3.830414% |
Noise dominated data is calculated using 1-second bins in cleaned event files. If a bin has >2000 counts, and if more than 50% of those come from <1% of pixels, then it is considered to be noise-dominated and hence unusable.
| Quadrant | # 1 sec bins | Bins with >0 counts | Bins with >2000 counts | High rate bins dominated by noise | Noise dominated (total time) | Noise dominated (detector-on time) | Marked lightcurve |
|---|---|---|---|---|---|---|---|
| A | 7374 | 6109 | 0 | 0 | 0.00% | 0.00% | 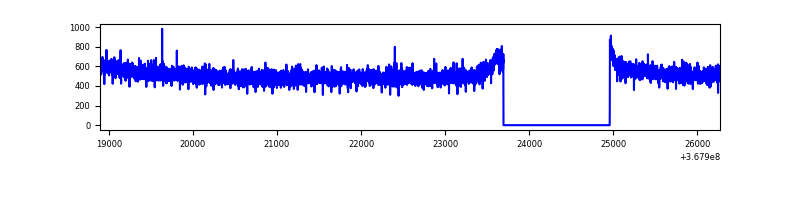 |
| B | 7374 | 6109 | 34 | 34 | 0.46% | 0.56% | 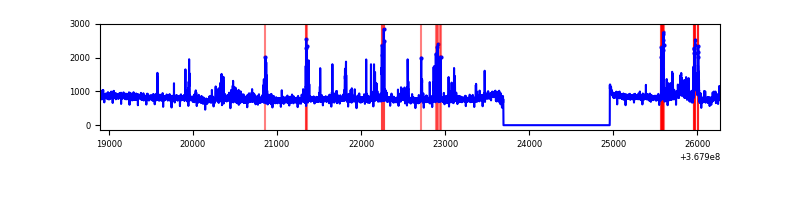 |
| C | 7374 | 6109 | 10 | 10 | 0.14% | 0.16% |  |
| D | 7374 | 6109 | 161 | 161 | 2.18% | 2.64% | 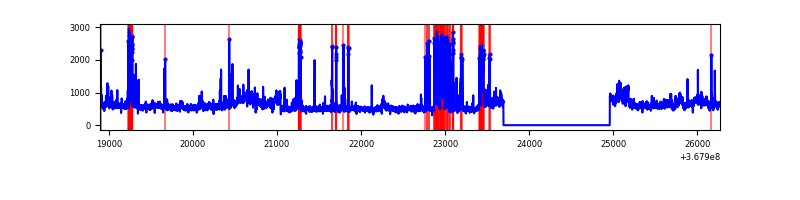 |
Top three noisy pixels from each quadrant. If the there are fewer than three noisy pixels in the level2.evt file, extra rows are filled as -1
| Pixel properties | Quadrant properties | ||||||
|---|---|---|---|---|---|---|---|
| Quadrant | DetID | PixID | Counts | Sigma | Mean | Median | Sigma |
| A | 13 | 254 | 11144 | 65.4 | 806 | 793 | 158.3 |
| A | 3 | 137 | 7098 | 39.84 | 806 | 793 | 158.3 |
| A | 0 | 226 | 6868 | 38.38 | 806 | 793 | 158.3 |
| B | 6 | 159 | 1639008 | 11279.14 | 780 | 761 | 145.2 |
| B | 10 | 245 | 207083 | 1420.5 | 780 | 761 | 145.2 |
| B | 0 | 190 | 97204 | 664.0 | 780 | 761 | 145.2 |
| C | 3 | 233 | 625112 | 3699.06 | 740 | 744 | 168.8 |
| C | 0 | 10 | 261301 | 1543.67 | 740 | 744 | 168.8 |
| C | 14 | 238 | 126333 | 744.05 | 740 | 744 | 168.8 |
| D | 8 | 195 | 633793 | 3591.01 | 761 | 741 | 176.3 |
| D | 12 | 218 | 258725 | 1463.42 | 761 | 741 | 176.3 |
| D | 13 | 249 | 248371 | 1404.69 | 761 | 741 | 176.3 |
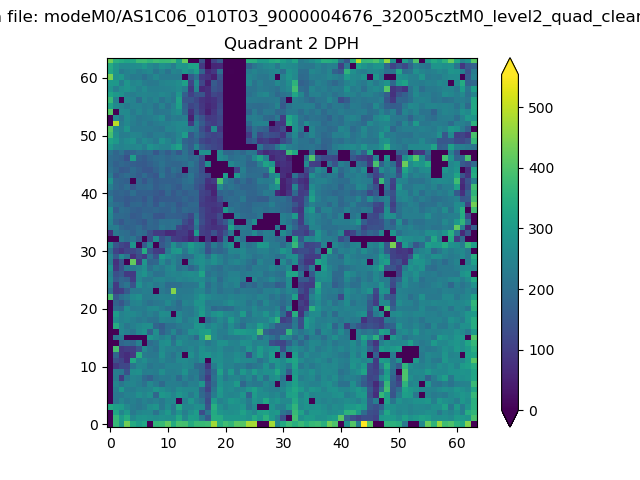
Histogram calculated using DETX and DETY for each event in the final _common_clean file
| Quadrant A | 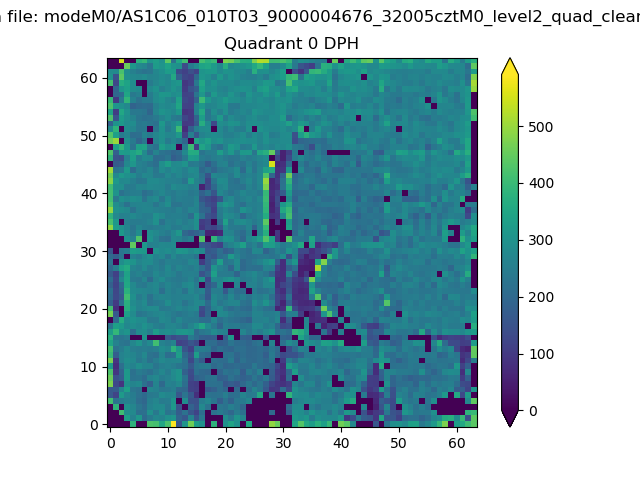 |
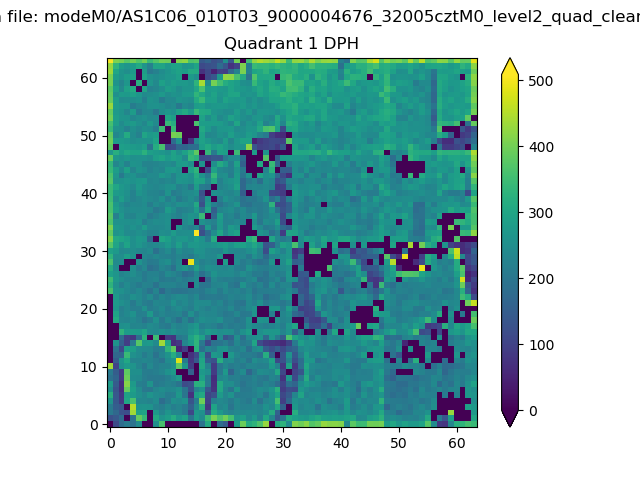 |
Quadrant B |
|---|---|---|---|
| Quadrant D | 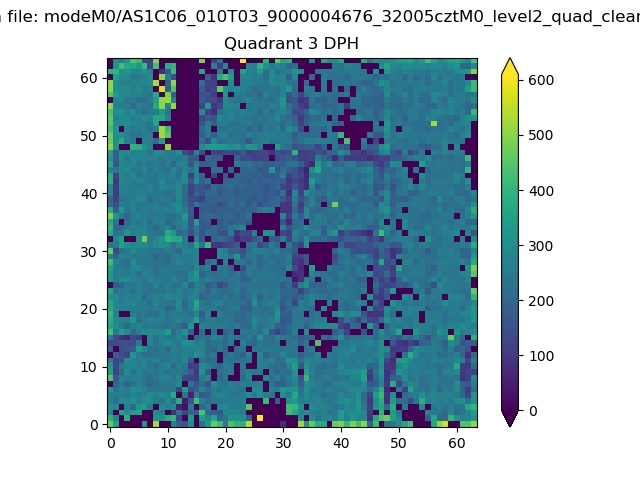 |
 |
Quadrant C |
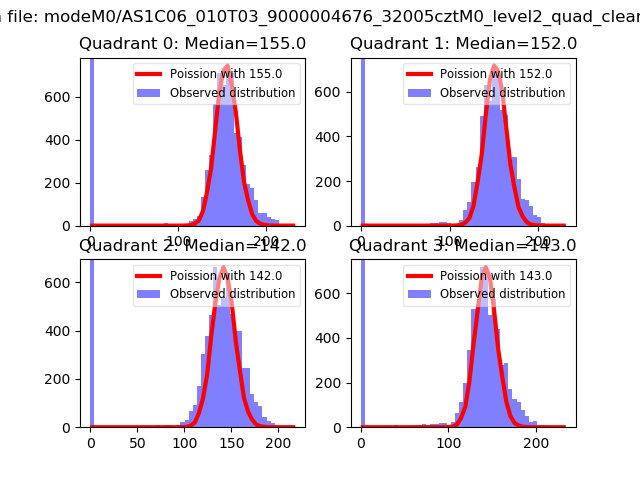
| Plot type | Count rate plots | Images |
|---|---|---|
| Comparison with Poisson distribution Blue bars denote a histogram of data divided into 1 sec bins. Red curve is a Poisson curve with rate = median count rate of data. |
 |
 |
| Quadrant-wise count rates Data is divided into 100 sec bins |
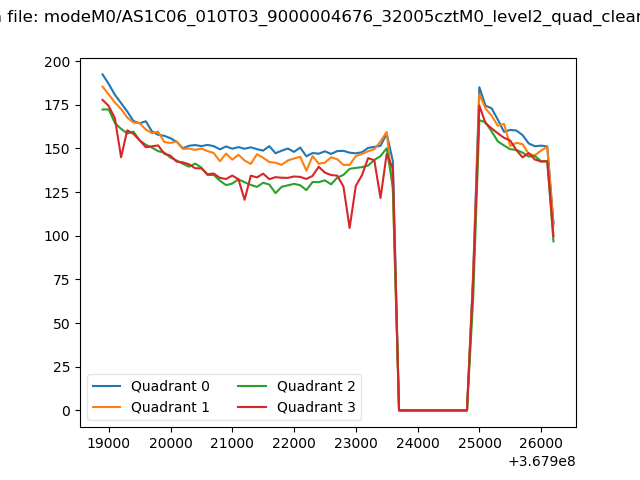 |
|
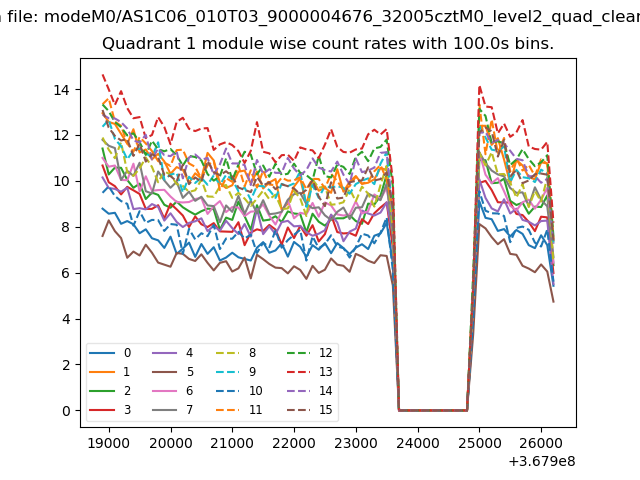
| Module-wise count rates for Quadrant A Data is divided into 100 sec bins |
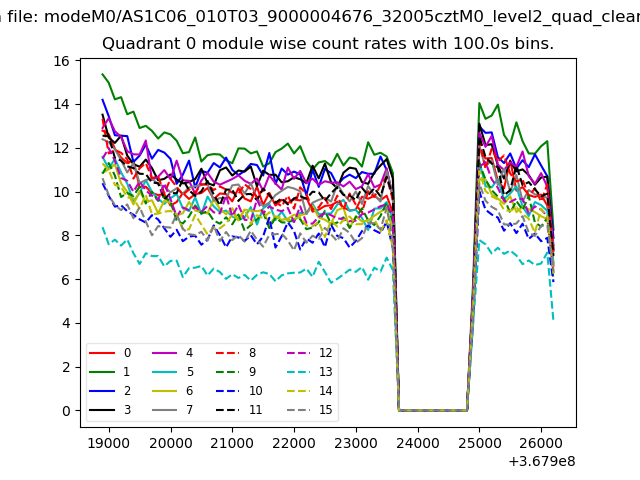 |
 |
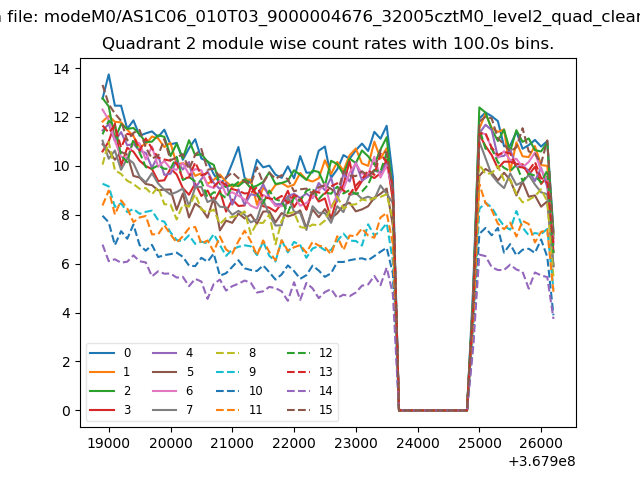
| Module-wise count rates for Quadrant B Data is divided into 100 sec bins |
 |
 |
| Module-wise count rates for Quadrant C Data is divided into 100 sec bins |
 |
 |
| Module-wise count rates for Quadrant D Data is divided into 100 sec bins |
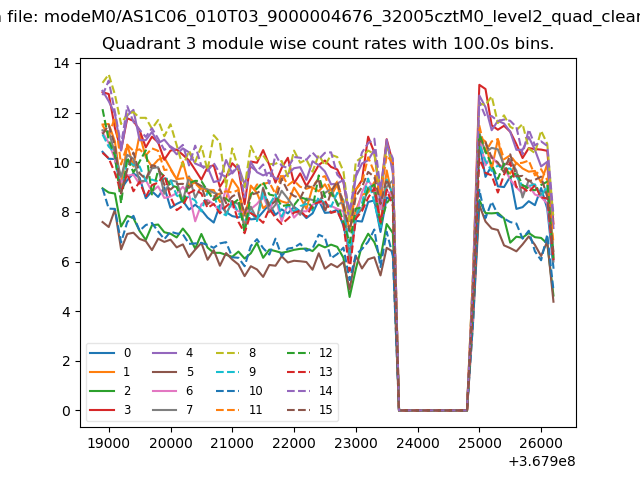 |
 |
| Parameter | Plot |
|---|---|
| CZT HV Monitor |  |
| D_VDD | 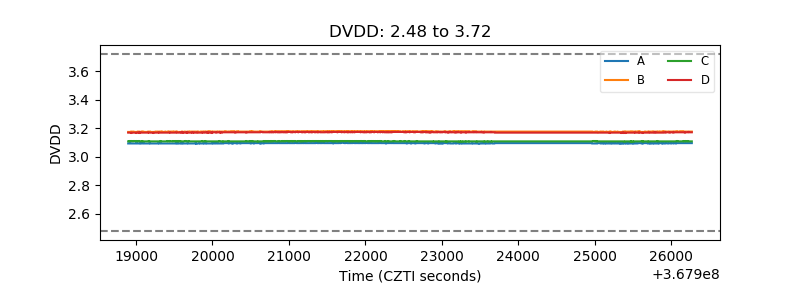 |
| Temperature 1 |  |
| Veto HV Monitor | 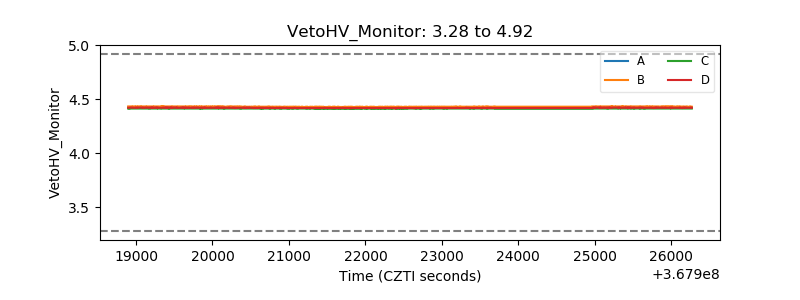 |
| Veto LLD | 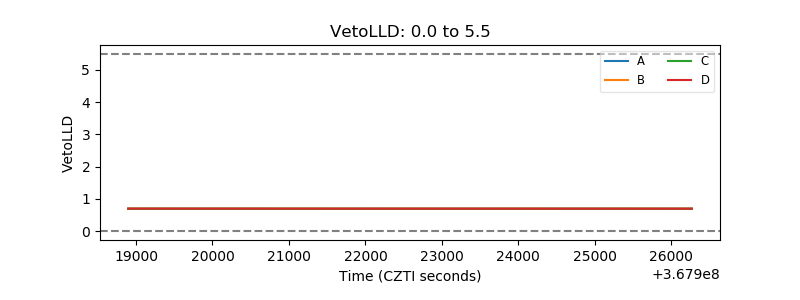 |
| Alpha Counter | 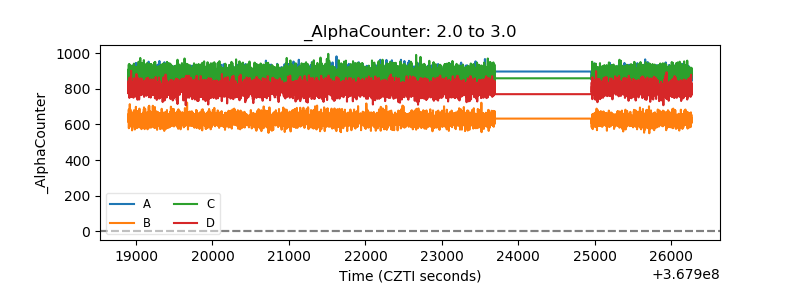 |
| _CPM_Rate | 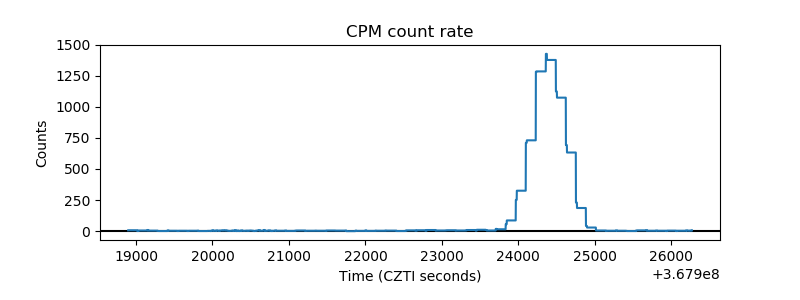 |
| CZT Counter | 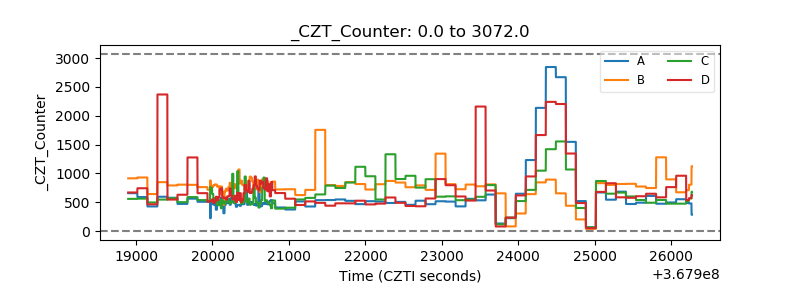 |
| +2.5 Volts monitor |  |
| +5 Volts monitor |  |
| _ROLL_ROT | 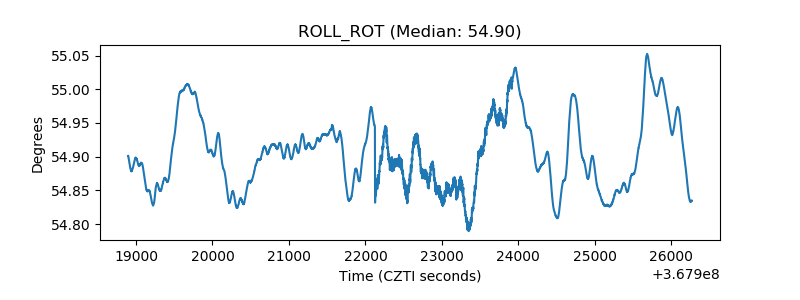 |
| _Roll_DEC | 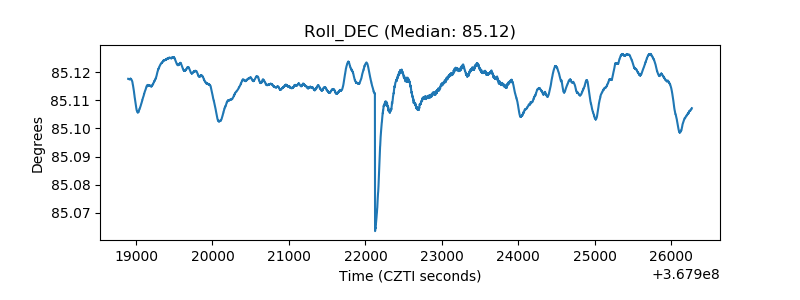 |
| _Roll_RA | 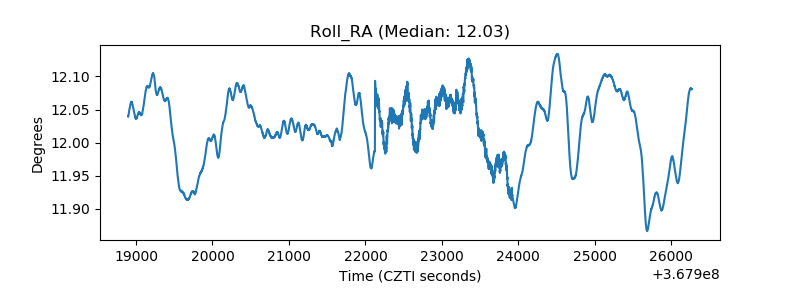 |
| Veto Counter | 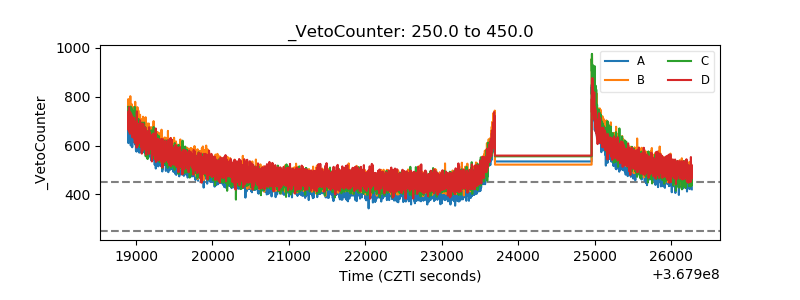 |