| Param | Original file | Final file |
|---|---|---|
| Filename | modeM0/AS1C06_010T03_9000004676_32006cztM0_level2.evt | modeM0/AS1C06_010T03_9000004676_32006cztM0_level2_quad_clean.evt |
| Size (bytes) | 1,392,436,800 | 333,944,640 |
| Size | 1.3 GB | 318.5 MB |
| Events in quadrant A | 7,846,839 | 2,377,459 |
| Events in quadrant B | 12,811,472 | 2,324,532 |
| Events in quadrant C | 9,824,570 | 2,168,039 |
| Events in quadrant D | 10,630,198 | 2,162,840 |
| Mode SS | |||
|---|---|---|---|
| Quadrant | BADHDUFLAG | Total packets | Discarded packets |
| A | 0 | 320 | 0 |
| B | 0 | 320 | 0 |
| C | 0 | 320 | 0 |
| D | 0 | 320 | 0 |
| Mode M0 | |||
|---|---|---|---|
| Quadrant | BADHDUFLAG | Total packets | Discarded packets |
| A | 0 | 32495 | 3 |
| B | 0 | 49228 | 3 |
| C | 0 | 39078 | 3 |
| D | 0 | 41553 | 3 |
| Mode M9 | |||
|---|---|---|---|
| Quadrant | BADHDUFLAG | Total packets | Discarded packets |
| A | 0 | 37 | 0 |
| B | 0 | 37 | 0 |
| C | 0 | 37 | 0 |
| D | 0 | 37 | 0 |
| Quadrant | Total seconds | Saturated seconds | Saturation percentage |
|---|---|---|---|
| A | 15692 | 214 | 1.363752% |
| B | 15692 | 558 | 3.555952% |
| C | 15692 | 534 | 3.403008% |
| D | 15693 | 654 | 4.167463% |
Noise dominated data is calculated using 1-second bins in cleaned event files. If a bin has >2000 counts, and if more than 50% of those come from <1% of pixels, then it is considered to be noise-dominated and hence unusable.
| Quadrant | # 1 sec bins | Bins with >0 counts | Bins with >2000 counts | High rate bins dominated by noise | Noise dominated (total time) | Noise dominated (detector-on time) | Marked lightcurve |
|---|---|---|---|---|---|---|---|
| A | 19397 | 15692 | 0 | 0 | 0.00% | 0.00% |  |
| B | 19397 | 15692 | 110 | 110 | 0.57% | 0.70% |  |
| C | 19397 | 15692 | 46 | 46 | 0.24% | 0.29% |  |
| D | 19398 | 15693 | 424 | 424 | 2.19% | 2.70% | 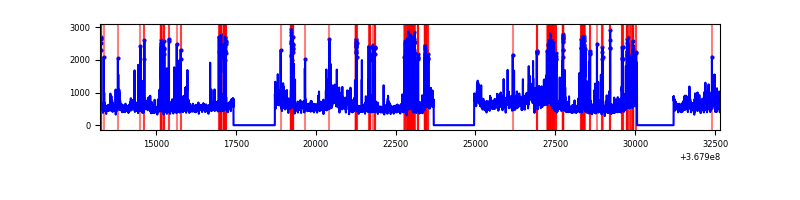 |
Top three noisy pixels from each quadrant. If the there are fewer than three noisy pixels in the level2.evt file, extra rows are filled as -1
| Pixel properties | Quadrant properties | ||||||
|---|---|---|---|---|---|---|---|
| Quadrant | DetID | PixID | Counts | Sigma | Mean | Median | Sigma |
| A | 13 | 254 | 28729 | 67.44 | 2028 | 1992 | 396.5 |
| A | 3 | 137 | 18236 | 40.97 | 2028 | 1992 | 396.5 |
| A | 0 | 226 | 17433 | 38.95 | 2028 | 1992 | 396.5 |
| B | 6 | 159 | 4162879 | 11517.14 | 1964 | 1918 | 361.3 |
| B | 10 | 245 | 336127 | 925.06 | 1964 | 1918 | 361.3 |
| B | 0 | 190 | 277498 | 762.78 | 1964 | 1918 | 361.3 |
| C | 3 | 233 | 1214113 | 2875.23 | 1869 | 1881 | 421.6 |
| C | 0 | 10 | 674878 | 1596.25 | 1869 | 1881 | 421.6 |
| C | 14 | 238 | 323043 | 761.75 | 1869 | 1881 | 421.6 |
| D | 8 | 195 | 1594063 | 3586.54 | 1917 | 1869 | 443.9 |
| D | 13 | 249 | 904023 | 2032.17 | 1917 | 1869 | 443.9 |
| D | 12 | 218 | 487141 | 1093.11 | 1917 | 1869 | 443.9 |
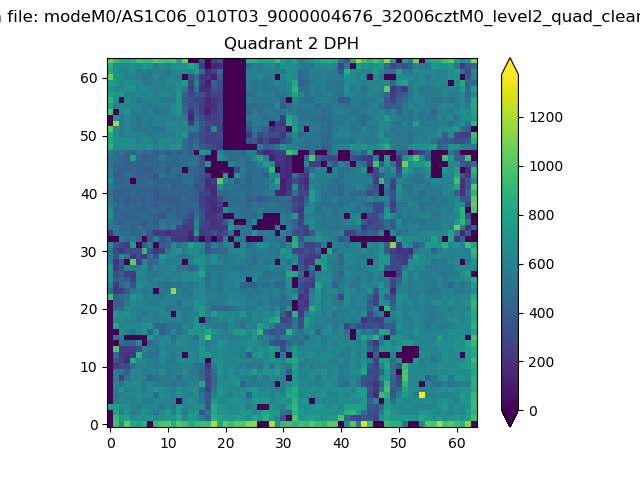
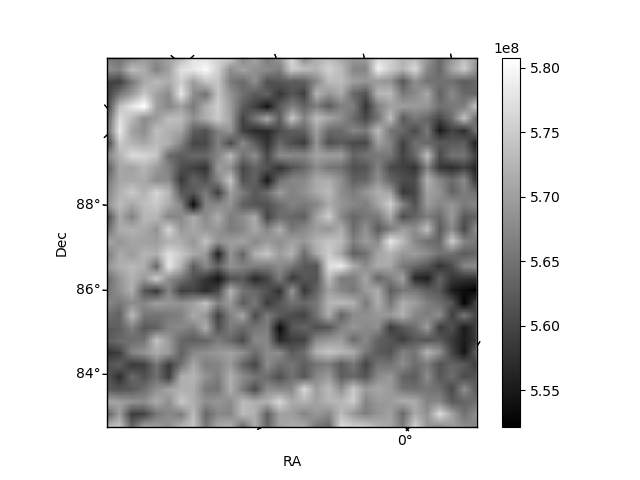
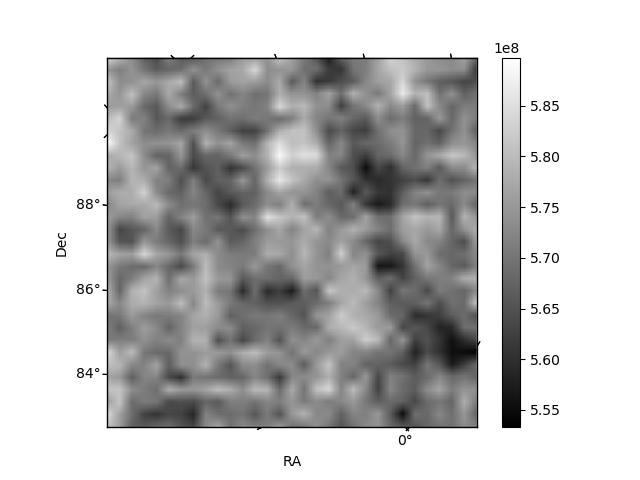
Histogram calculated using DETX and DETY for each event in the final _common_clean file
| Quadrant A | 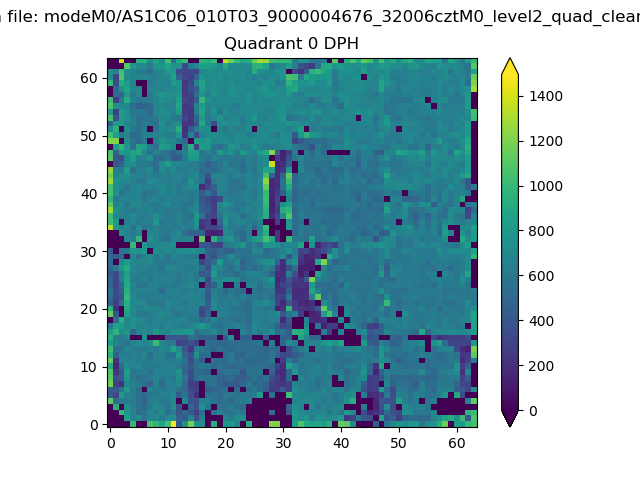 |
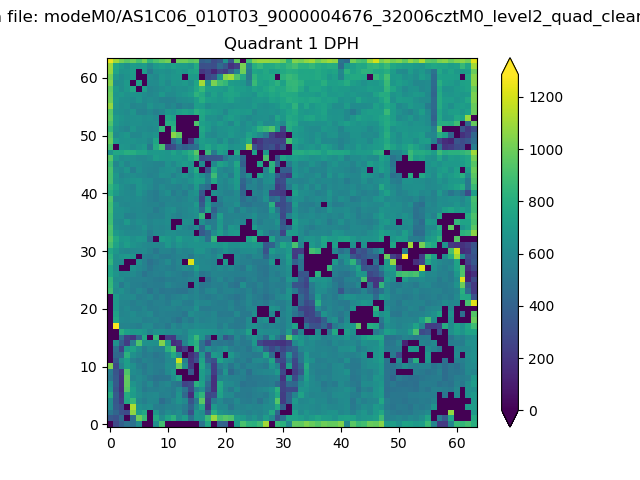 |
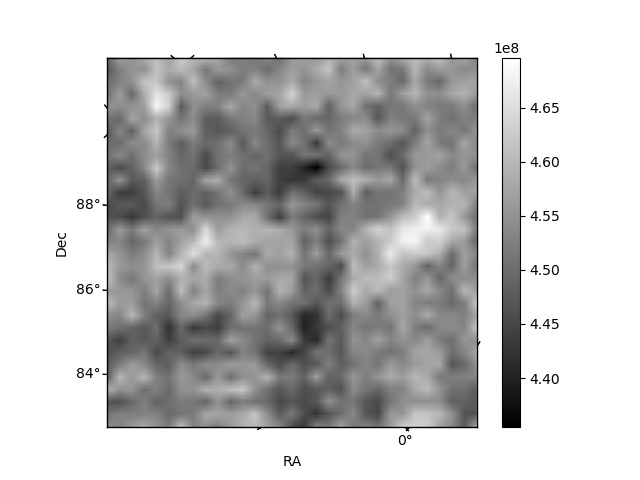
Quadrant B |
|---|---|---|---|
| Quadrant D | 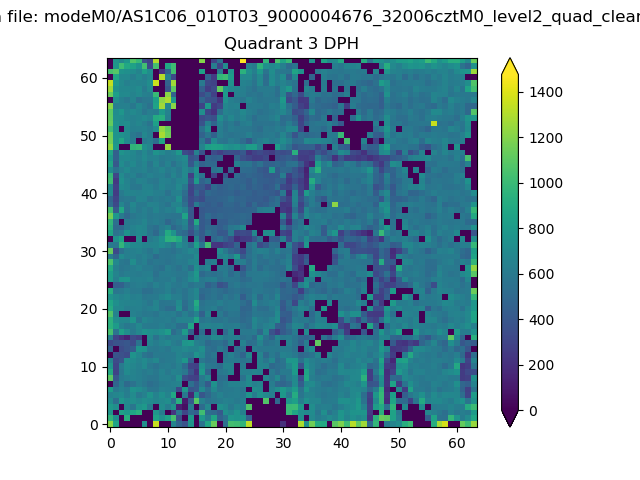 |
 |
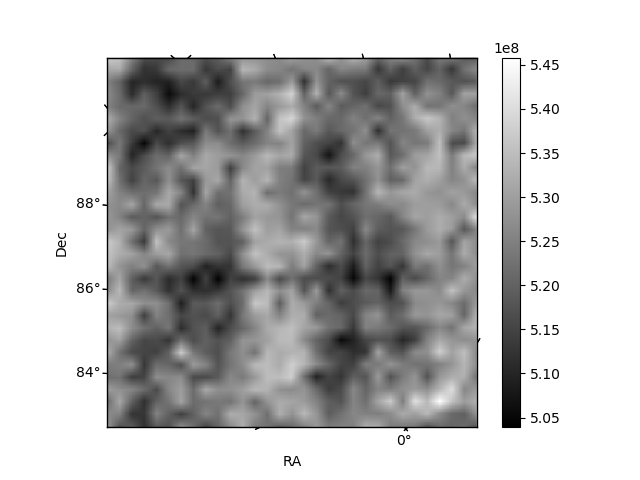
Quadrant C |
| Plot type | Count rate plots | Images |
|---|---|---|
| Comparison with Poisson distribution Blue bars denote a histogram of data divided into 1 sec bins. Red curve is a Poisson curve with rate = median count rate of data. |
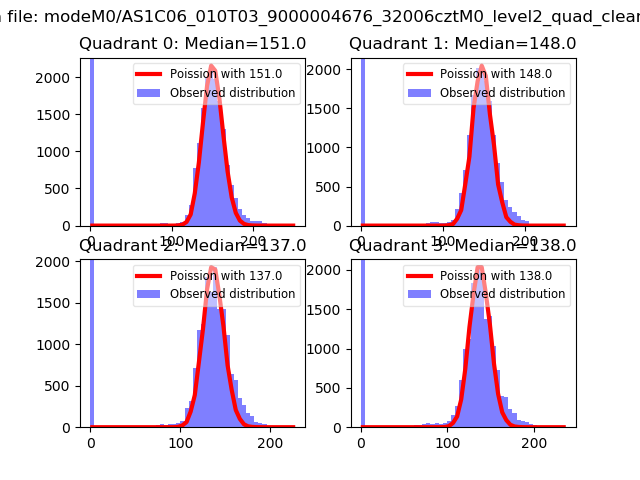 |
 |
| Quadrant-wise count rates Data is divided into 100 sec bins |
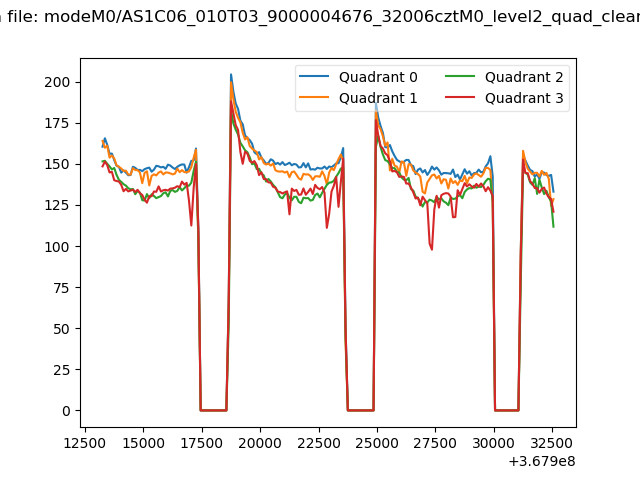 |
|
| Module-wise count rates for Quadrant A Data is divided into 100 sec bins |
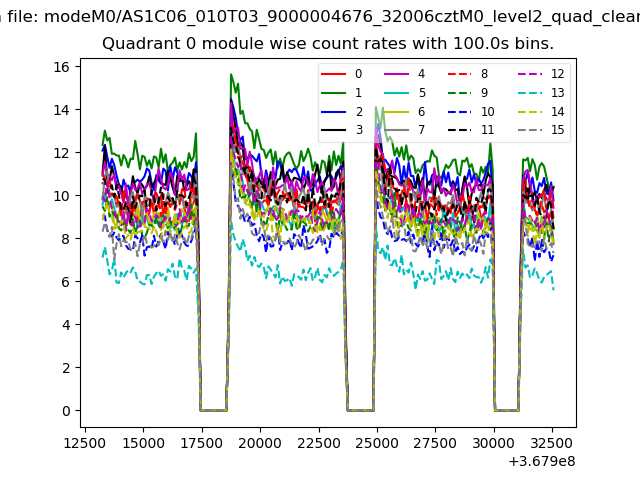 |
 |
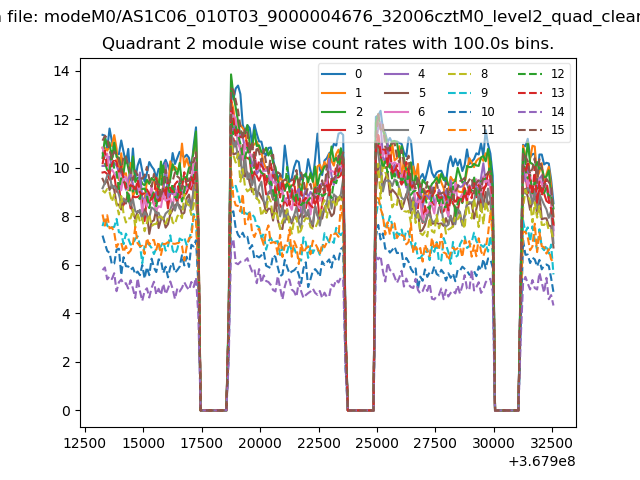
| Module-wise count rates for Quadrant B Data is divided into 100 sec bins |
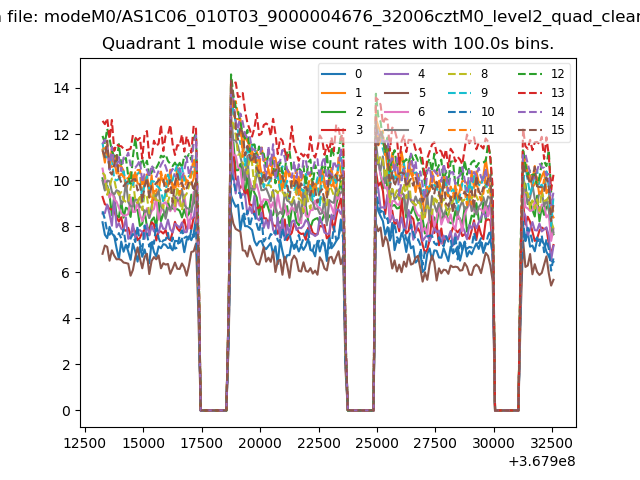 |
 |
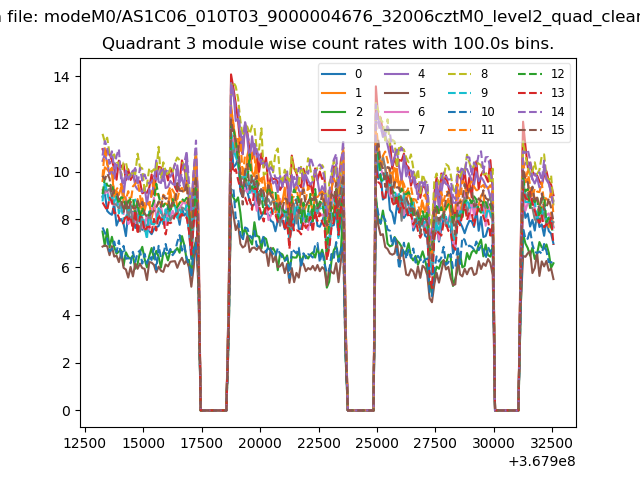
| Module-wise count rates for Quadrant C Data is divided into 100 sec bins |
 |
 |
| Module-wise count rates for Quadrant D Data is divided into 100 sec bins |
 |
 |
| Parameter | Plot |
|---|---|
| CZT HV Monitor | 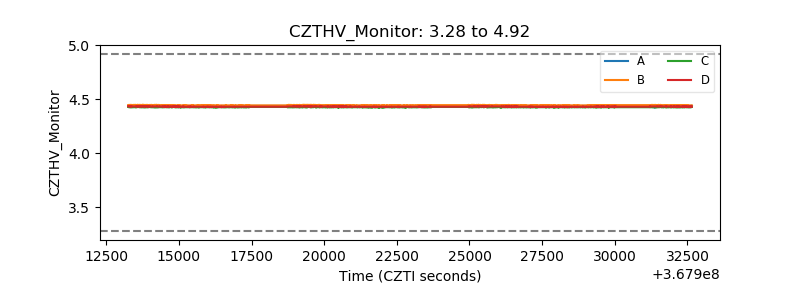 |
| D_VDD | 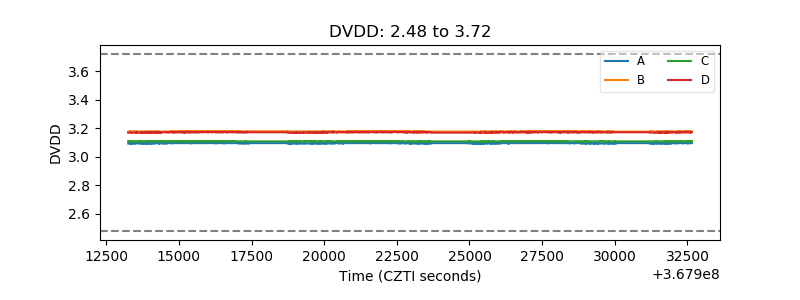 |
| Temperature 1 | 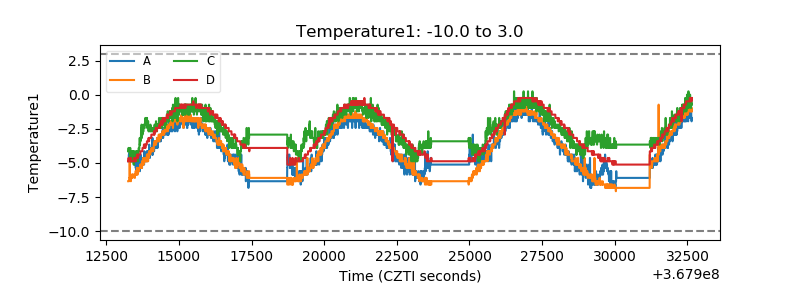 |
| Veto HV Monitor | 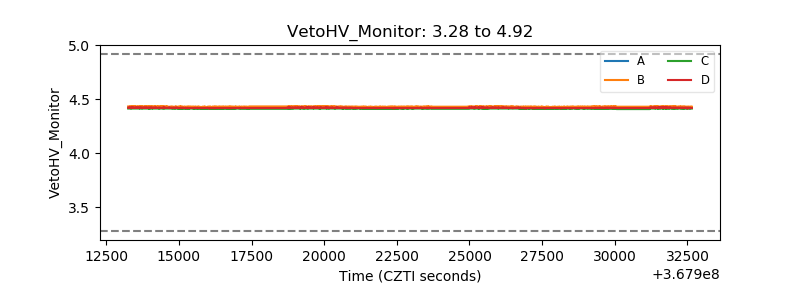 |
| Veto LLD |  |
| Alpha Counter | 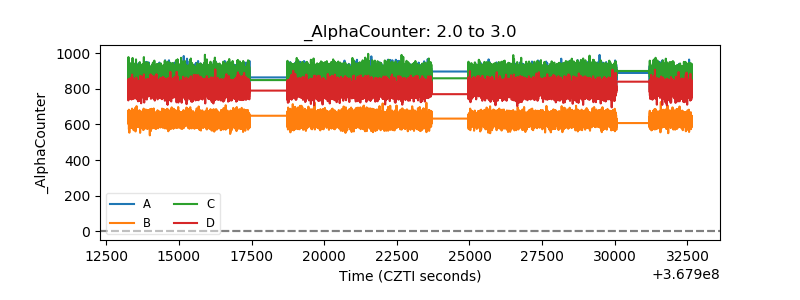 |
| _CPM_Rate | 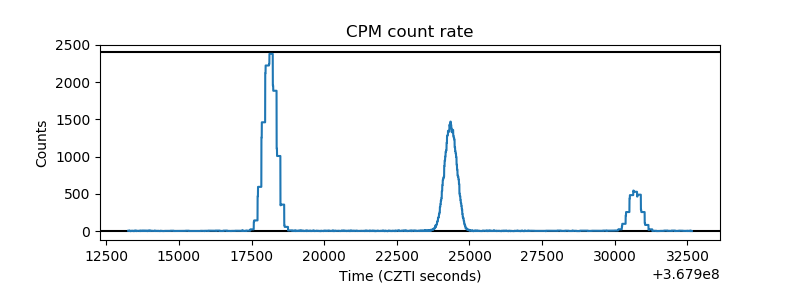 |
| CZT Counter | 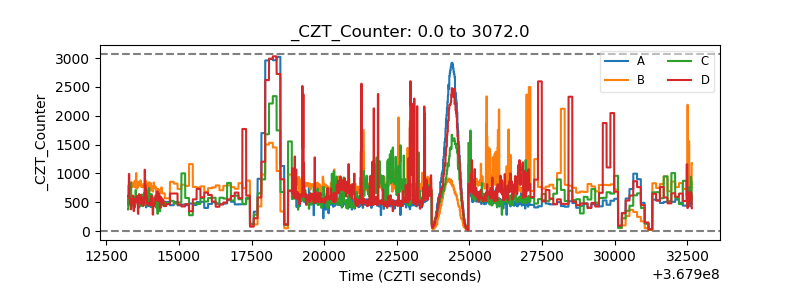 |
| +2.5 Volts monitor |  |
| +5 Volts monitor |  |
| _ROLL_ROT | 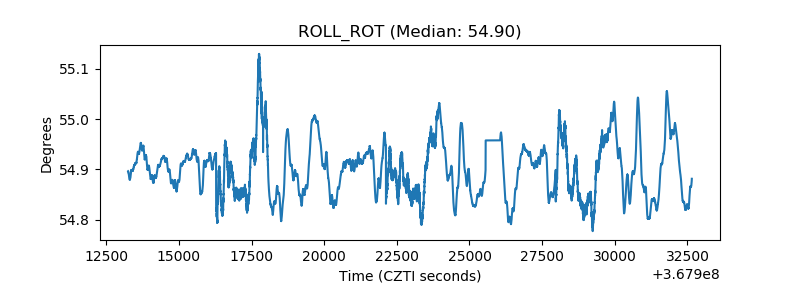 |
| _Roll_DEC | 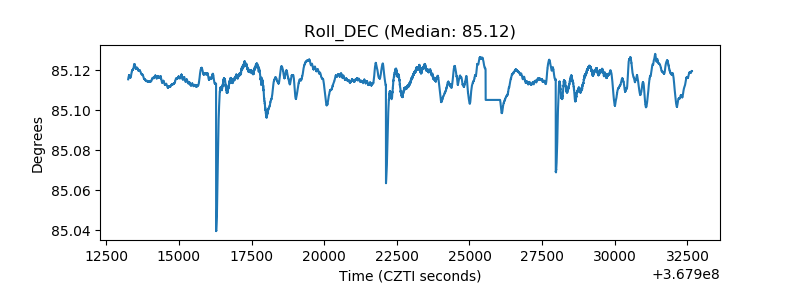 |
| _Roll_RA | 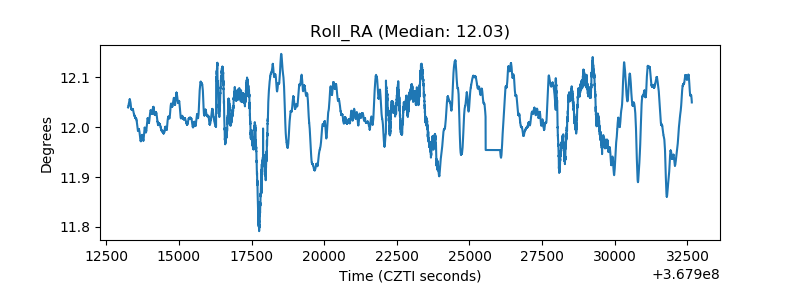 |
| Veto Counter | 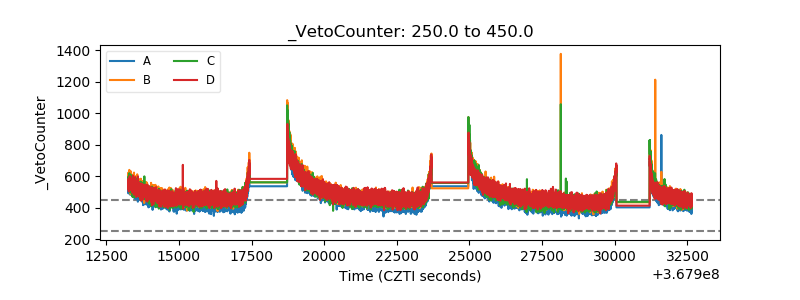 |