| Param | Original file | Final file |
|---|---|---|
| Filename | modeM0/AS1C06_010T03_9000004676_32007cztM0_level2.evt | modeM0/AS1C06_010T03_9000004676_32007cztM0_level2_quad_clean.evt |
| Size (bytes) | 311,886,720 | 63,599,040 |
| Size | 297.4 MB | 60.7 MB |
| Events in quadrant A | 1,516,150 | 452,078 |
| Events in quadrant B | 2,577,134 | 441,250 |
| Events in quadrant C | 2,322,611 | 400,570 |
| Events in quadrant D | 2,811,519 | 404,423 |
| Mode SS | |||
|---|---|---|---|
| Quadrant | BADHDUFLAG | Total packets | Discarded packets |
| A | 0 | 64 | 0 |
| B | 0 | 64 | 0 |
| C | 0 | 64 | 0 |
| D | 0 | 64 | 0 |
| Mode M0 | |||
|---|---|---|---|
| Quadrant | BADHDUFLAG | Total packets | Discarded packets |
| A | 0 | 6457 | 1 |
| B | 0 | 10064 | 1 |
| C | 0 | 9038 | 1 |
| D | 0 | 10607 | 1 |
| Quadrant | Total seconds | Saturated seconds | Saturation percentage |
|---|---|---|---|
| A | 3198 | 7 | 0.218887% |
| B | 3199 | 76 | 2.375742% |
| C | 3199 | 238 | 7.439825% |
| D | 3199 | 176 | 5.501719% |
Noise dominated data is calculated using 1-second bins in cleaned event files. If a bin has >2000 counts, and if more than 50% of those come from <1% of pixels, then it is considered to be noise-dominated and hence unusable.
| Quadrant | # 1 sec bins | Bins with >0 counts | Bins with >2000 counts | High rate bins dominated by noise | Noise dominated (total time) | Noise dominated (detector-on time) | Marked lightcurve |
|---|---|---|---|---|---|---|---|
| A | 3198 | 3198 | 0 | 0 | 0.00% | 0.00% | 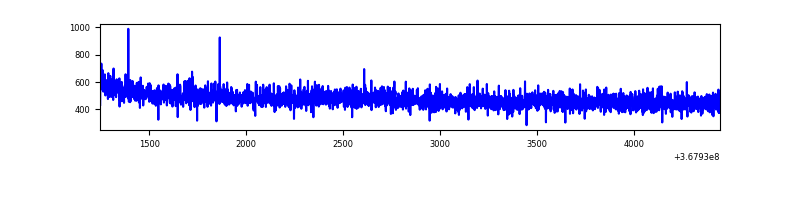 |
| B | 3199 | 3199 | 43 | 43 | 1.34% | 1.34% | 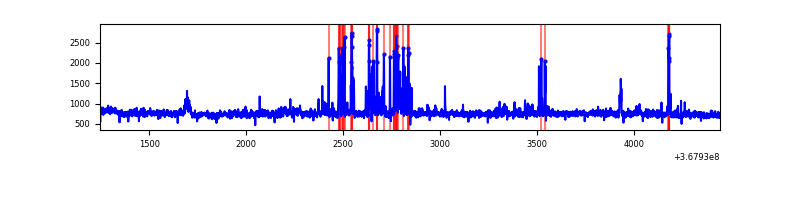 |
| C | 3198 | 3198 | 31 | 31 | 0.97% | 0.97% | 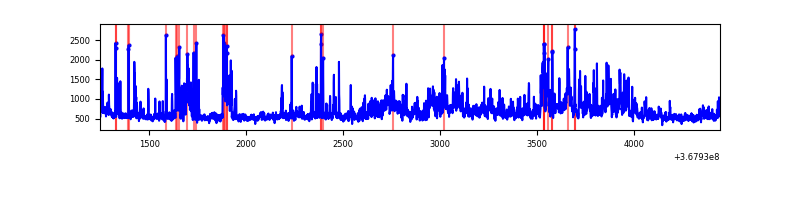 |
| D | 3199 | 3199 | 171 | 171 | 5.35% | 5.35% | 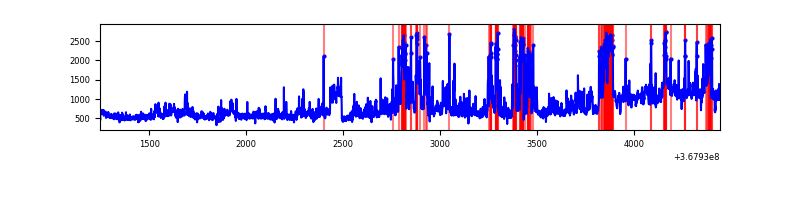 |
Top three noisy pixels from each quadrant. If the there are fewer than three noisy pixels in the level2.evt file, extra rows are filled as -1
| Pixel properties | Quadrant properties | ||||||
|---|---|---|---|---|---|---|---|
| Quadrant | DetID | PixID | Counts | Sigma | Mean | Median | Sigma |
| A | 13 | 254 | 6074 | 72.11 | 391 | 384 | 78.9 |
| A | 13 | 6 | 4511 | 52.3 | 391 | 384 | 78.9 |
| A | 3 | 137 | 3532 | 39.89 | 391 | 384 | 78.9 |
| B | 6 | 159 | 850623 | 11908.29 | 377 | 368 | 71.4 |
| B | 5 | 172 | 103917 | 1450.26 | 377 | 368 | 71.4 |
| B | 0 | 190 | 87096 | 1214.67 | 377 | 368 | 71.4 |
| C | 3 | 233 | 462266 | 5649.11 | 352 | 355 | 81.8 |
| C | 0 | 10 | 200124 | 2443.15 | 352 | 355 | 81.8 |
| C | 0 | 207 | 115168 | 1404.15 | 352 | 355 | 81.8 |
| D | 8 | 195 | 887281 | 10140.47 | 368 | 357 | 87.5 |
| D | 13 | 249 | 344829 | 3938.45 | 368 | 357 | 87.5 |
| D | 12 | 218 | 139845 | 1594.81 | 368 | 357 | 87.5 |
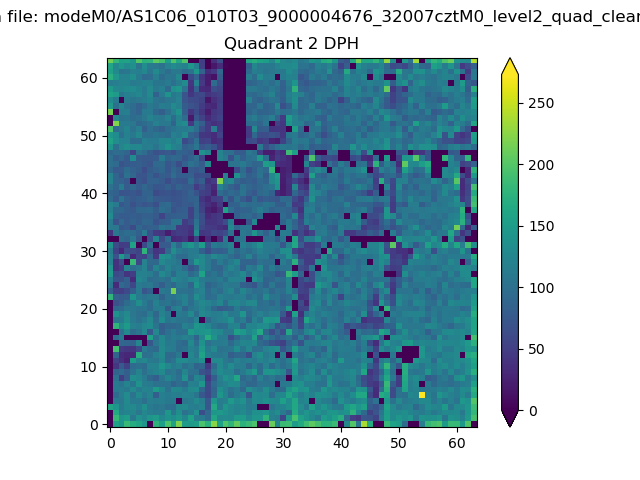
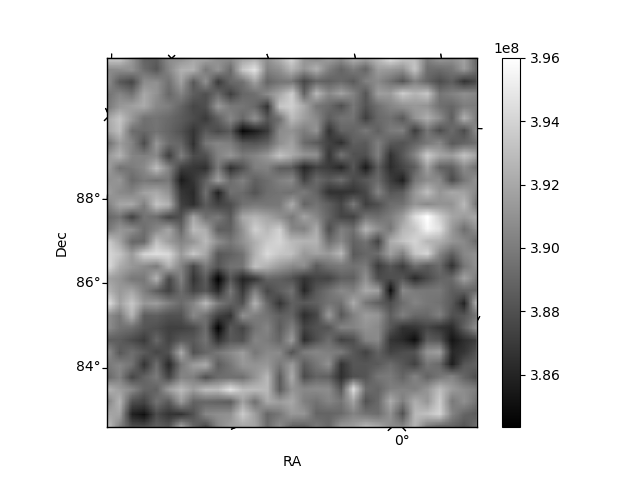
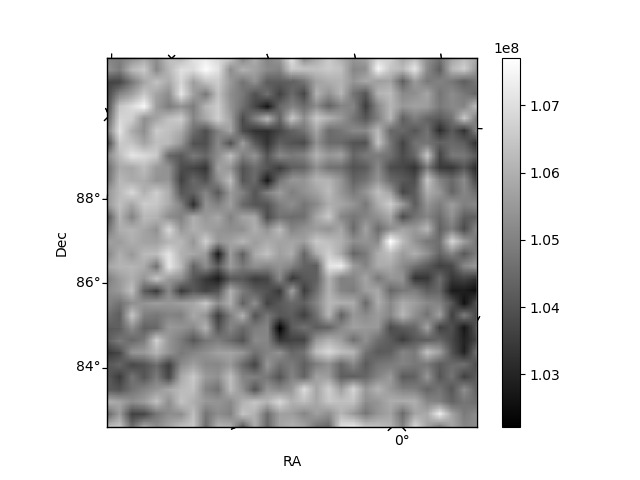
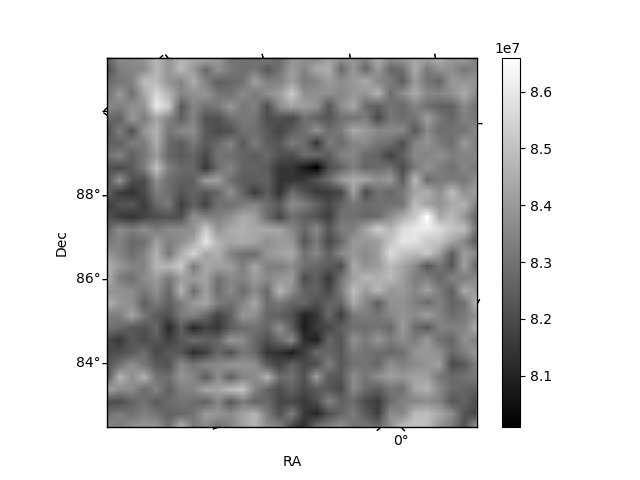
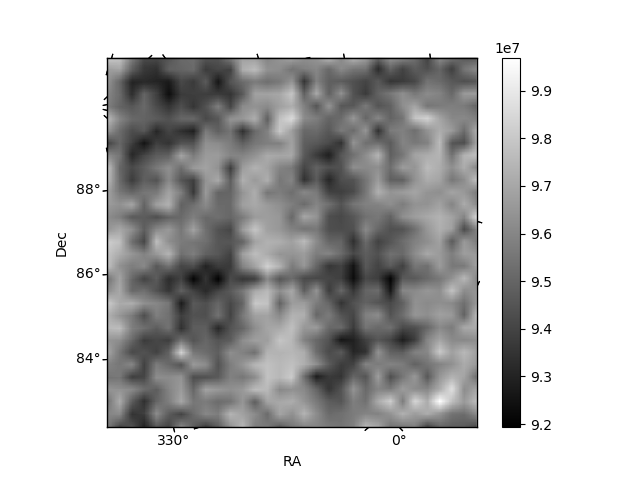
Histogram calculated using DETX and DETY for each event in the final _common_clean file
| Quadrant A | 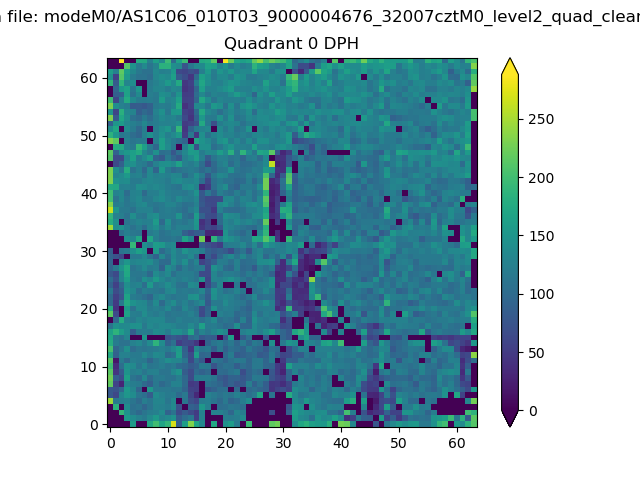 |
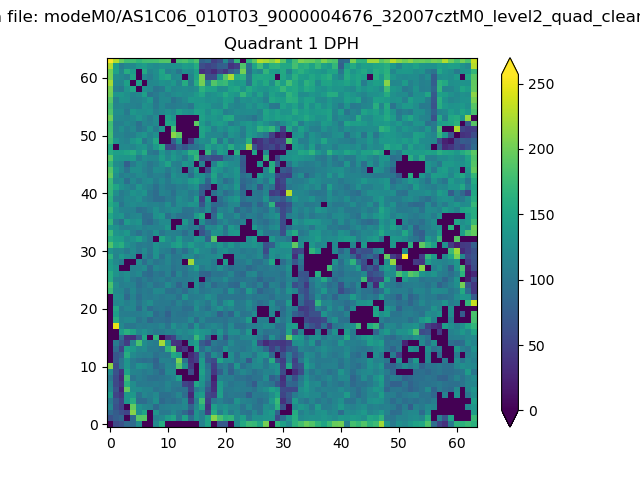 |
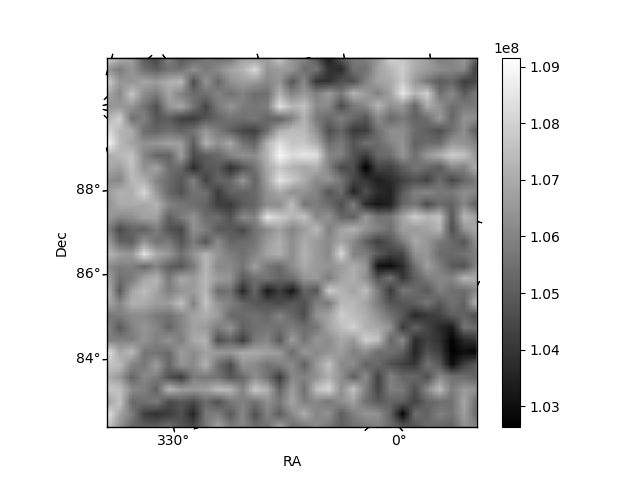
Quadrant B |
|---|---|---|---|
| Quadrant D | 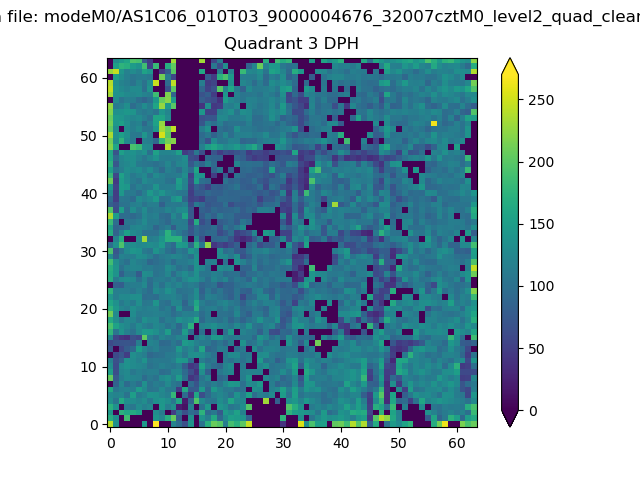 |
 |
Quadrant C |
| Plot type | Count rate plots | Images |
|---|---|---|
| Comparison with Poisson distribution Blue bars denote a histogram of data divided into 1 sec bins. Red curve is a Poisson curve with rate = median count rate of data. |
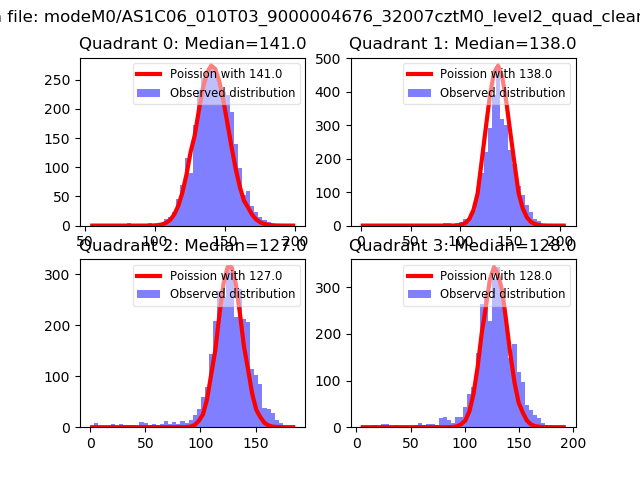 |
 |
| Quadrant-wise count rates Data is divided into 100 sec bins |
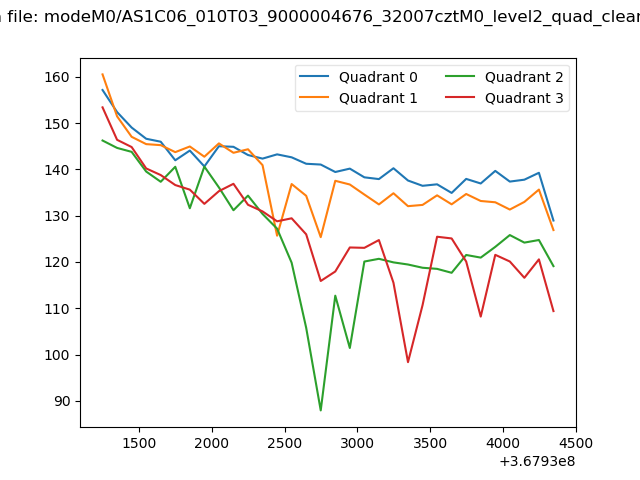 |
|
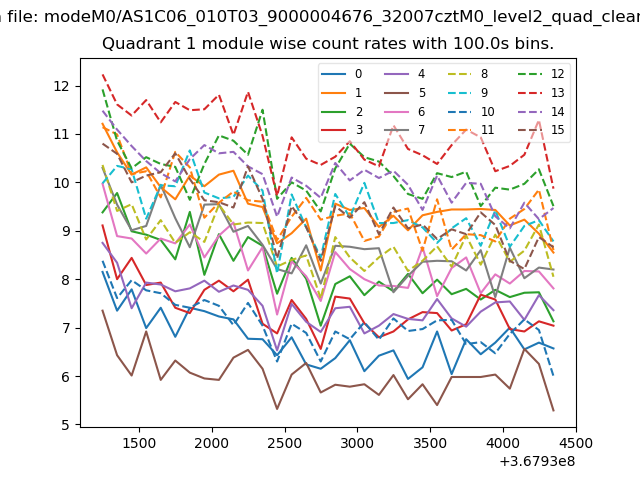
| Module-wise count rates for Quadrant A Data is divided into 100 sec bins |
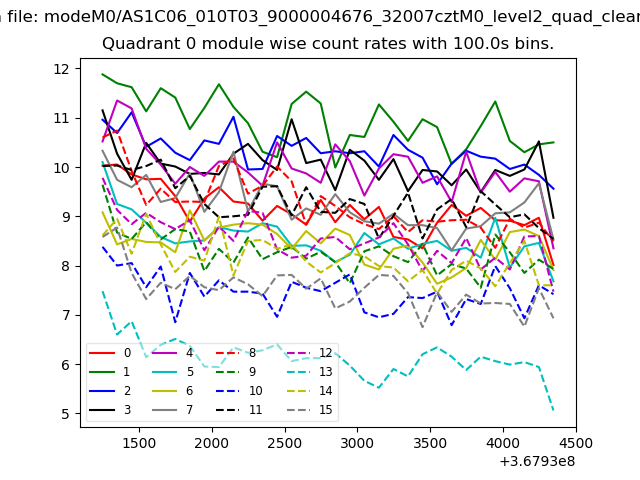 |
 |
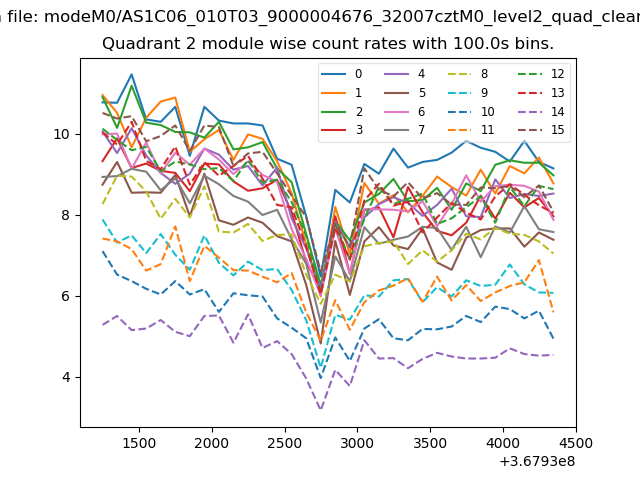
| Module-wise count rates for Quadrant B Data is divided into 100 sec bins |
 |
 |
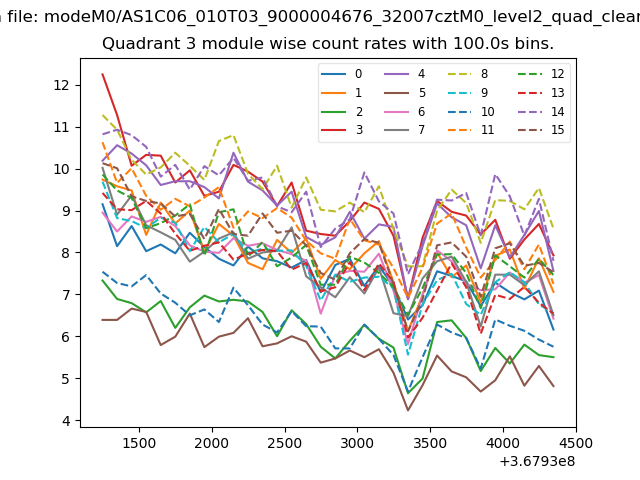
| Module-wise count rates for Quadrant C Data is divided into 100 sec bins |
 |
 |
| Module-wise count rates for Quadrant D Data is divided into 100 sec bins |
 |
 |
| Parameter | Plot |
|---|---|
| CZT HV Monitor | 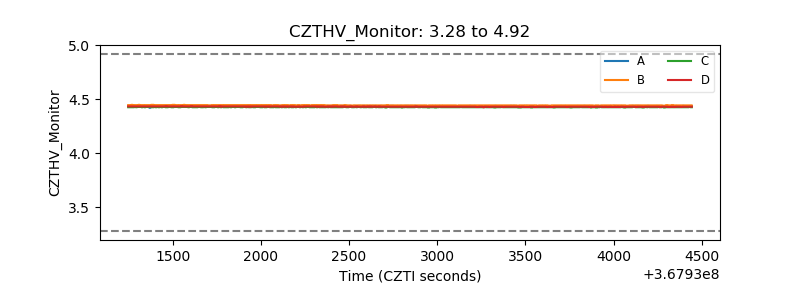 |
| D_VDD | 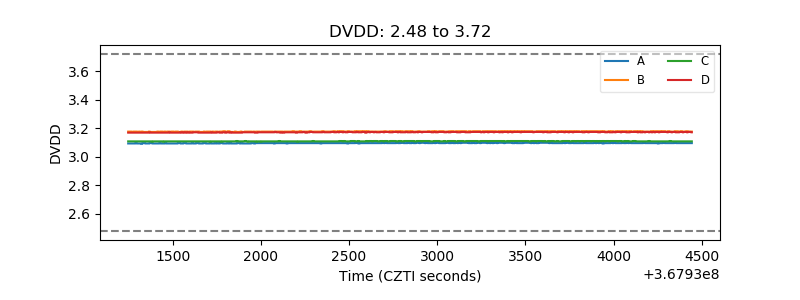 |
| Temperature 1 | 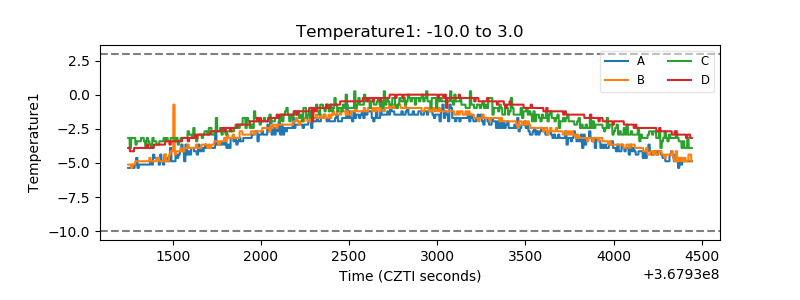 |
| Veto HV Monitor |  |
| Veto LLD | 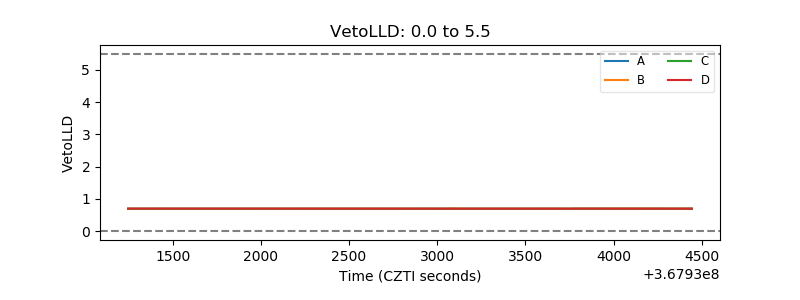 |
| Alpha Counter | 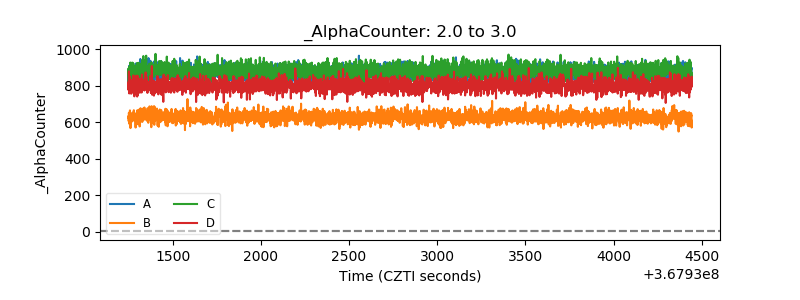 |
| _CPM_Rate | 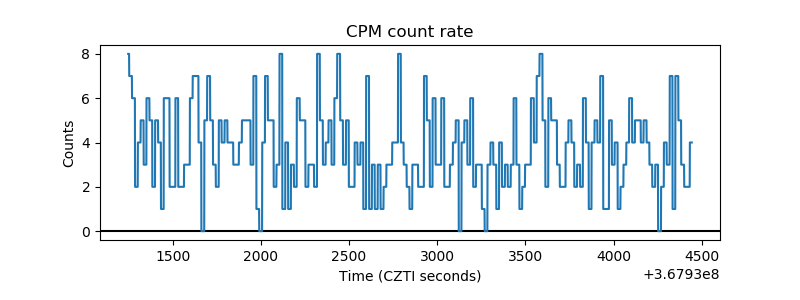 |
| CZT Counter | 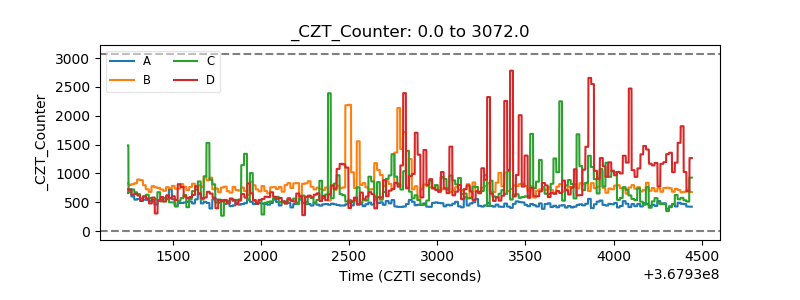 |
| +2.5 Volts monitor |  |
| +5 Volts monitor |  |
| _ROLL_ROT | 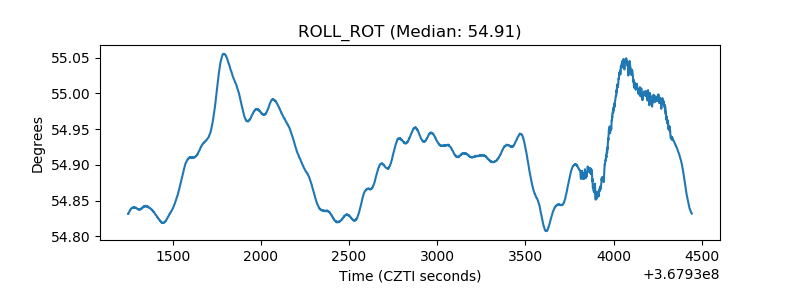 |
| _Roll_DEC | 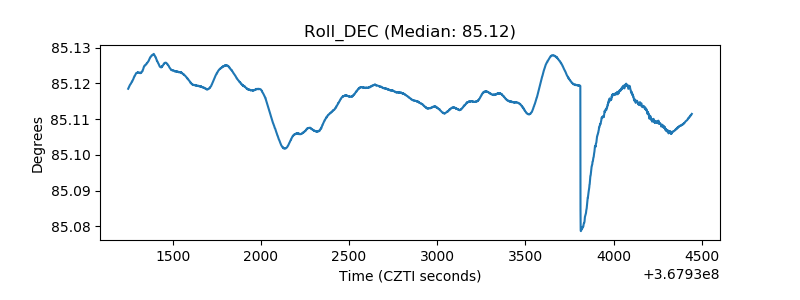 |
| _Roll_RA | 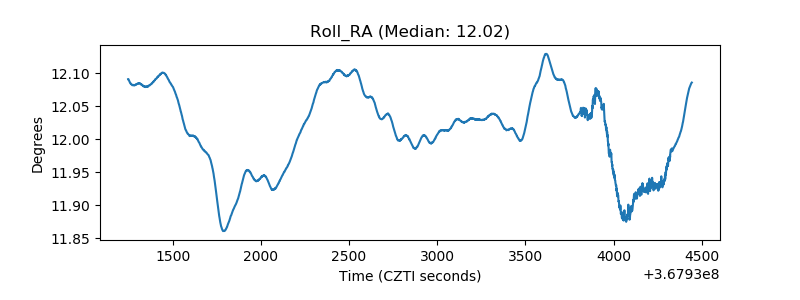 |
| Veto Counter | 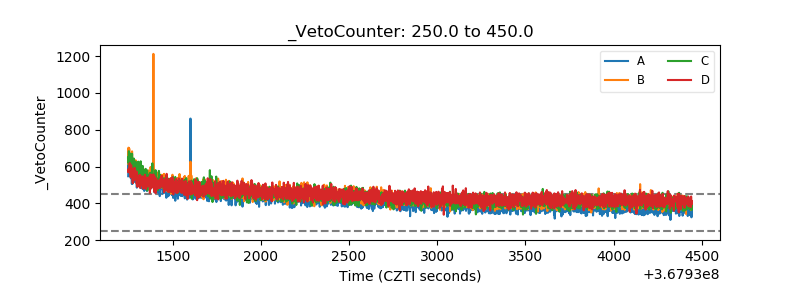 |