| Param | Original file | Final file |
|---|---|---|
| Filename | modeM0/AS1A10_109T01_9000004678cztM0_level2.fits | modeM0/AS1A10_109T01_9000004678cztM0_level2_quad_clean.evt |
| Size (bytes) | 4,699,650,240 | 4,120,099,200 |
| Size | 4.4 GB | 3.8 GB |
| Events in quadrant A | 30,237,080 | 25,862,488 |
| Events in quadrant B | 26,692,282 | 22,271,427 |
| Events in quadrant C | 28,100,628 | 23,275,116 |
| Events in quadrant D | 24,944,773 | 21,053,043 |
| Mode M9 | |||
|---|---|---|---|
| Quadrant | BADHDUFLAG | Total packets | Discarded packets |
| A | 0 | 725 | 0 |
| B | 0 | 725 | 0 |
| C | 0 | 725 | 0 |
| D | 0 | 726 | 0 |
| Mode SS | |||
|---|---|---|---|
| Quadrant | BADHDUFLAG | Total packets | Discarded packets |
| A | 0 | 9602 | 0 |
| B | 0 | 9600 | 0 |
| C | 0 | 9602 | 0 |
| D | 0 | 9604 | 0 |
| Mode M0 | |||
|---|---|---|---|
| Quadrant | BADHDUFLAG | Total packets | Discarded packets |
| A | 0 | 989471 | 0 |
| B | 0 | 1779651 | 0 |
| C | 0 | 1183030 | 0 |
| D | 0 | 1454931 | 0 |
| Quadrant | Total seconds | Saturated seconds | Saturation percentage |
|---|---|---|---|
| A | 471944 | 5188 | 1.099283% |
| B | 471682 | 62200 | 13.186850% |
| C | 471898 | 28178 | 5.971206% |
| D | 471900 | 30833 | 6.533800% |
Noise dominated data is calculated using 1-second bins in cleaned event files. If a bin has >2000 counts, and if more than 50% of those come from <1% of pixels, then it is considered to be noise-dominated and hence unusable.
| Quadrant | # 1 sec bins | Bins with >0 counts | Bins with >2000 counts | High rate bins dominated by noise | Noise dominated (total time) | Noise dominated (detector-on time) | Marked lightcurve |
|---|---|---|---|---|---|---|---|
| A | 560554 | 472141 | 0 | 0 | 0.00% | 0.00% | 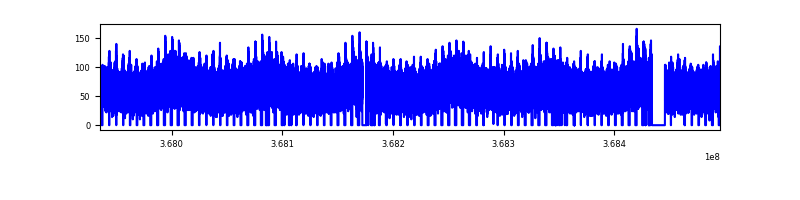 |
| B | 560553 | 471635 | 0 | 0 | 0.00% | 0.00% | 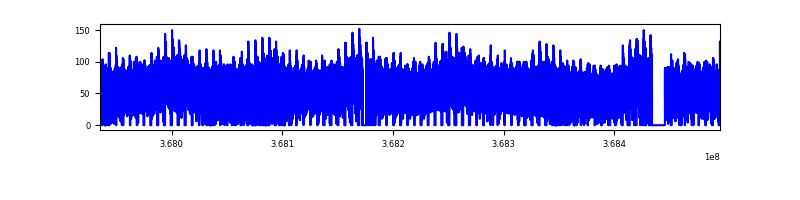 |
| C | 560554 | 471796 | 0 | 0 | 0.00% | 0.00% | 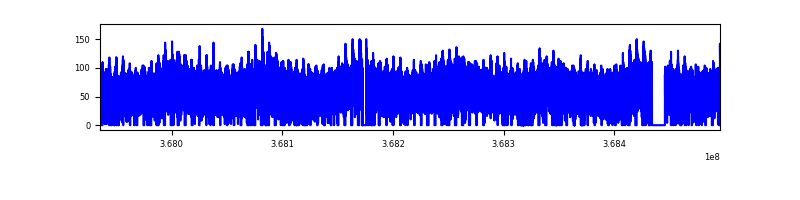 |
| D | 560554 | 471877 | 0 | 0 | 0.00% | 0.00% | 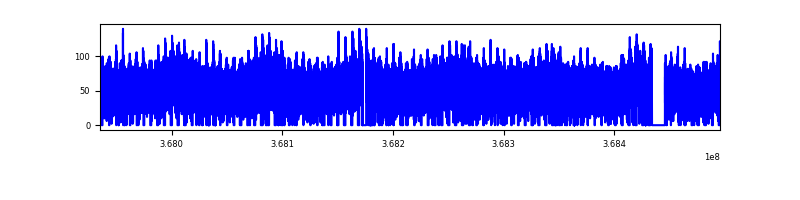 |
Top three noisy pixels from each quadrant. If the there are fewer than three noisy pixels in the level2.evt file, extra rows are filled as -1
| Pixel properties | Quadrant properties | ||||||
|---|---|---|---|---|---|---|---|
| Quadrant | DetID | PixID | Counts | Sigma | Mean | Median | Sigma |
| A | 0 | 29 | 29237 | 11.35 | 7883 | 7441 | 1919.8 |
| A | 7 | 110 | 23958 | 8.6 | 7883 | 7441 | 1919.8 |
| A | 0 | 30 | 23188 | 8.2 | 7883 | 7441 | 1919.8 |
| B | 2 | 9 | 21308 | 10.69 | 7073 | 6786 | 1358.9 |
| B | 2 | 8 | 17922 | 8.19 | 7073 | 6786 | 1358.9 |
| B | 3 | 80 | 17746 | 8.06 | 7073 | 6786 | 1358.9 |
| C | 3 | 187 | 19383 | 6.67 | 7456 | 7015 | 1854.8 |
| C | 12 | 241 | 19298 | 6.62 | 7456 | 7015 | 1854.8 |
| C | 3 | 126 | 18862 | 6.39 | 7456 | 7015 | 1854.8 |
| D | 4 | 246 | 19546 | 6.94 | 7115 | 6493 | 1880.4 |
| D | 10 | 189 | 17981 | 6.11 | 7115 | 6493 | 1880.4 |
| D | 3 | 14 | 17491 | 5.85 | 7115 | 6493 | 1880.4 |
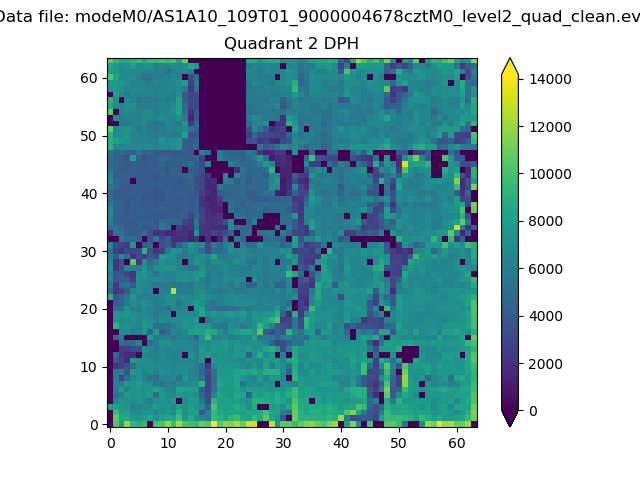
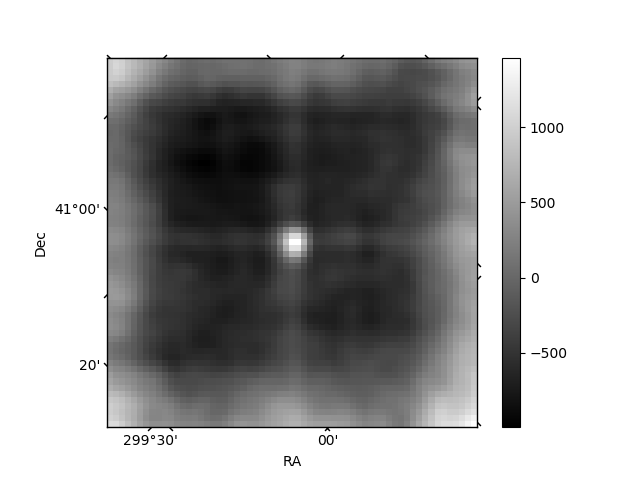
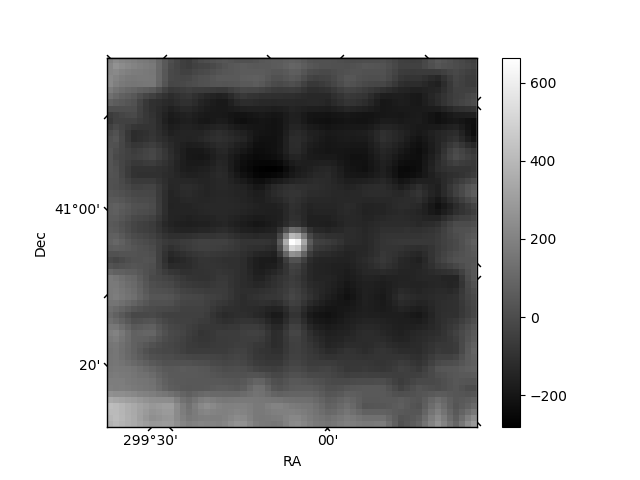
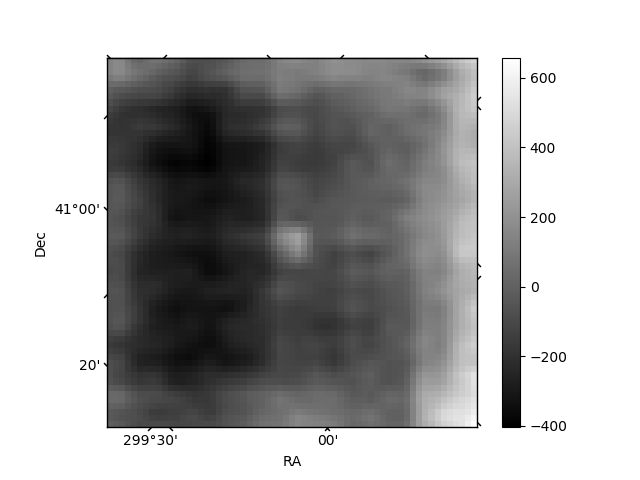
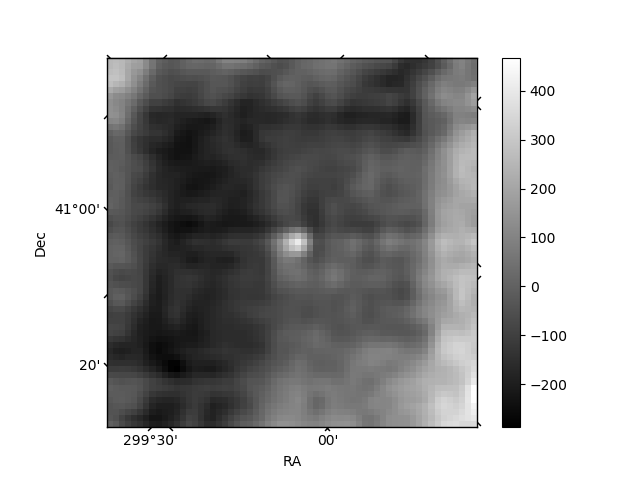
Histogram calculated using DETX and DETY for each event in the final _common_clean file
| Quadrant A | 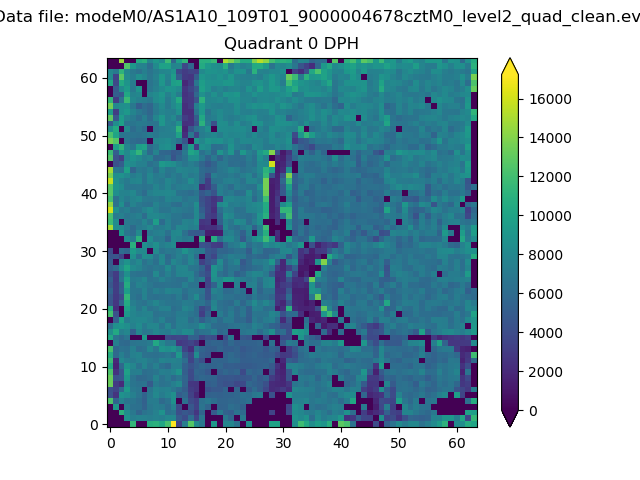 |
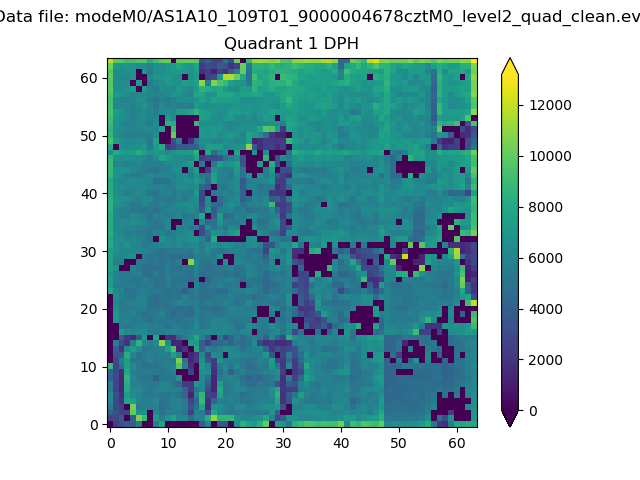 |
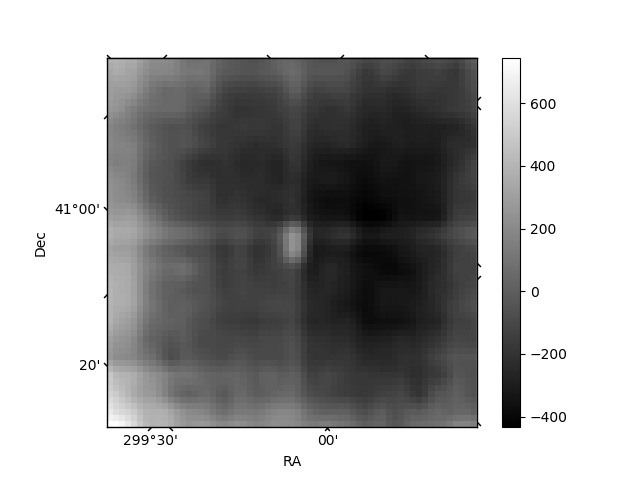
Quadrant B |
|---|---|---|---|
| Quadrant D | 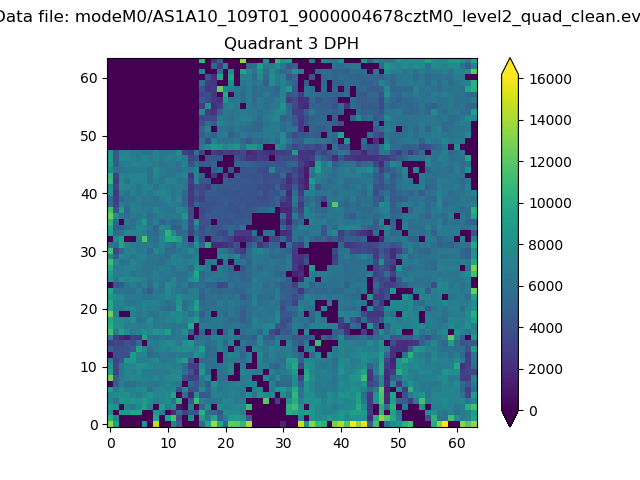 |
 |
Quadrant C |
| Plot type | Count rate plots | Images |
|---|---|---|
| Comparison with Poisson distribution Blue bars denote a histogram of data divided into 1 sec bins. Red curve is a Poisson curve with rate = median count rate of data. |
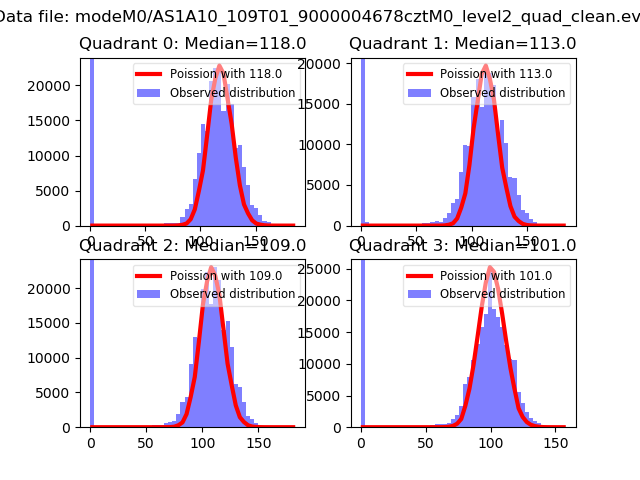 |
 |
| Quadrant-wise count rates Data is divided into 100 sec bins |
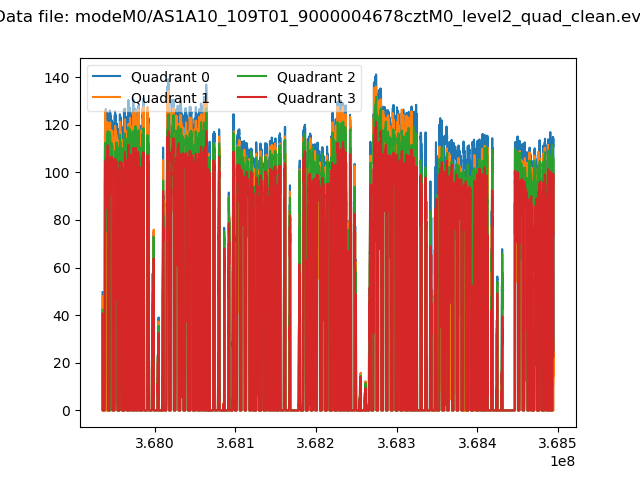 |
|
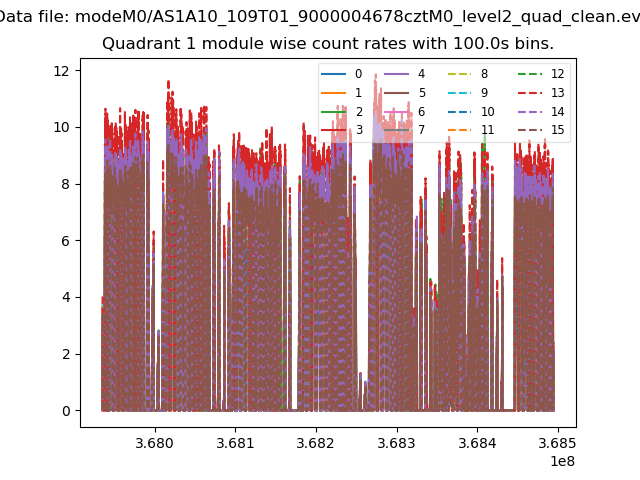
| Module-wise count rates for Quadrant A Data is divided into 100 sec bins |
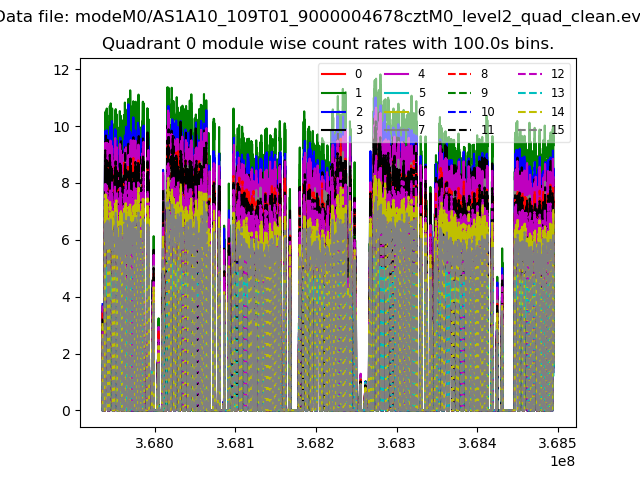 |
 |
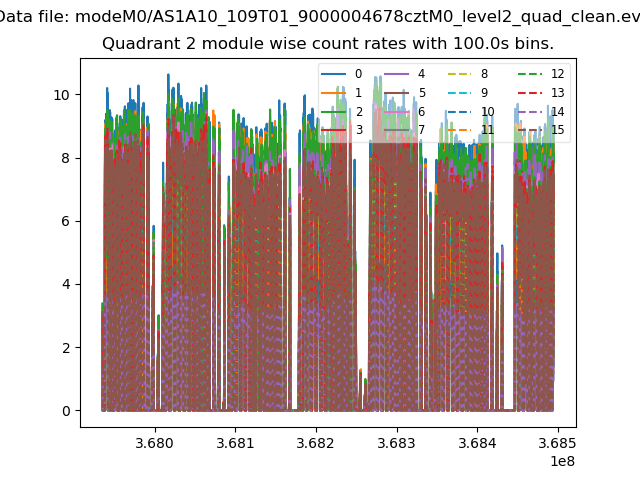
| Module-wise count rates for Quadrant B Data is divided into 100 sec bins |
 |
 |
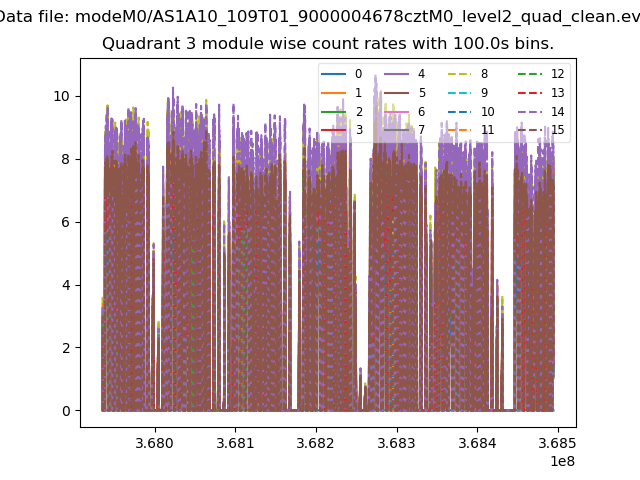
| Module-wise count rates for Quadrant C Data is divided into 100 sec bins |
 |
 |
| Module-wise count rates for Quadrant D Data is divided into 100 sec bins |
 |
 |
| Parameter | Plot |
|---|---|
| CZT HV Monitor | 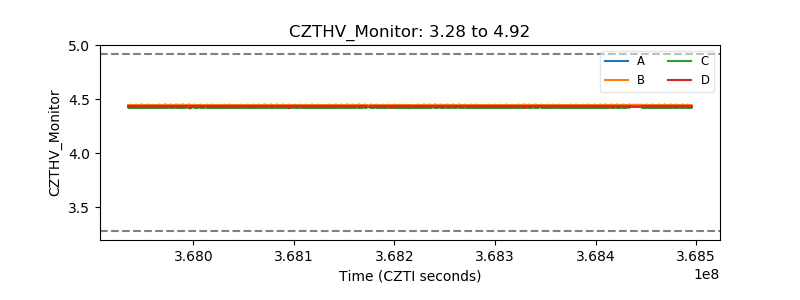 |
| D_VDD | 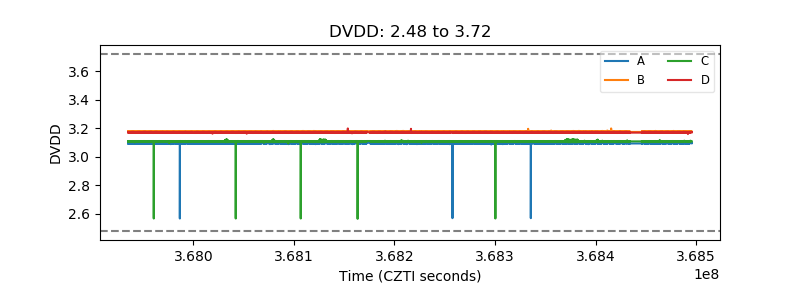 |
| Temperature 1 | 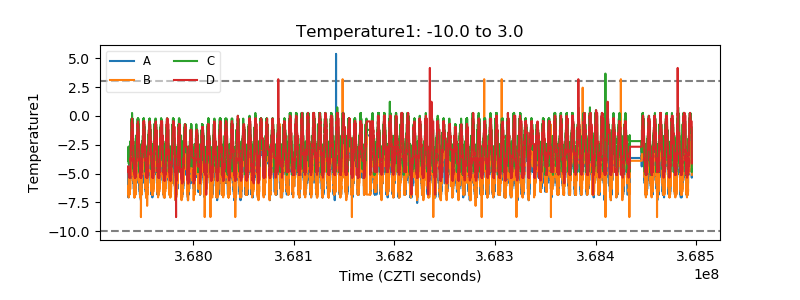 |
| Veto HV Monitor |  |
| Veto LLD | 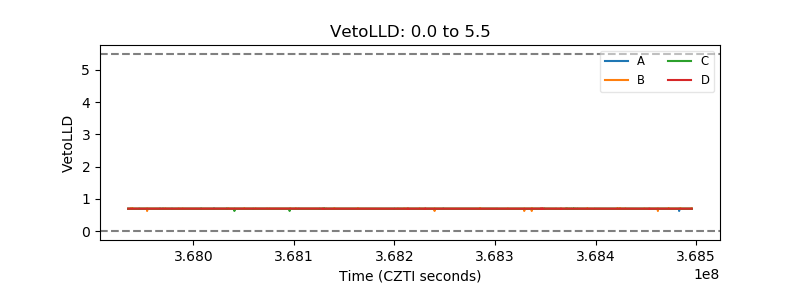 |
| Alpha Counter | 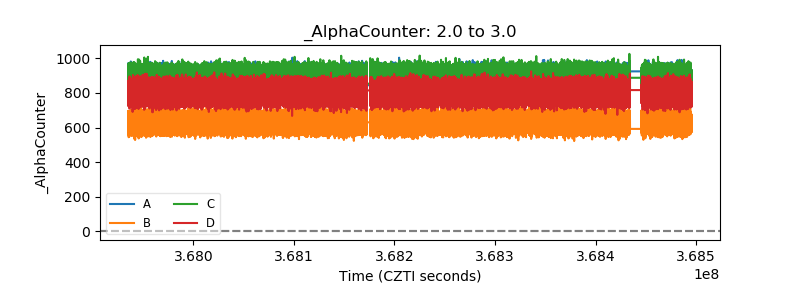 |
| _CPM_Rate | 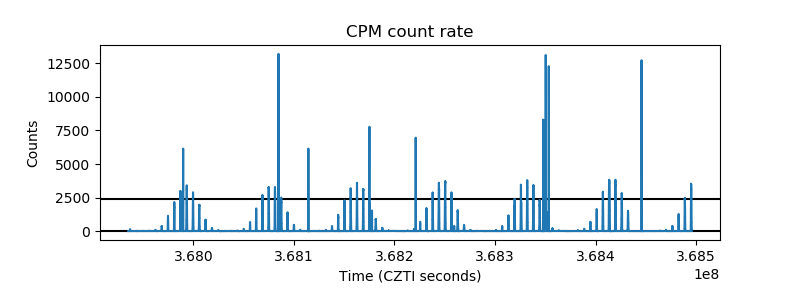 |
| CZT Counter |  |
| +2.5 Volts monitor | 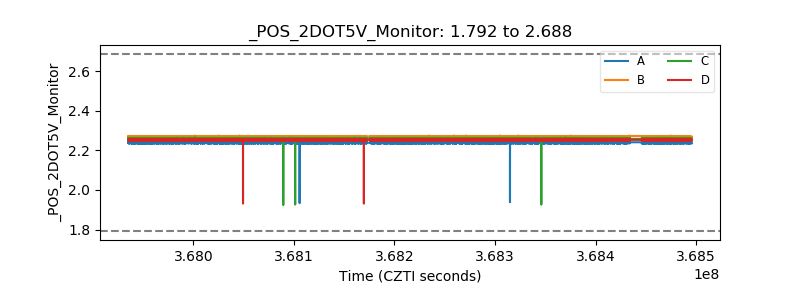 |
| +5 Volts monitor | 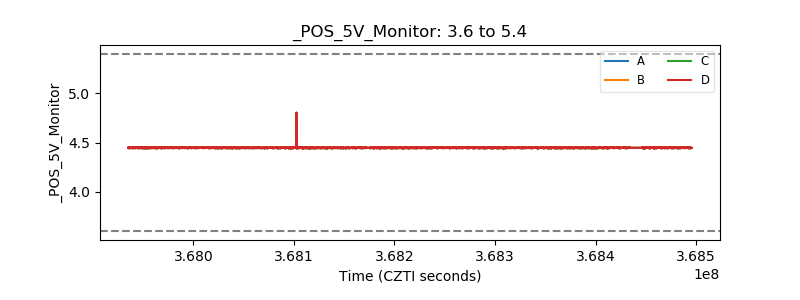 |
| _ROLL_ROT | 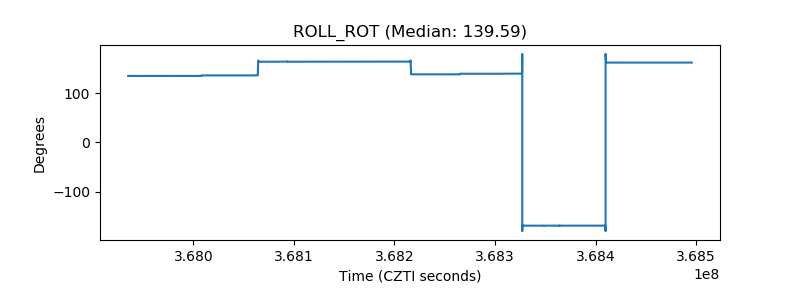 |
| _Roll_DEC | 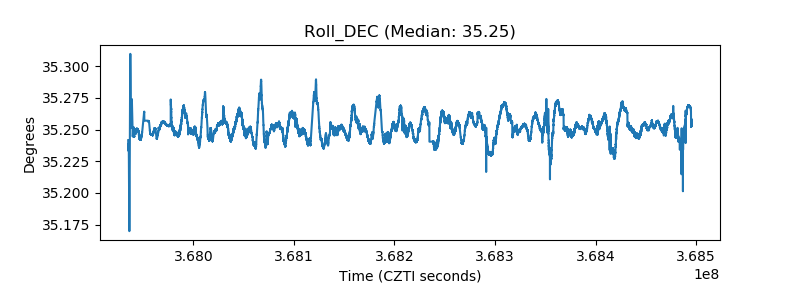 |
| _Roll_RA | 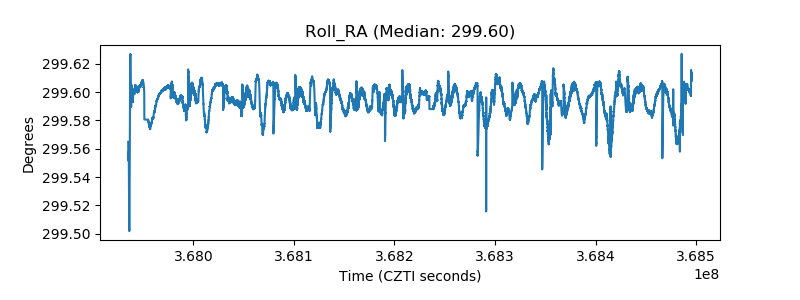 |
| Veto Counter | 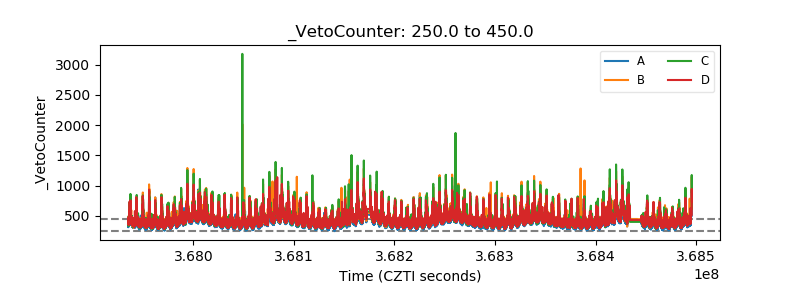 |