| Param | Original file | Final file |
|---|---|---|
| Filename | modeM0/AS1A10_109T01_9000004678_32007cztM0_level2.evt | modeM0/AS1A10_109T01_9000004678_32007cztM0_level2_quad_clean.evt |
| Size (bytes) | 311,503,680 | 41,860,800 |
| Size | 297.1 MB | 39.9 MB |
| Events in quadrant A | 1,620,755 | 273,907 |
| Events in quadrant B | 2,462,423 | 270,017 |
| Events in quadrant C | 2,235,041 | 253,534 |
| Events in quadrant D | 2,904,381 | 249,236 |
| Mode M9 | |||
|---|---|---|---|
| Quadrant | BADHDUFLAG | Total packets | Discarded packets |
| A | 0 | 8 | 0 |
| B | 0 | 8 | 0 |
| C | 0 | 8 | 0 |
| D | 0 | 8 | 0 |
| Mode SS | |||
|---|---|---|---|
| Quadrant | BADHDUFLAG | Total packets | Discarded packets |
| A | 0 | 66 | 0 |
| B | 0 | 66 | 0 |
| C | 0 | 66 | 0 |
| D | 0 | 66 | 0 |
| Mode M0 | |||
|---|---|---|---|
| Quadrant | BADHDUFLAG | Total packets | Discarded packets |
| A | 0 | 6543 | 1 |
| B | 0 | 9520 | 1 |
| C | 0 | 8679 | 1 |
| D | 0 | 10790 | 3 |
| Quadrant | Total seconds | Saturated seconds | Saturation percentage |
|---|---|---|---|
| A | 3092 | 110 | 3.557568% |
| B | 3092 | 187 | 6.047865% |
| C | 3092 | 223 | 7.212160% |
| D | 3091 | 151 | 4.885150% |
Noise dominated data is calculated using 1-second bins in cleaned event files. If a bin has >2000 counts, and if more than 50% of those come from <1% of pixels, then it is considered to be noise-dominated and hence unusable.
| Quadrant | # 1 sec bins | Bins with >0 counts | Bins with >2000 counts | High rate bins dominated by noise | Noise dominated (total time) | Noise dominated (detector-on time) | Marked lightcurve |
|---|---|---|---|---|---|---|---|
| A | 3907 | 3092 | 0 | 0 | 0.00% | 0.00% | 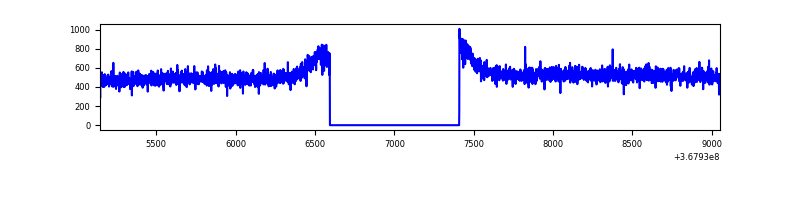 |
| B | 3906 | 3091 | 11 | 11 | 0.28% | 0.36% | 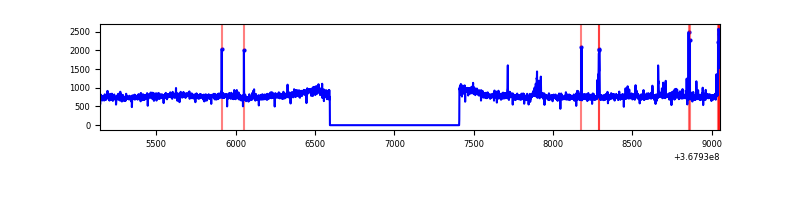 |
| C | 3907 | 3092 | 17 | 17 | 0.44% | 0.55% | 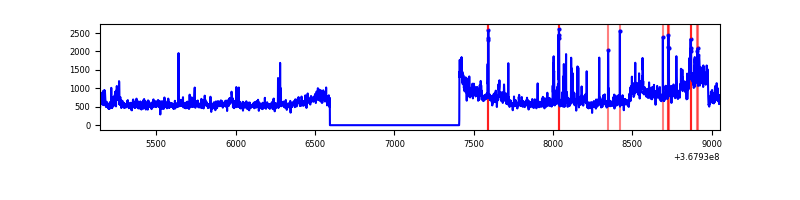 |
| D | 3906 | 3091 | 21 | 21 | 0.54% | 0.68% | 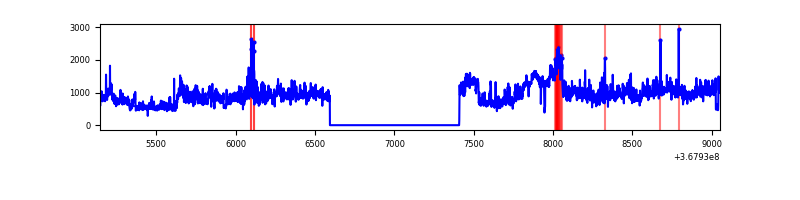 |
Top three noisy pixels from each quadrant. If the there are fewer than three noisy pixels in the level2.evt file, extra rows are filled as -1
| Pixel properties | Quadrant properties | ||||||
|---|---|---|---|---|---|---|---|
| Quadrant | DetID | PixID | Counts | Sigma | Mean | Median | Sigma |
| A | 13 | 254 | 5505 | 59.24 | 419 | 410 | 86.0 |
| A | 3 | 137 | 4320 | 45.46 | 419 | 410 | 86.0 |
| A | 0 | 226 | 3539 | 36.38 | 419 | 410 | 86.0 |
| B | 6 | 159 | 787992 | 9848.1 | 407 | 398 | 80.0 |
| B | 10 | 245 | 41152 | 509.59 | 407 | 398 | 80.0 |
| B | 12 | 111 | 9703 | 116.35 | 407 | 398 | 80.0 |
| C | 3 | 233 | 465149 | 4928.2 | 392 | 395 | 94.3 |
| C | 0 | 10 | 113945 | 1204.07 | 392 | 395 | 94.3 |
| C | 14 | 238 | 67574 | 712.36 | 392 | 395 | 94.3 |
| D | 8 | 195 | 1312251 | 13584.22 | 400 | 389 | 96.6 |
| D | 2 | 250 | 39524 | 405.24 | 400 | 389 | 96.6 |
| D | 13 | 249 | 18214 | 184.58 | 400 | 389 | 96.6 |
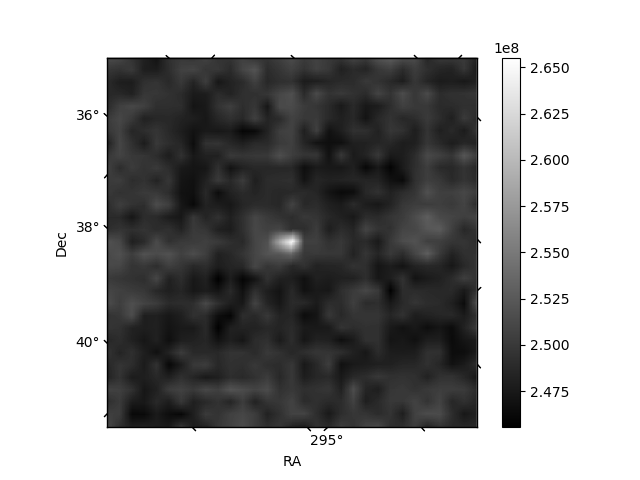
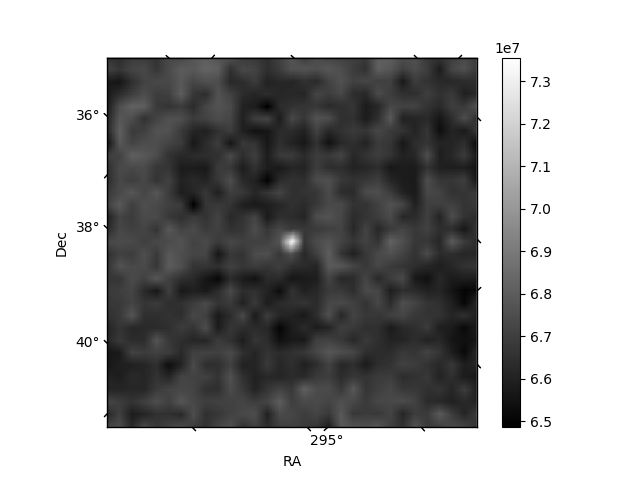
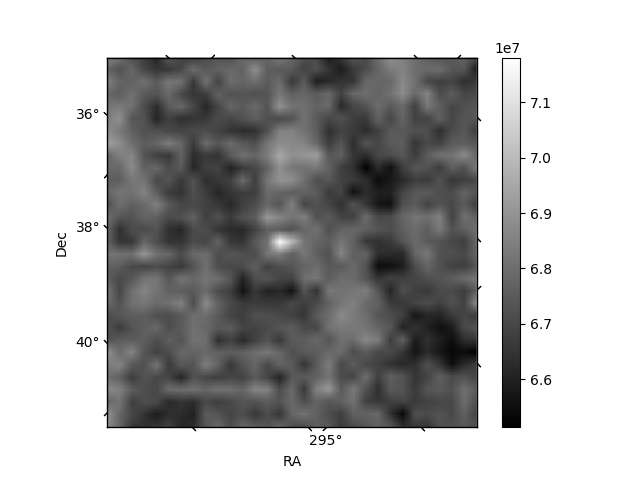
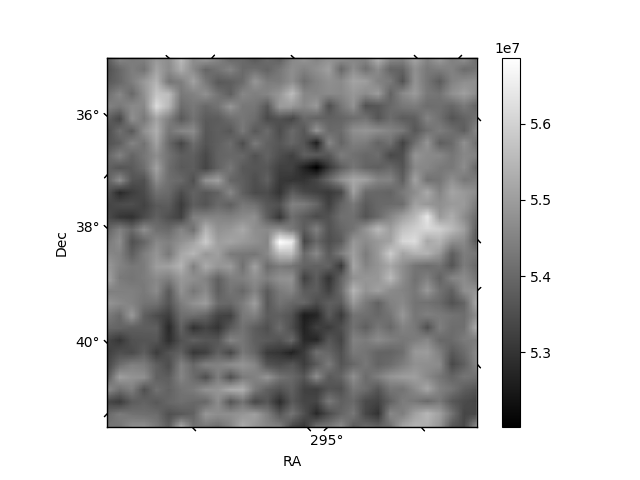
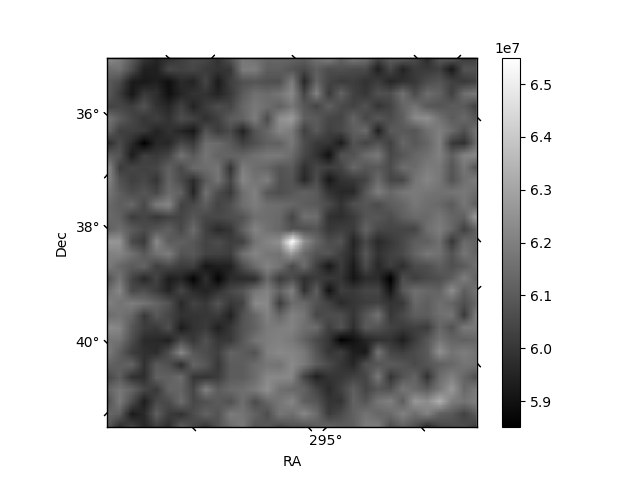
Histogram calculated using DETX and DETY for each event in the final _common_clean file
| Quadrant A | 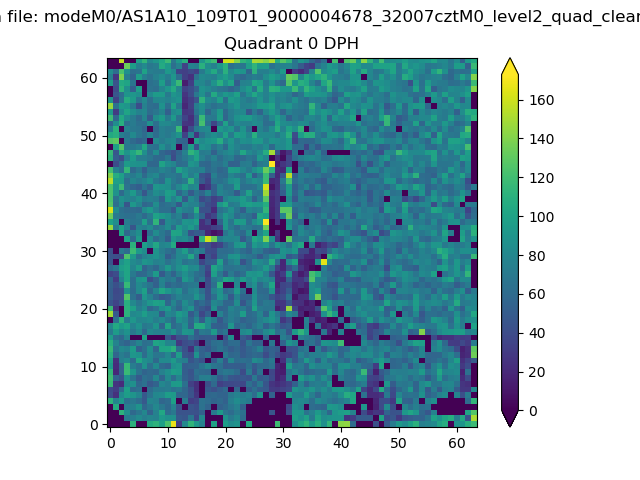 |
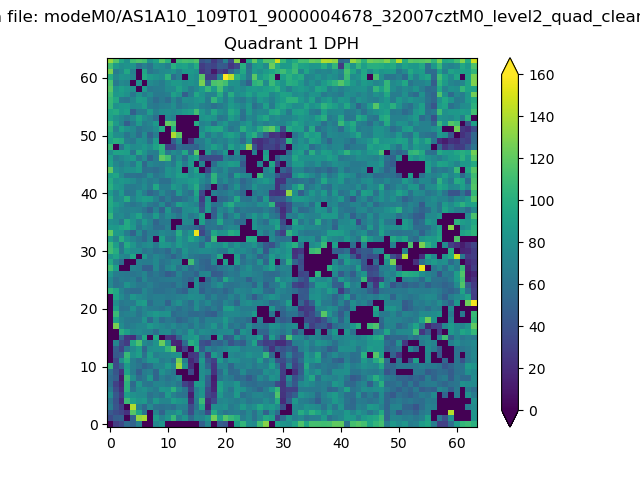 |
Quadrant B |
|---|---|---|---|
| Quadrant D | 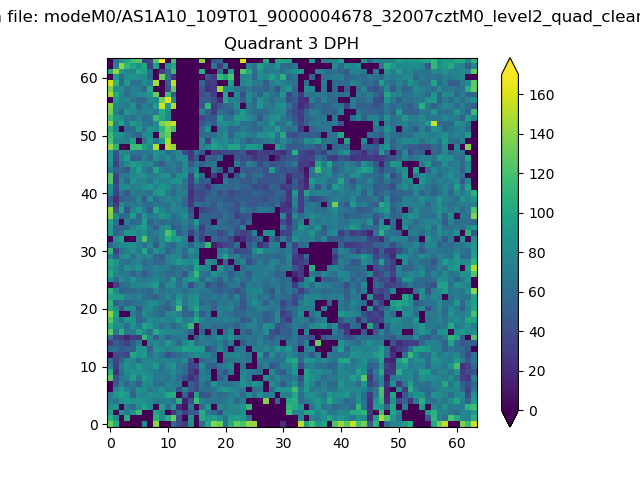 |
 |
Quadrant C |
| Plot type | Count rate plots | Images |
|---|---|---|
| Comparison with Poisson distribution Blue bars denote a histogram of data divided into 1 sec bins. Red curve is a Poisson curve with rate = median count rate of data. |
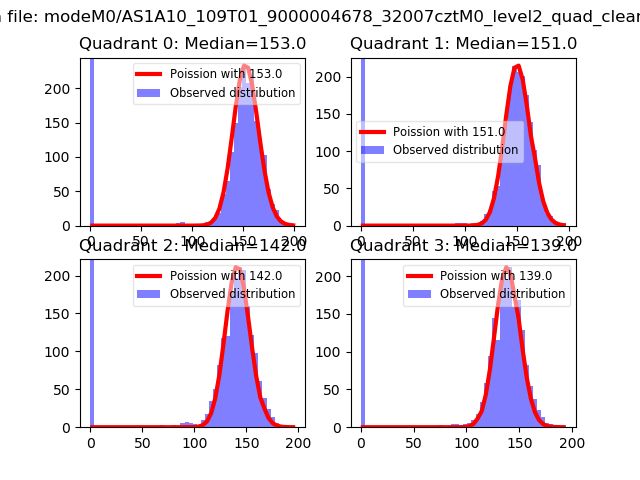 |
 |
| Quadrant-wise count rates Data is divided into 100 sec bins |
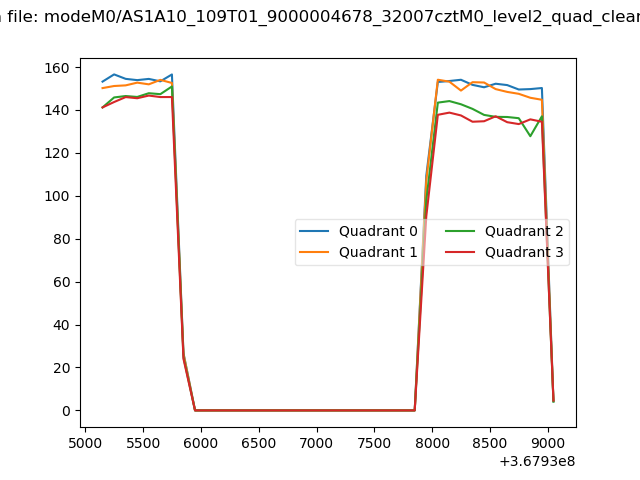 |
|
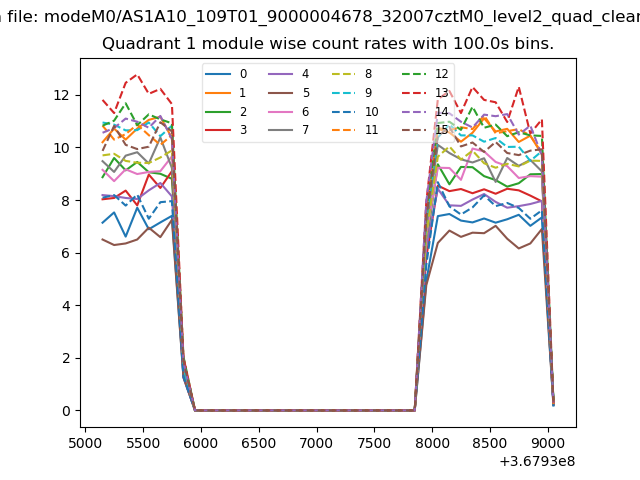
| Module-wise count rates for Quadrant A Data is divided into 100 sec bins |
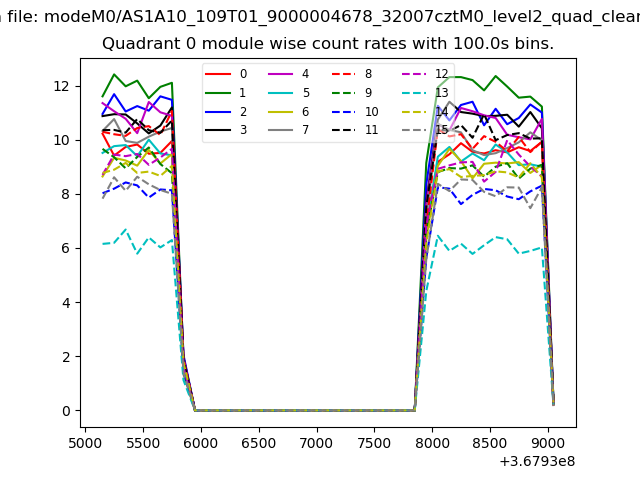 |
 |
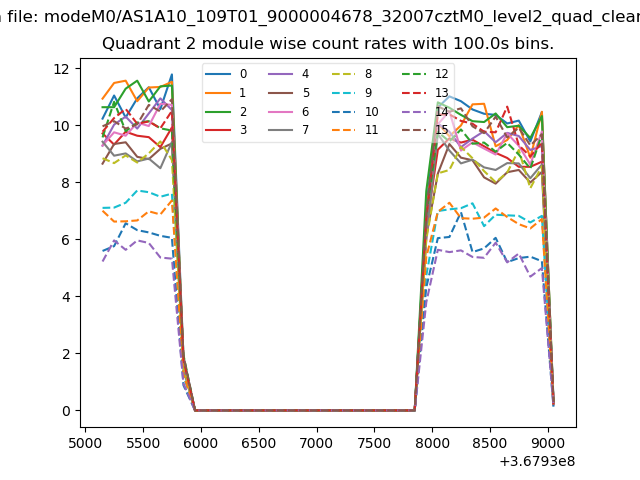
| Module-wise count rates for Quadrant B Data is divided into 100 sec bins |
 |
 |
| Module-wise count rates for Quadrant C Data is divided into 100 sec bins |
 |
 |
| Module-wise count rates for Quadrant D Data is divided into 100 sec bins |
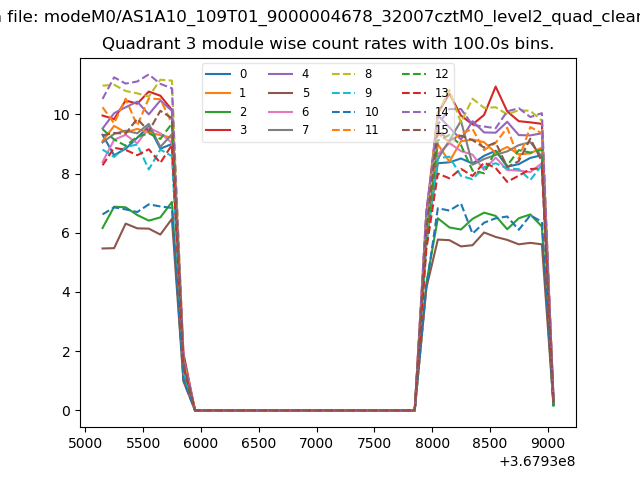 |
 |
| Parameter | Plot |
|---|---|
| CZT HV Monitor | 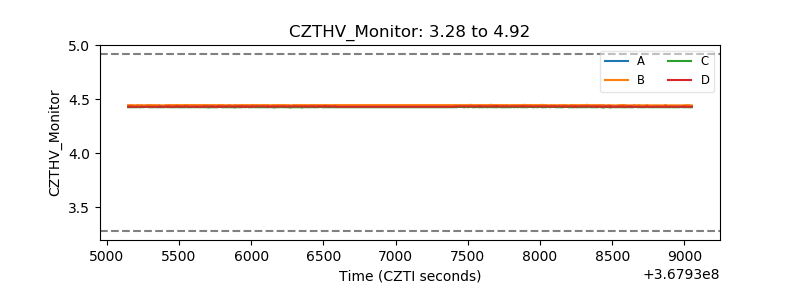 |
| D_VDD | 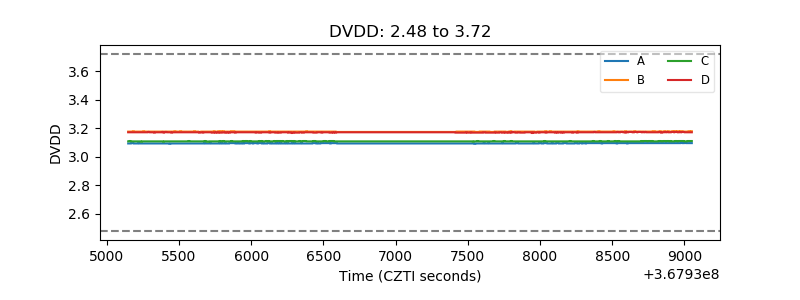 |
| Temperature 1 | 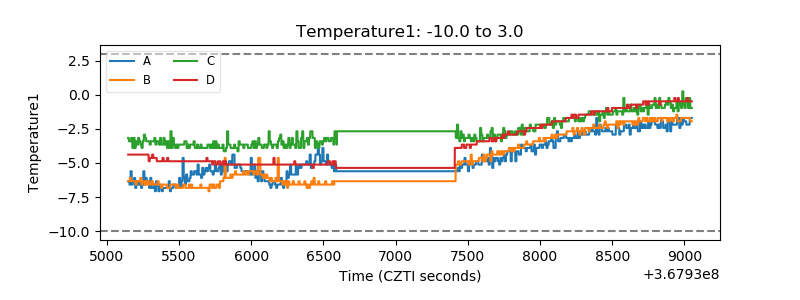 |
| Veto HV Monitor |  |
| Veto LLD | 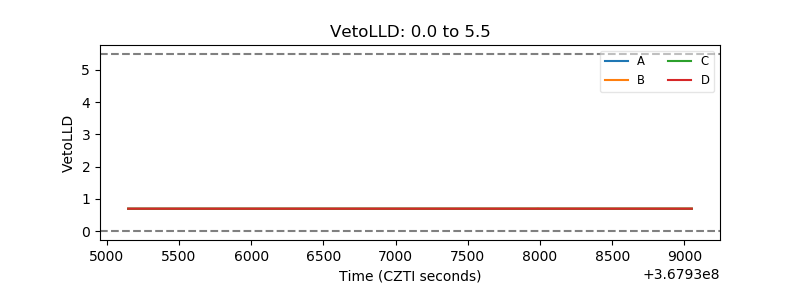 |
| Alpha Counter | 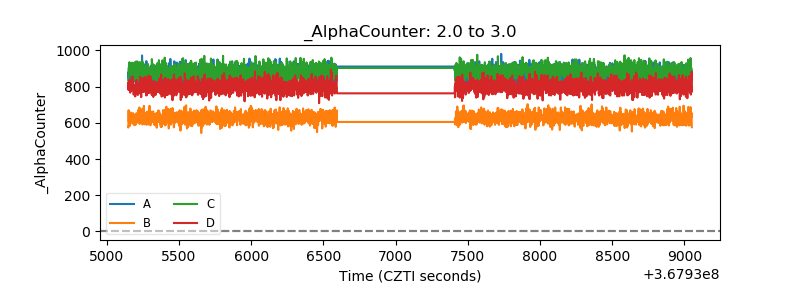 |
| _CPM_Rate | 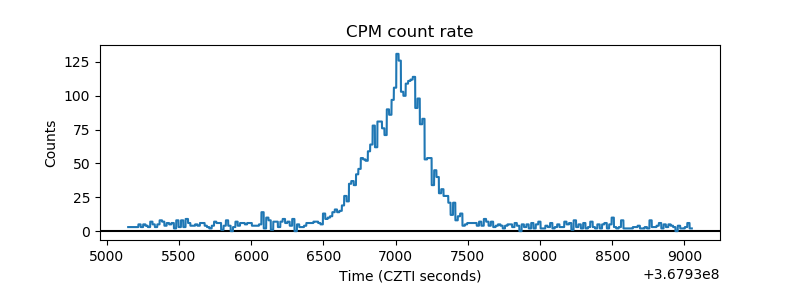 |
| CZT Counter |  |
| +2.5 Volts monitor |  |
| +5 Volts monitor |  |
| _ROLL_ROT | 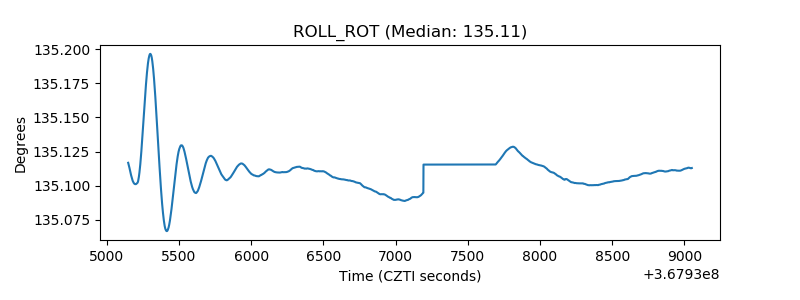 |
| _Roll_DEC | 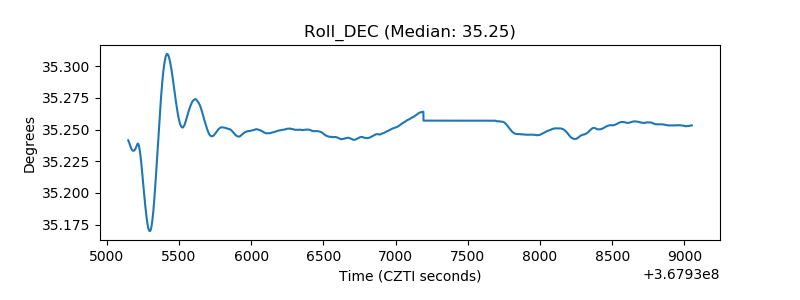 |
| _Roll_RA | 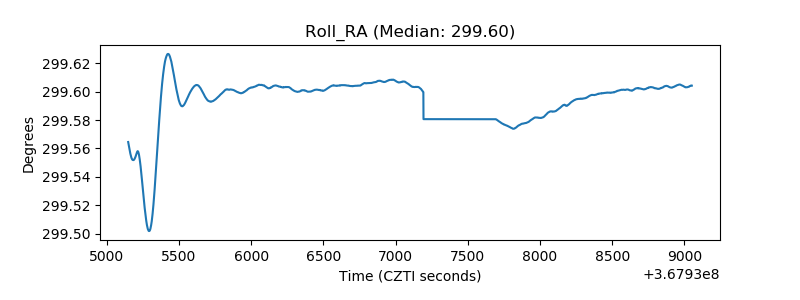 |
| Veto Counter | 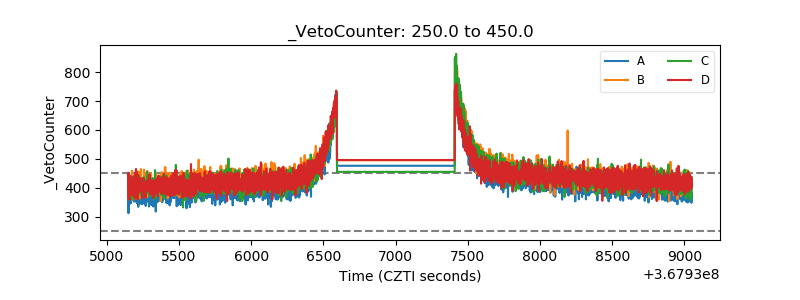 |