| Param | Original file | Final file |
|---|---|---|
| Filename | modeM0/AS1A10_109T01_9000004678_32008cztM0_level2.evt | modeM0/AS1A10_109T01_9000004678_32008cztM0_level2_quad_clean.evt |
| Size (bytes) | 808,367,040 | 109,434,240 |
| Size | 770.9 MB | 104.4 MB |
| Events in quadrant A | 3,598,179 | 772,070 |
| Events in quadrant B | 8,020,273 | 674,098 |
| Events in quadrant C | 5,913,685 | 669,596 |
| Events in quadrant D | 6,462,074 | 695,248 |
| Mode M9 | |||
|---|---|---|---|
| Quadrant | BADHDUFLAG | Total packets | Discarded packets |
| A | 0 | 4 | 0 |
| B | 0 | 4 | 0 |
| C | 0 | 4 | 0 |
| D | 0 | 4 | 0 |
| Mode SS | |||
|---|---|---|---|
| Quadrant | BADHDUFLAG | Total packets | Discarded packets |
| A | 0 | 146 | 0 |
| B | 0 | 146 | 0 |
| C | 0 | 146 | 0 |
| D | 0 | 146 | 0 |
| Mode M0 | |||
|---|---|---|---|
| Quadrant | BADHDUFLAG | Total packets | Discarded packets |
| A | 0 | 14980 | 1 |
| B | 0 | 29078 | 1 |
| C | 0 | 22224 | 1 |
| D | 0 | 24087 | 1 |
| Quadrant | Total seconds | Saturated seconds | Saturation percentage |
|---|---|---|---|
| A | 7219 | 136 | 1.883917% |
| B | 7220 | 1489 | 20.623269% |
| C | 7220 | 1292 | 17.894737% |
| D | 7220 | 264 | 3.656510% |
Noise dominated data is calculated using 1-second bins in cleaned event files. If a bin has >2000 counts, and if more than 50% of those come from <1% of pixels, then it is considered to be noise-dominated and hence unusable.
| Quadrant | # 1 sec bins | Bins with >0 counts | Bins with >2000 counts | High rate bins dominated by noise | Noise dominated (total time) | Noise dominated (detector-on time) | Marked lightcurve |
|---|---|---|---|---|---|---|---|
| A | 7599 | 7219 | 0 | 0 | 0.00% | 0.00% | 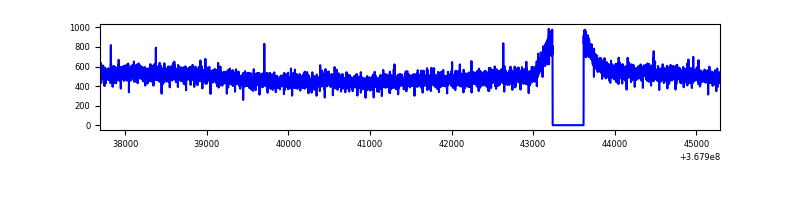 |
| B | 7600 | 7220 | 936 | 936 | 12.32% | 12.96% | 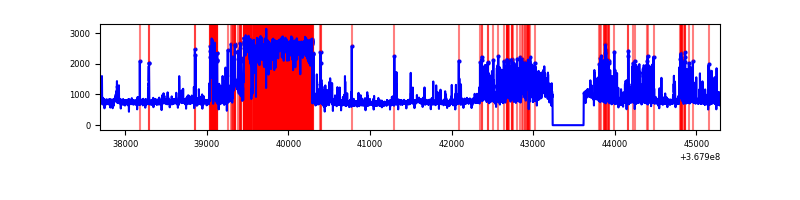 |
| C | 7599 | 7219 | 524 | 524 | 6.90% | 7.26% | 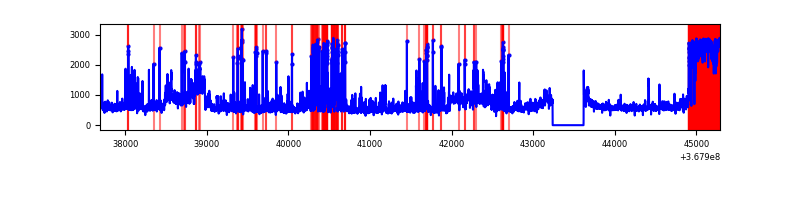 |
| D | 7600 | 7220 | 97 | 97 | 1.28% | 1.34% | 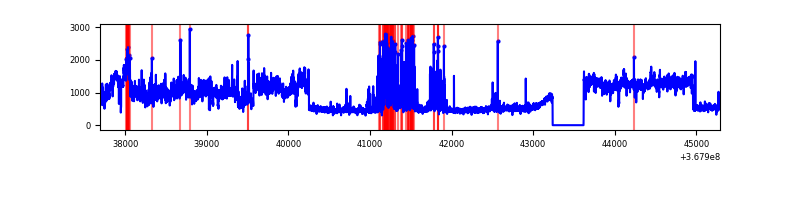 |
Top three noisy pixels from each quadrant. If the there are fewer than three noisy pixels in the level2.evt file, extra rows are filled as -1
| Pixel properties | Quadrant properties | ||||||
|---|---|---|---|---|---|---|---|
| Quadrant | DetID | PixID | Counts | Sigma | Mean | Median | Sigma |
| A | 13 | 254 | 13614 | 67.93 | 928 | 911 | 187.0 |
| A | 13 | 6 | 10380 | 50.64 | 928 | 911 | 187.0 |
| A | 3 | 137 | 9263 | 44.66 | 928 | 911 | 187.0 |
| B | 10 | 245 | 2113871 | 13167.59 | 832 | 813 | 160.5 |
| B | 6 | 159 | 1724006 | 10738.13 | 832 | 813 | 160.5 |
| B | 12 | 18 | 763128 | 4750.39 | 832 | 813 | 160.5 |
| C | 10 | 22 | 834843 | 4280.27 | 823 | 829 | 194.9 |
| C | 3 | 233 | 718834 | 3684.89 | 823 | 829 | 194.9 |
| C | 0 | 10 | 697805 | 3576.97 | 823 | 829 | 194.9 |
| D | 8 | 195 | 2566960 | 12033.53 | 892 | 870 | 213.2 |
| D | 2 | 250 | 440864 | 2063.33 | 892 | 870 | 213.2 |
| D | 10 | 253 | 47886 | 220.48 | 892 | 870 | 213.2 |
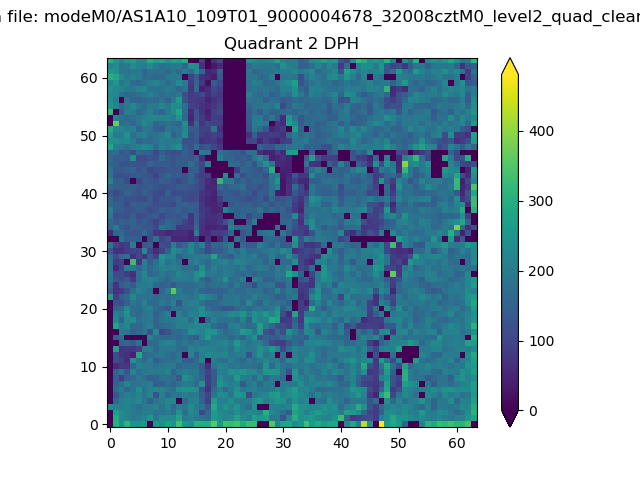
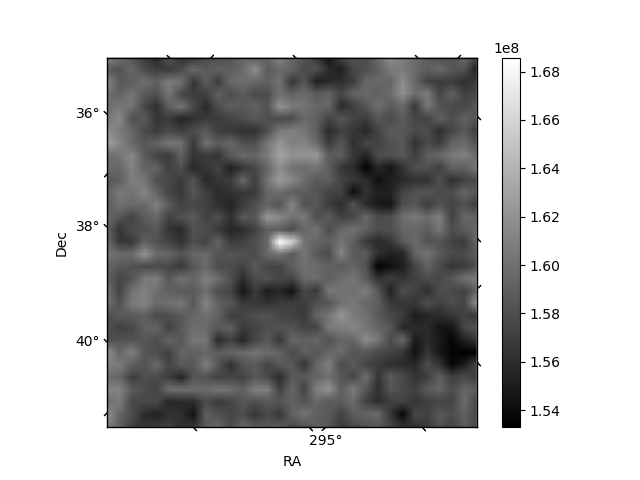
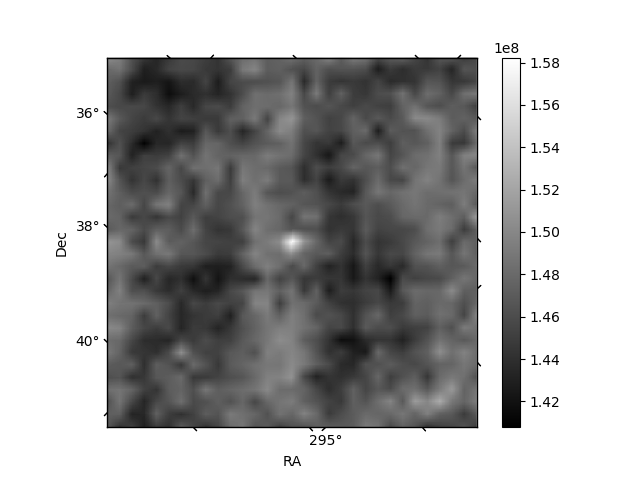
Histogram calculated using DETX and DETY for each event in the final _common_clean file
| Quadrant A | 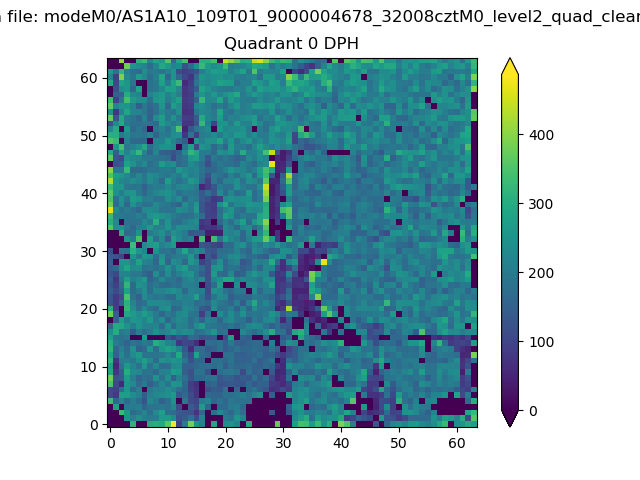 |
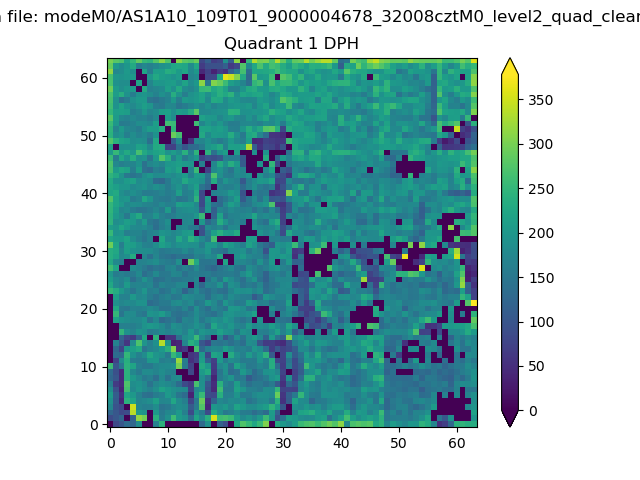 |
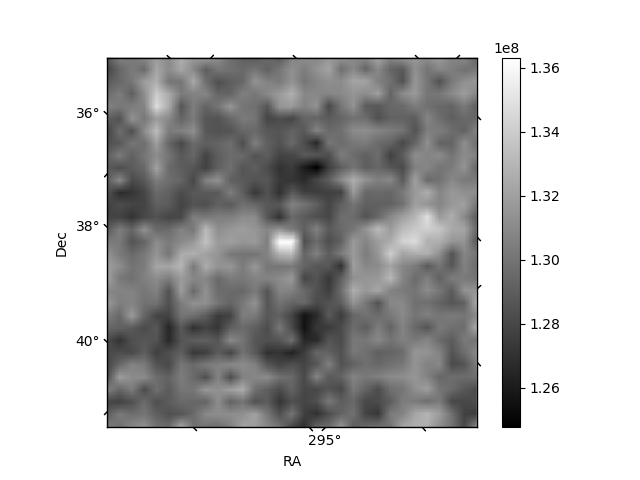
Quadrant B |
|---|---|---|---|
| Quadrant D | 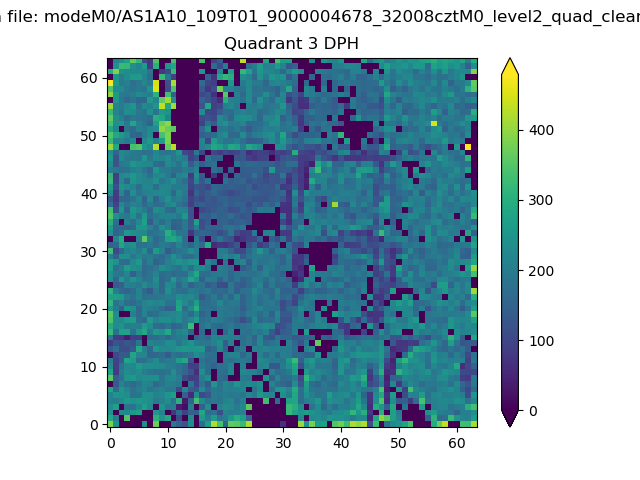 |
 |
Quadrant C |
| Plot type | Count rate plots | Images |
|---|---|---|
| Comparison with Poisson distribution Blue bars denote a histogram of data divided into 1 sec bins. Red curve is a Poisson curve with rate = median count rate of data. |
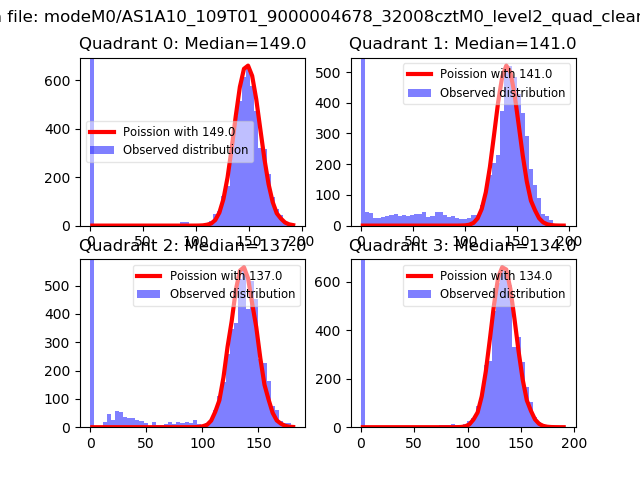 |
 |
| Quadrant-wise count rates Data is divided into 100 sec bins |
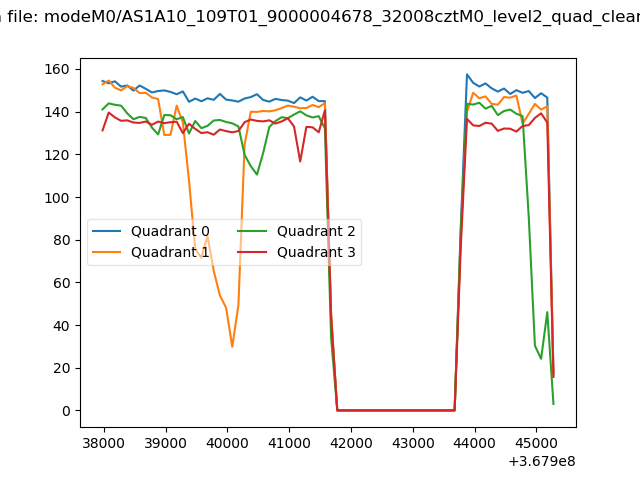 |
|
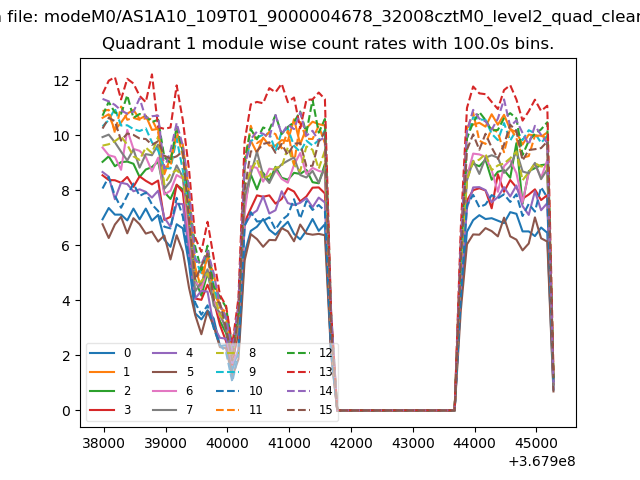
| Module-wise count rates for Quadrant A Data is divided into 100 sec bins |
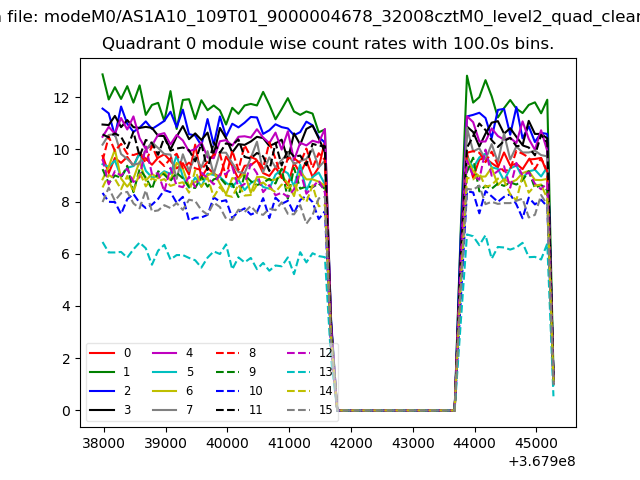 |
 |
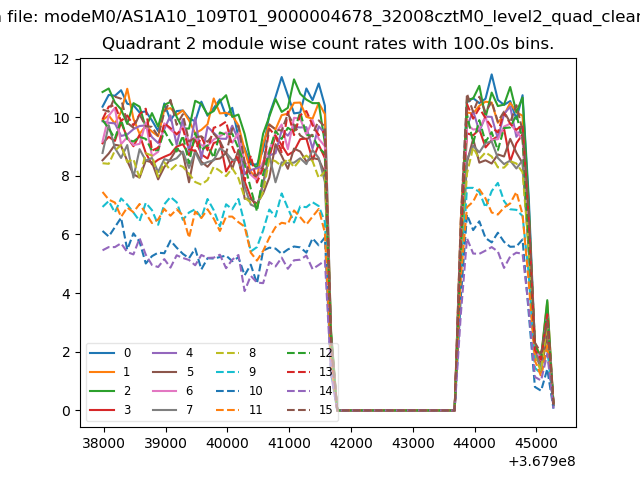
| Module-wise count rates for Quadrant B Data is divided into 100 sec bins |
 |
 |
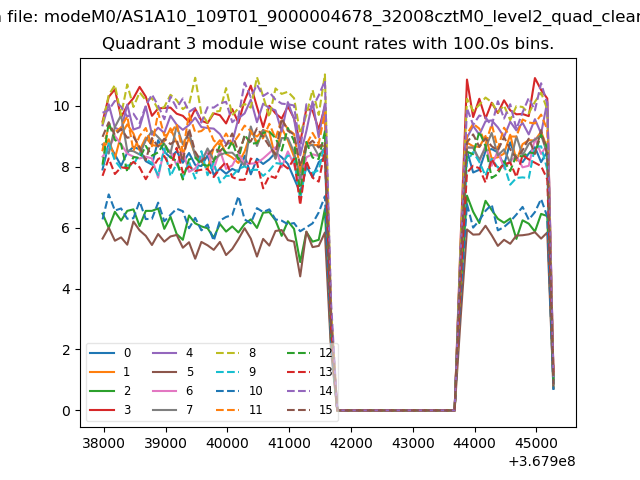
| Module-wise count rates for Quadrant C Data is divided into 100 sec bins |
 |
 |
| Module-wise count rates for Quadrant D Data is divided into 100 sec bins |
 |
 |
| Parameter | Plot |
|---|---|
| CZT HV Monitor | 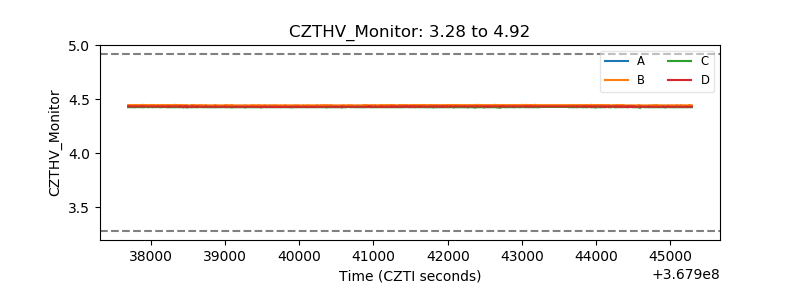 |
| D_VDD |  |
| Temperature 1 | 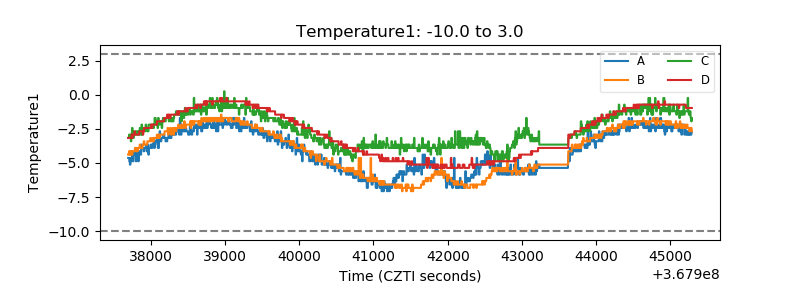 |
| Veto HV Monitor | 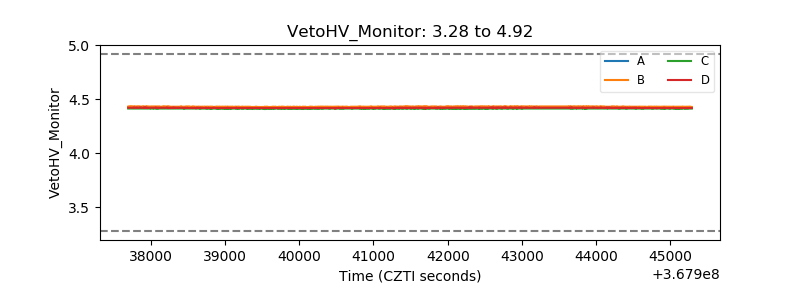 |
| Veto LLD | 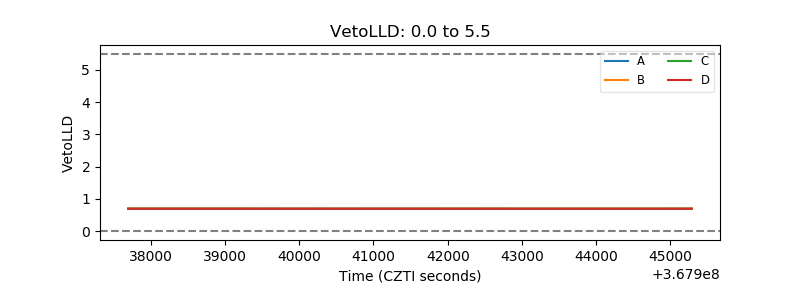 |
| Alpha Counter | 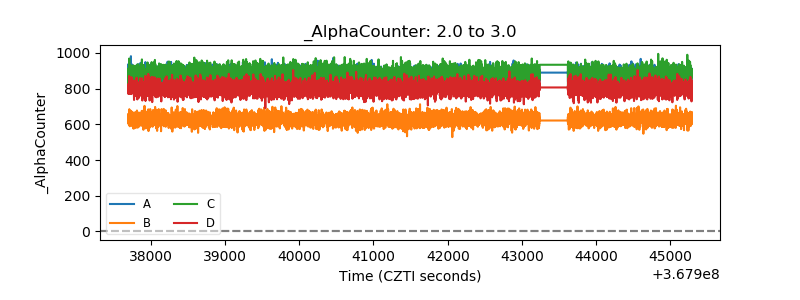 |
| _CPM_Rate | 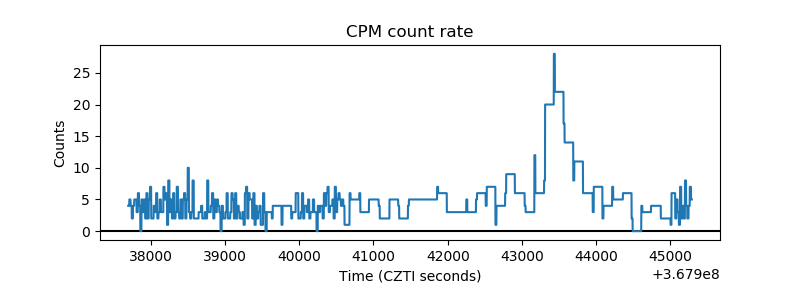 |
| CZT Counter | 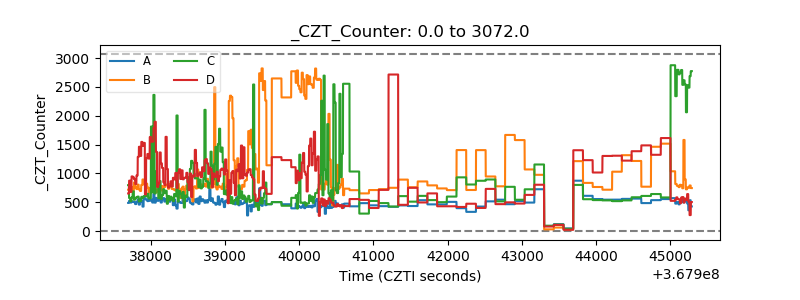 |
| +2.5 Volts monitor |  |
| +5 Volts monitor |  |
| _ROLL_ROT | 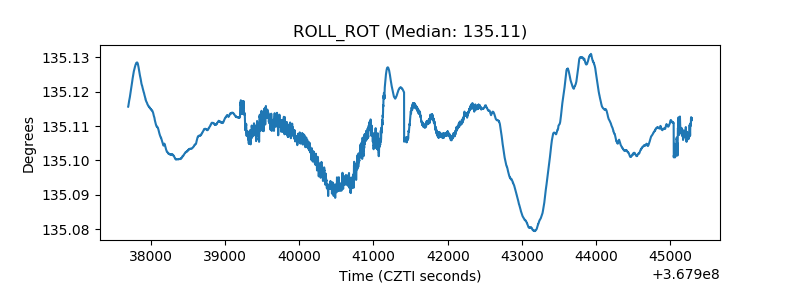 |
| _Roll_DEC | 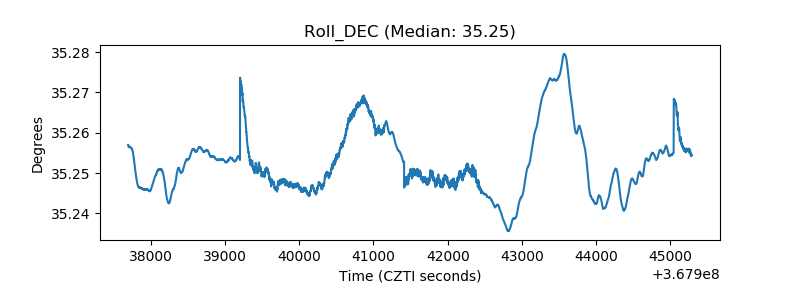 |
| _Roll_RA |  |
| Veto Counter | 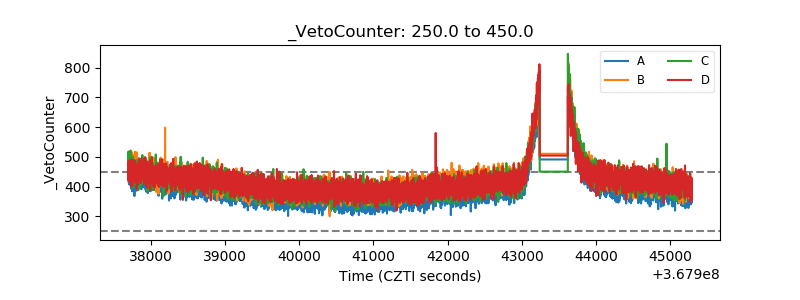 |