| Param | Original file | Final file |
|---|---|---|
| Filename | modeM0/AS1A10_109T01_9000004678_32009cztM0_level2.evt | modeM0/AS1A10_109T01_9000004678_32009cztM0_level2_quad_clean.evt |
| Size (bytes) | 805,795,200 | 103,576,320 |
| Size | 768.5 MB | 98.8 MB |
| Events in quadrant A | 3,507,706 | 725,859 |
| Events in quadrant B | 6,747,777 | 693,412 |
| Events in quadrant C | 8,471,474 | 560,936 |
| Events in quadrant D | 5,200,498 | 664,132 |
| Mode M9 | |||
|---|---|---|---|
| Quadrant | BADHDUFLAG | Total packets | Discarded packets |
| A | 0 | 2 | 0 |
| B | 0 | 2 | 0 |
| C | 0 | 2 | 0 |
| D | 0 | 2 | 0 |
| Mode SS | |||
|---|---|---|---|
| Quadrant | BADHDUFLAG | Total packets | Discarded packets |
| A | 0 | 144 | 0 |
| B | 0 | 144 | 0 |
| C | 0 | 144 | 0 |
| D | 0 | 144 | 0 |
| Mode M0 | |||
|---|---|---|---|
| Quadrant | BADHDUFLAG | Total packets | Discarded packets |
| A | 0 | 14774 | 1 |
| B | 0 | 25178 | 1 |
| C | 0 | 30118 | 1 |
| D | 0 | 20056 | 2 |
| Quadrant | Total seconds | Saturated seconds | Saturation percentage |
|---|---|---|---|
| A | 7055 | 130 | 1.842665% |
| B | 7055 | 658 | 9.326719% |
| C | 7055 | 2104 | 29.822821% |
| D | 7054 | 184 | 2.608449% |
Noise dominated data is calculated using 1-second bins in cleaned event files. If a bin has >2000 counts, and if more than 50% of those come from <1% of pixels, then it is considered to be noise-dominated and hence unusable.
| Quadrant | # 1 sec bins | Bins with >0 counts | Bins with >2000 counts | High rate bins dominated by noise | Noise dominated (total time) | Noise dominated (detector-on time) | Marked lightcurve |
|---|---|---|---|---|---|---|---|
| A | 7225 | 7055 | 0 | 0 | 0.00% | 0.00% | 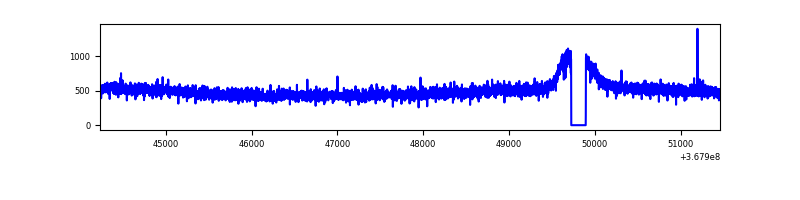 |
| B | 7225 | 7055 | 186 | 186 | 2.57% | 2.64% | 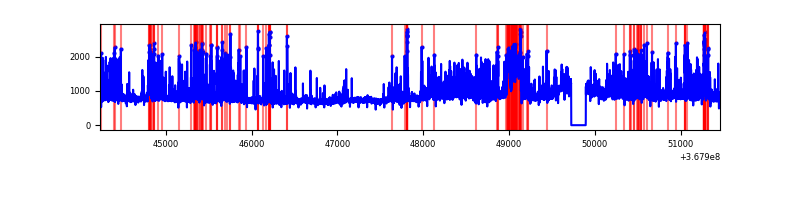 |
| C | 7225 | 7055 | 1070 | 1070 | 14.81% | 15.17% | 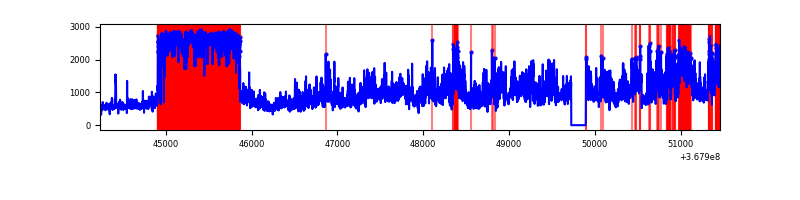 |
| D | 7224 | 7054 | 59 | 59 | 0.82% | 0.84% | 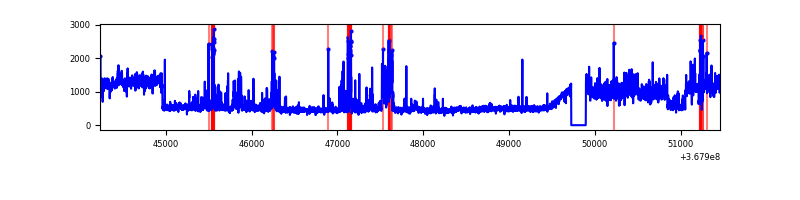 |
Top three noisy pixels from each quadrant. If the there are fewer than three noisy pixels in the level2.evt file, extra rows are filled as -1
| Pixel properties | Quadrant properties | ||||||
|---|---|---|---|---|---|---|---|
| Quadrant | DetID | PixID | Counts | Sigma | Mean | Median | Sigma |
| A | 13 | 6 | 13642 | 69.6 | 905 | 888 | 183.3 |
| A | 13 | 254 | 13068 | 66.47 | 905 | 888 | 183.3 |
| A | 3 | 137 | 9091 | 44.76 | 905 | 888 | 183.3 |
| B | 6 | 159 | 1845481 | 10968.72 | 865 | 843 | 168.2 |
| B | 12 | 18 | 1026471 | 6098.66 | 865 | 843 | 168.2 |
| B | 10 | 247 | 165386 | 978.42 | 865 | 843 | 168.2 |
| C | 3 | 233 | 2840261 | 16121.02 | 748 | 755 | 176.1 |
| C | 10 | 22 | 2136019 | 12122.76 | 748 | 755 | 176.1 |
| C | 14 | 238 | 234679 | 1328.08 | 748 | 755 | 176.1 |
| D | 8 | 195 | 1348171 | 6412.4 | 873 | 849 | 210.1 |
| D | 2 | 250 | 424872 | 2018.08 | 873 | 849 | 210.1 |
| D | 13 | 249 | 64135 | 301.2 | 873 | 849 | 210.1 |
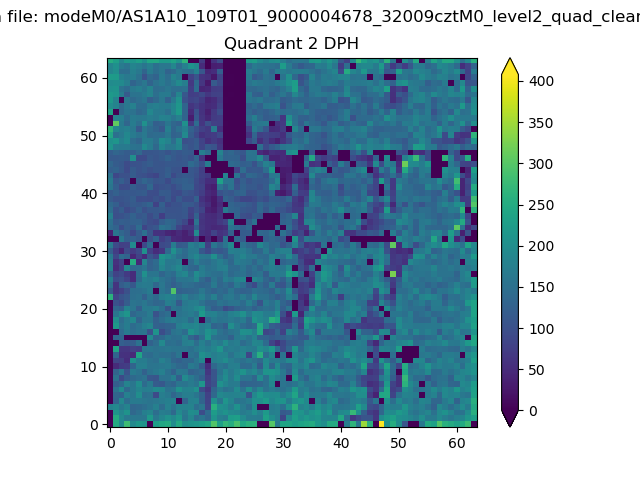
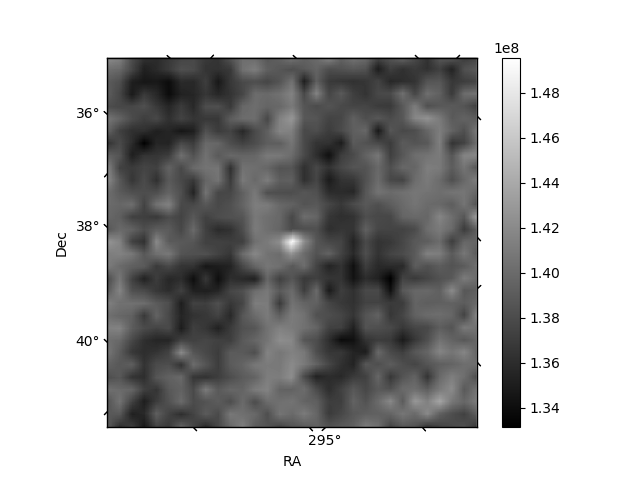
Histogram calculated using DETX and DETY for each event in the final _common_clean file
| Quadrant A | 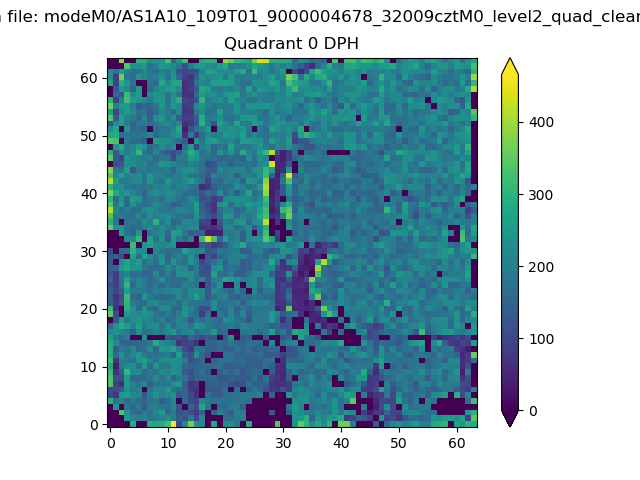 |
 |
Quadrant B |
|---|---|---|---|
| Quadrant D |  |
 |
Quadrant C |
| Plot type | Count rate plots | Images |
|---|---|---|
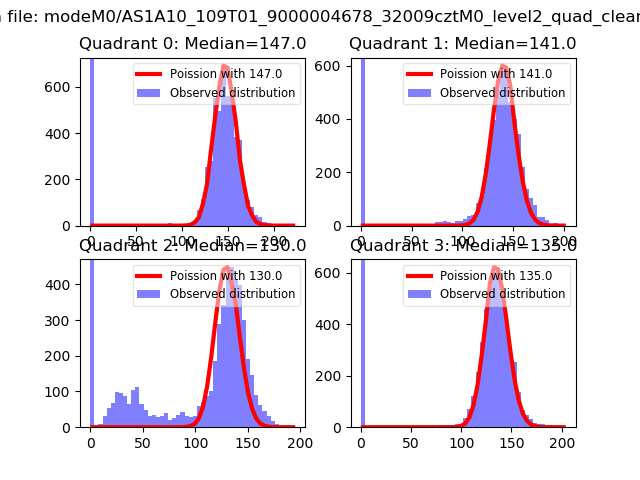
| Comparison with Poisson distribution Blue bars denote a histogram of data divided into 1 sec bins. Red curve is a Poisson curve with rate = median count rate of data. |
 |
 |
| Quadrant-wise count rates Data is divided into 100 sec bins |
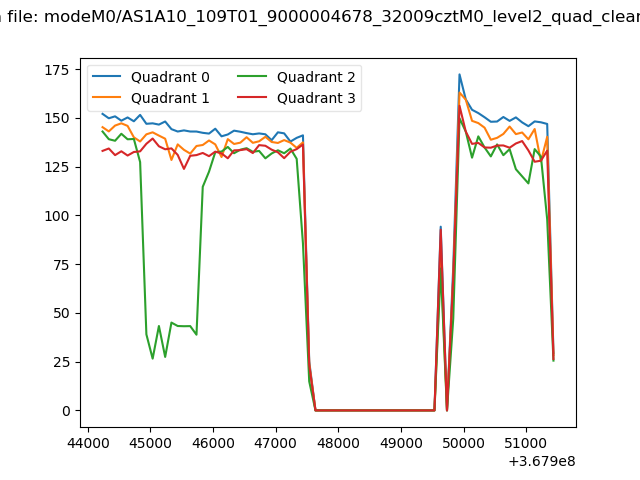 |
|
| Module-wise count rates for Quadrant A Data is divided into 100 sec bins |
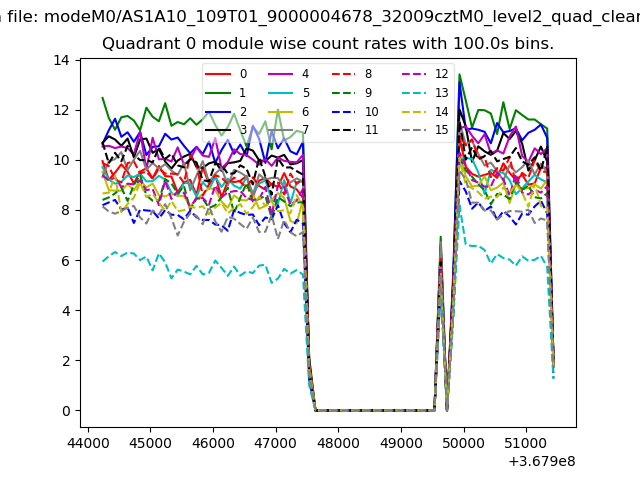 |
 |
| Module-wise count rates for Quadrant B Data is divided into 100 sec bins |
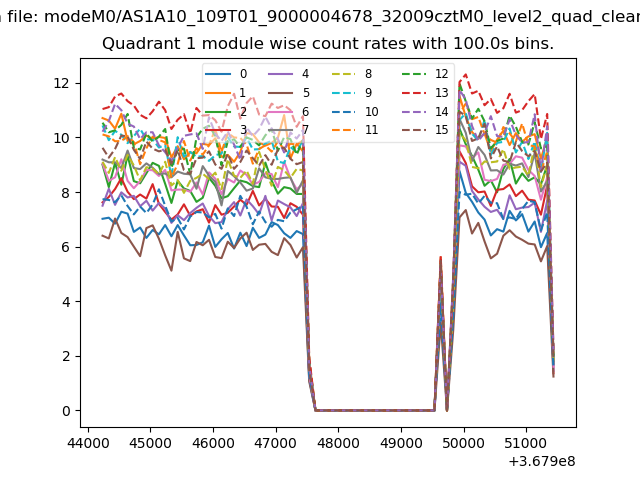 |
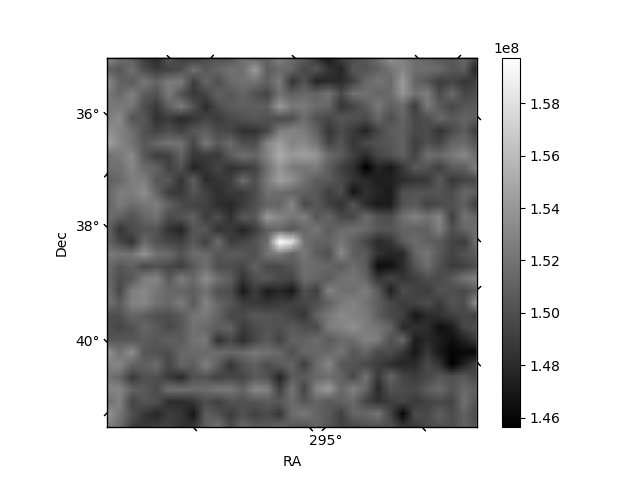 |
| Module-wise count rates for Quadrant C Data is divided into 100 sec bins |
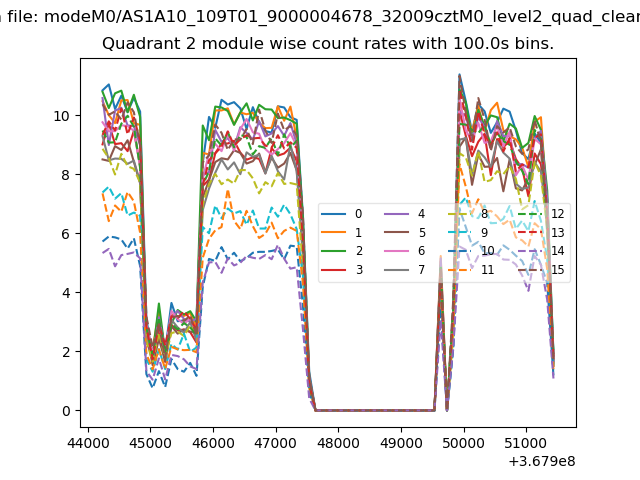 |
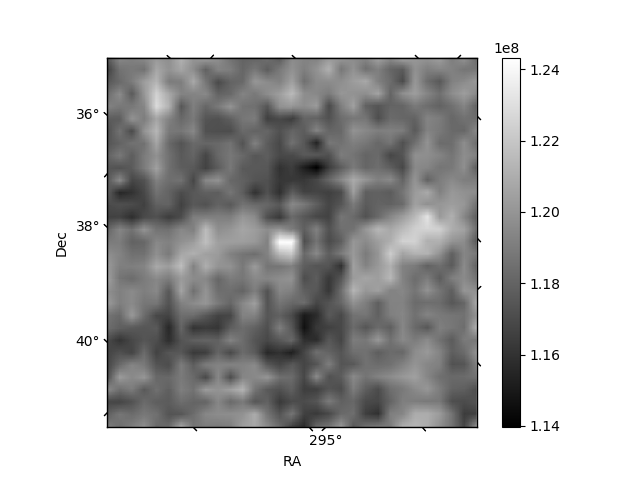 |
| Module-wise count rates for Quadrant D Data is divided into 100 sec bins |
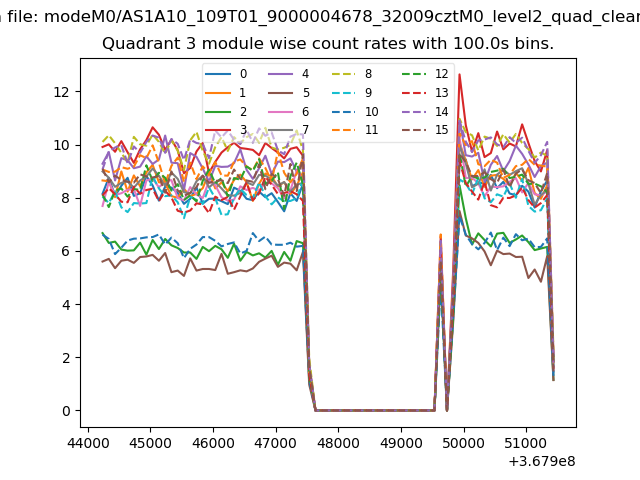 |
 |
| Parameter | Plot |
|---|---|
| CZT HV Monitor | 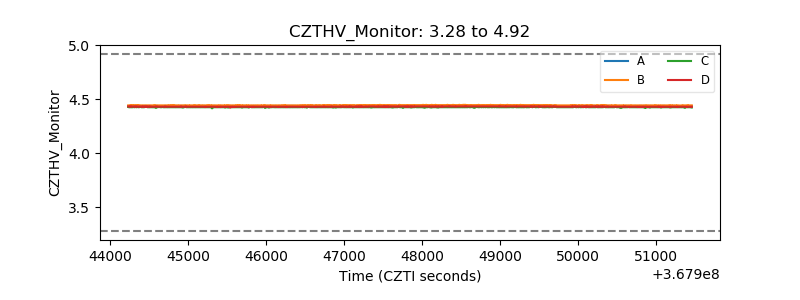 |
| D_VDD | 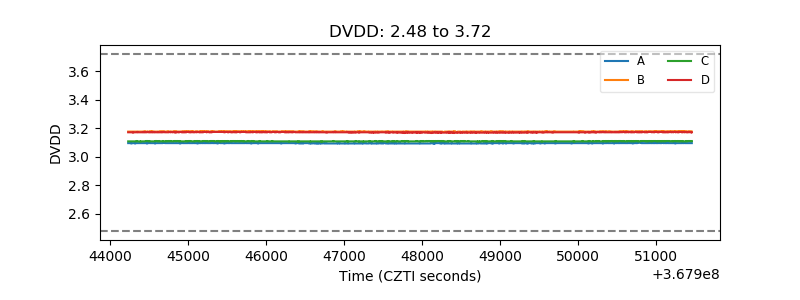 |
| Temperature 1 | 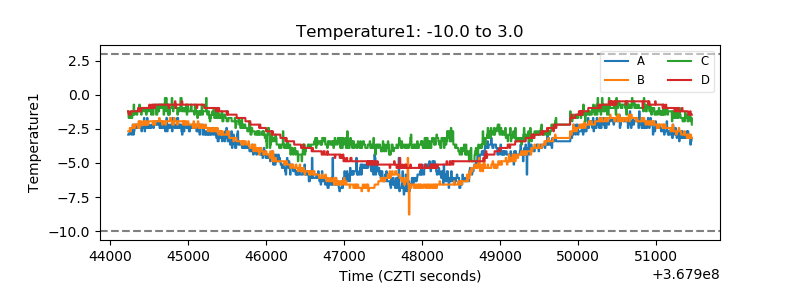 |
| Veto HV Monitor | 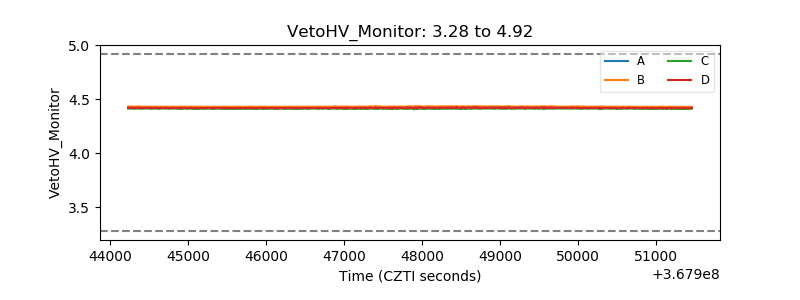 |
| Veto LLD | 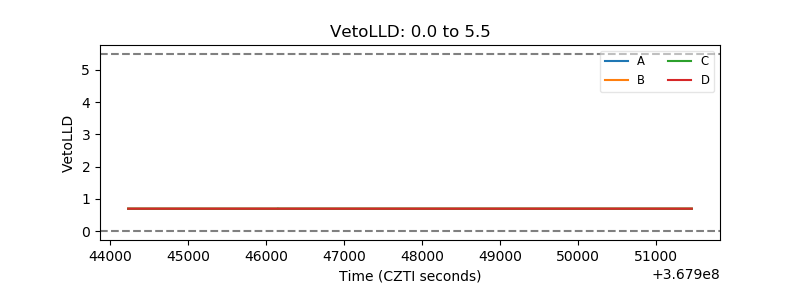 |
| Alpha Counter | 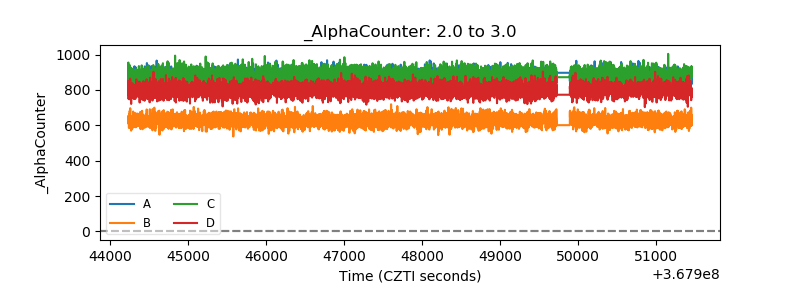 |
| _CPM_Rate | 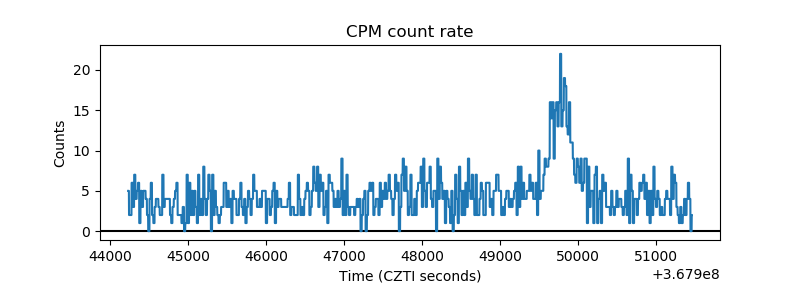 |
| CZT Counter | 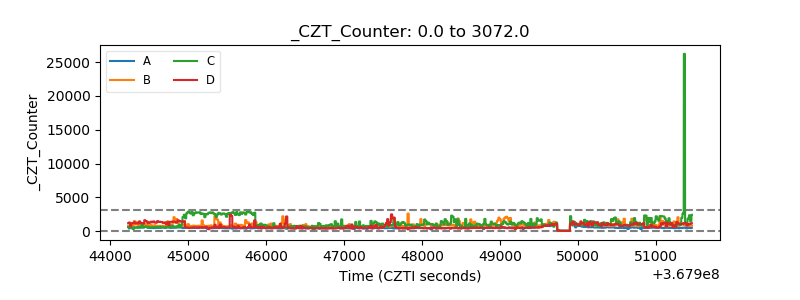 |
| +2.5 Volts monitor |  |
| +5 Volts monitor |  |
| _ROLL_ROT | 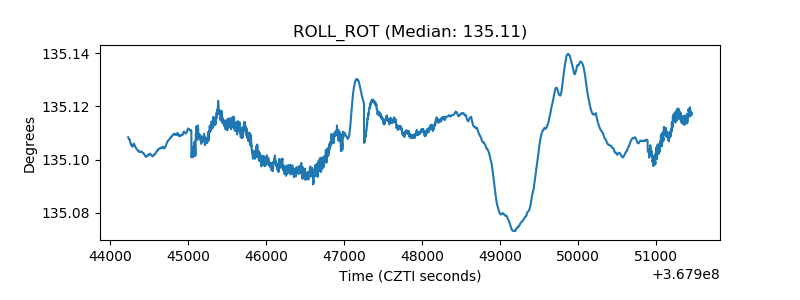 |
| _Roll_DEC | 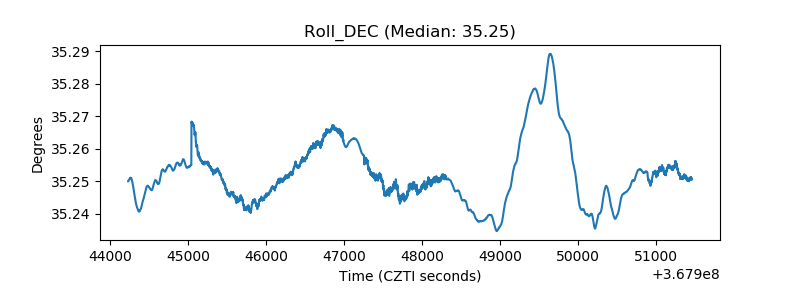 |
| _Roll_RA | 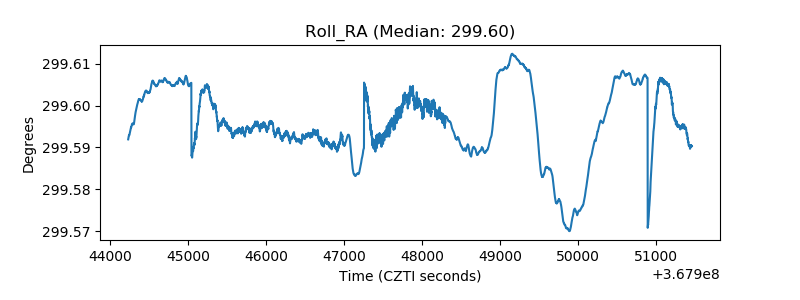 |
| Veto Counter | 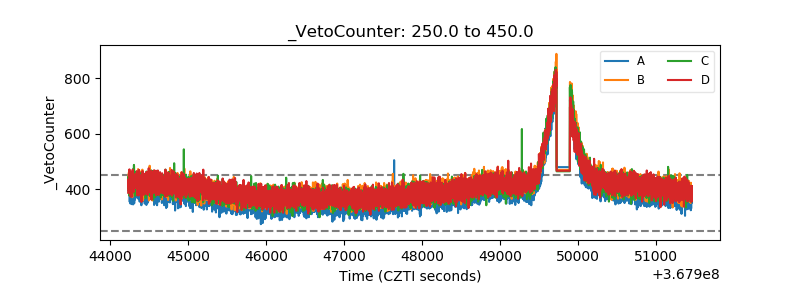 |