| Param | Original file | Final file |
|---|---|---|
| Filename | modeM0/AS1A10_109T01_9000004678_32010cztM0_level2.evt | modeM0/AS1A10_109T01_9000004678_32010cztM0_level2_quad_clean.evt |
| Size (bytes) | 768,254,400 | 104,751,360 |
| Size | 732.7 MB | 99.9 MB |
| Events in quadrant A | 3,433,796 | 717,839 |
| Events in quadrant B | 7,205,373 | 687,872 |
| Events in quadrant C | 6,224,932 | 636,217 |
| Events in quadrant D | 5,928,062 | 639,902 |
| Mode M9 | |||
|---|---|---|---|
| Quadrant | BADHDUFLAG | Total packets | Discarded packets |
| A | 0 | 2 | 0 |
| B | 0 | 2 | 0 |
| C | 0 | 2 | 0 |
| D | 0 | 2 | 0 |
| Mode SS | |||
|---|---|---|---|
| Quadrant | BADHDUFLAG | Total packets | Discarded packets |
| A | 0 | 144 | 0 |
| B | 0 | 144 | 0 |
| C | 0 | 144 | 0 |
| D | 0 | 144 | 0 |
| Mode M0 | |||
|---|---|---|---|
| Quadrant | BADHDUFLAG | Total packets | Discarded packets |
| A | 0 | 14659 | 1 |
| B | 0 | 26311 | 1 |
| C | 0 | 23366 | 1 |
| D | 0 | 22344 | 2 |
| Quadrant | Total seconds | Saturated seconds | Saturation percentage |
|---|---|---|---|
| A | 7029 | 121 | 1.721440% |
| B | 7030 | 679 | 9.658606% |
| C | 7030 | 922 | 13.115220% |
| D | 7029 | 483 | 6.871532% |
Noise dominated data is calculated using 1-second bins in cleaned event files. If a bin has >2000 counts, and if more than 50% of those come from <1% of pixels, then it is considered to be noise-dominated and hence unusable.
| Quadrant | # 1 sec bins | Bins with >0 counts | Bins with >2000 counts | High rate bins dominated by noise | Noise dominated (total time) | Noise dominated (detector-on time) | Marked lightcurve |
|---|---|---|---|---|---|---|---|
| A | 7309 | 7029 | 0 | 0 | 0.00% | 0.00% | 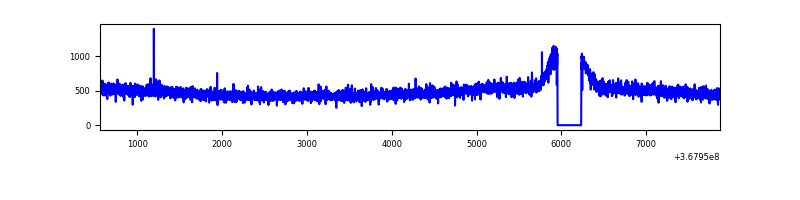 |
| B | 7309 | 7029 | 296 | 296 | 4.05% | 4.21% | 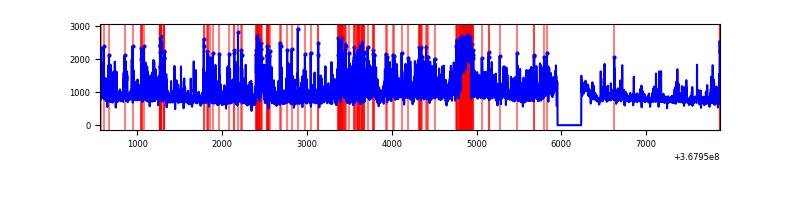 |
| C | 7310 | 7030 | 389 | 389 | 5.32% | 5.53% | 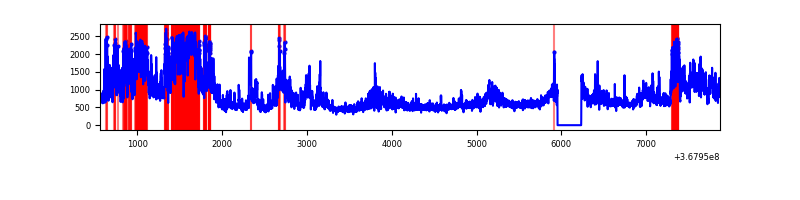 |
| D | 7309 | 7029 | 289 | 289 | 3.95% | 4.11% | 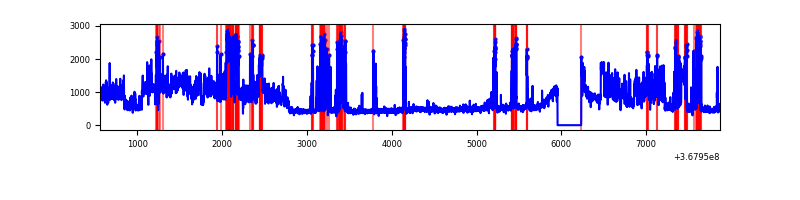 |
Top three noisy pixels from each quadrant. If the there are fewer than three noisy pixels in the level2.evt file, extra rows are filled as -1
| Pixel properties | Quadrant properties | ||||||
|---|---|---|---|---|---|---|---|
| Quadrant | DetID | PixID | Counts | Sigma | Mean | Median | Sigma |
| A | 13 | 254 | 13110 | 67.93 | 887 | 870 | 180.2 |
| A | 13 | 6 | 11073 | 56.62 | 887 | 870 | 180.2 |
| A | 3 | 137 | 8840 | 44.23 | 887 | 870 | 180.2 |
| B | 6 | 159 | 1889901 | 11552.36 | 842 | 823 | 163.5 |
| B | 12 | 18 | 1165906 | 7124.88 | 842 | 823 | 163.5 |
| B | 10 | 245 | 656377 | 4008.94 | 842 | 823 | 163.5 |
| C | 3 | 233 | 2564309 | 13239.99 | 821 | 828 | 193.6 |
| C | 0 | 10 | 192750 | 991.25 | 821 | 828 | 193.6 |
| C | 14 | 238 | 165995 | 853.06 | 821 | 828 | 193.6 |
| D | 8 | 195 | 1690664 | 8300.12 | 843 | 821 | 203.6 |
| D | 13 | 249 | 580739 | 2848.42 | 843 | 821 | 203.6 |
| D | 2 | 250 | 364859 | 1788.07 | 843 | 821 | 203.6 |
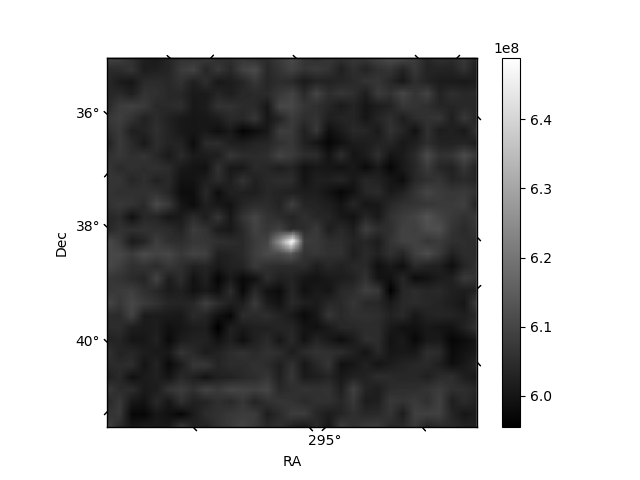
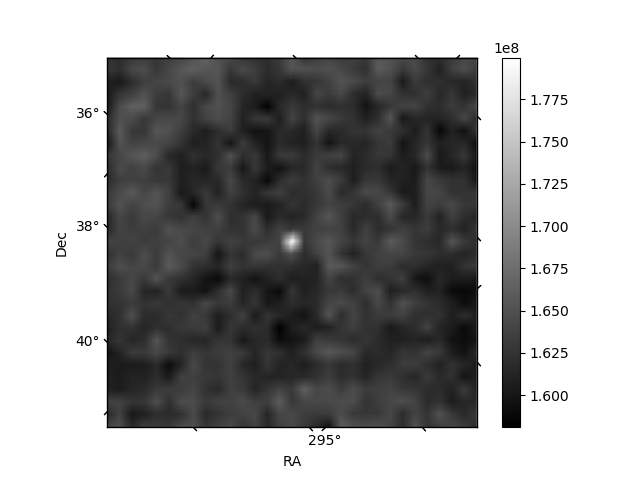
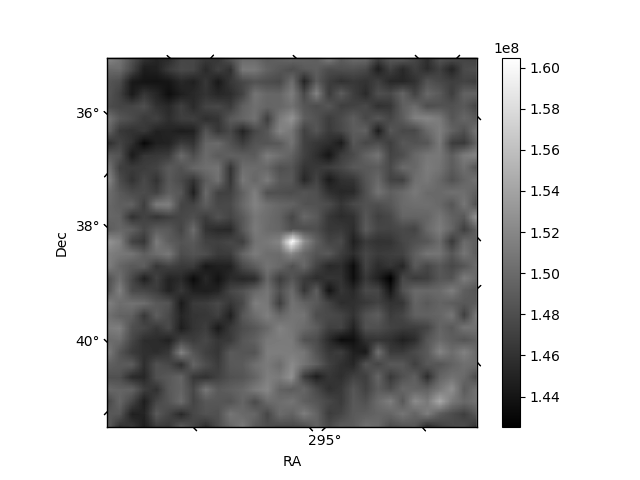
Histogram calculated using DETX and DETY for each event in the final _common_clean file
| Quadrant A | 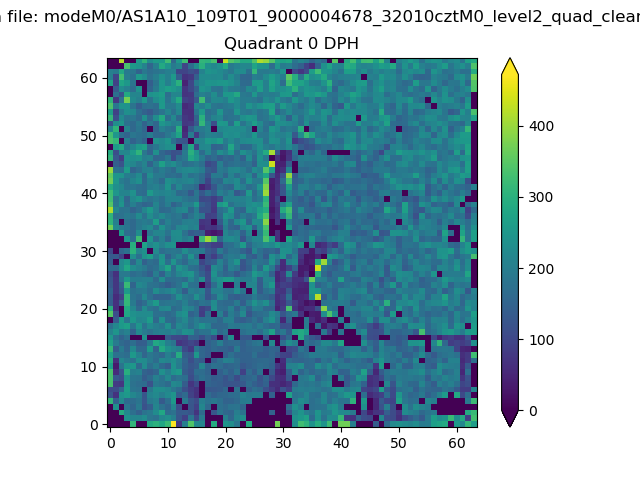 |
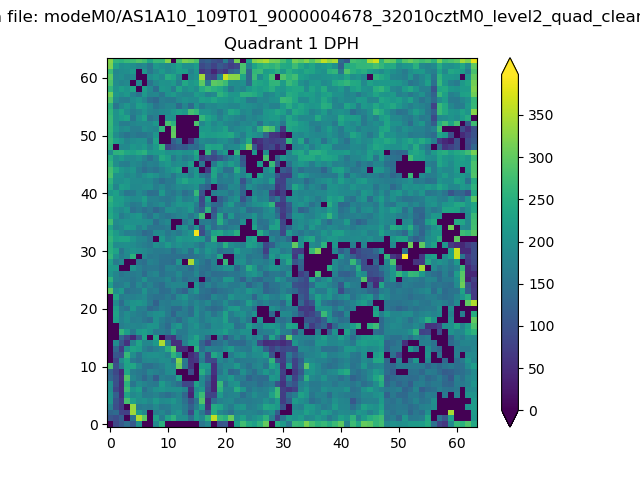 |
Quadrant B |
|---|---|---|---|
| Quadrant D |  |
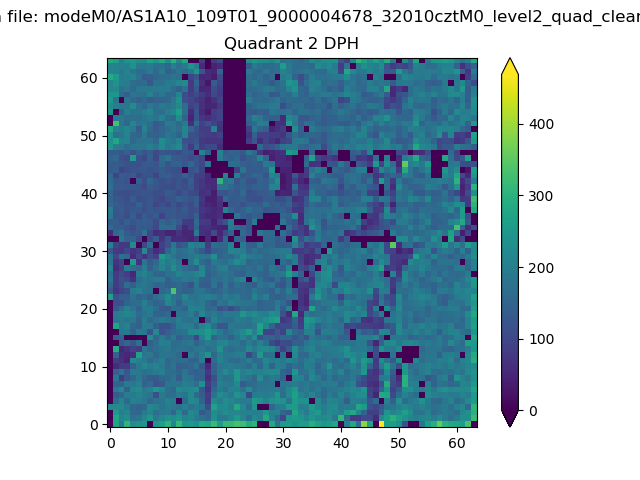 |
Quadrant C |
| Plot type | Count rate plots | Images |
|---|---|---|
| Comparison with Poisson distribution Blue bars denote a histogram of data divided into 1 sec bins. Red curve is a Poisson curve with rate = median count rate of data. |
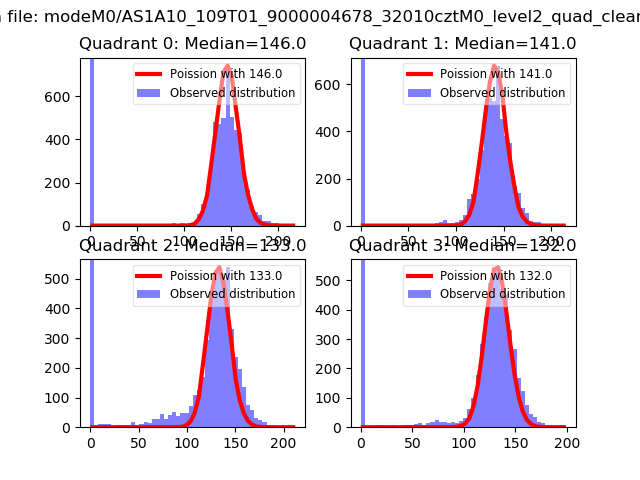 |
 |
| Quadrant-wise count rates Data is divided into 100 sec bins |
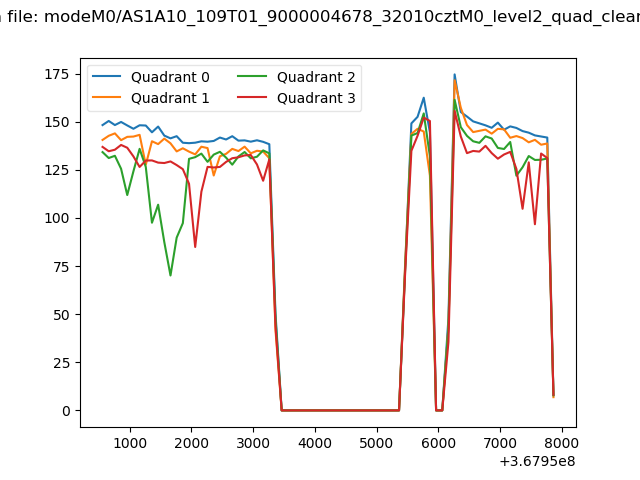 |
|
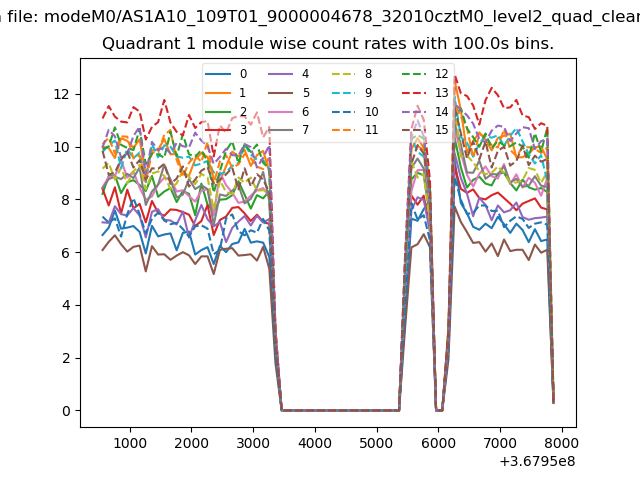
| Module-wise count rates for Quadrant A Data is divided into 100 sec bins |
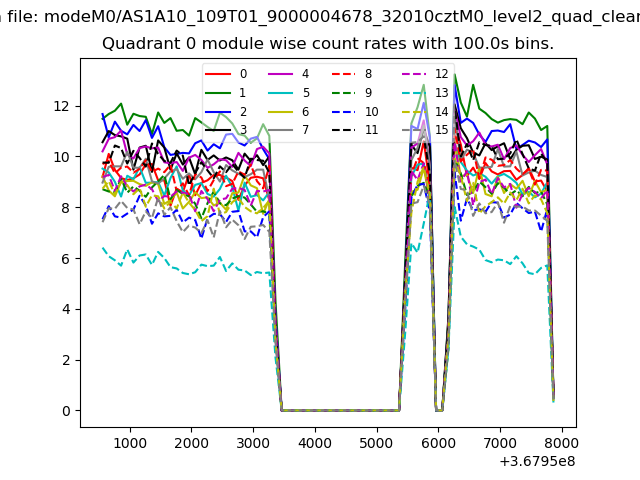 |
 |
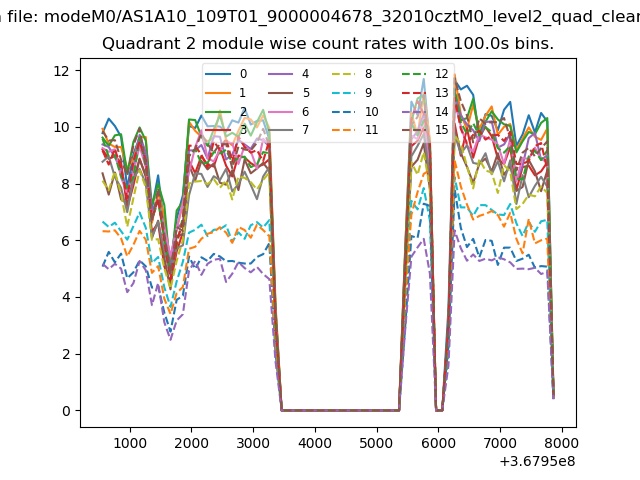
| Module-wise count rates for Quadrant B Data is divided into 100 sec bins |
 |
 |
| Module-wise count rates for Quadrant C Data is divided into 100 sec bins |
 |
 |
| Module-wise count rates for Quadrant D Data is divided into 100 sec bins |
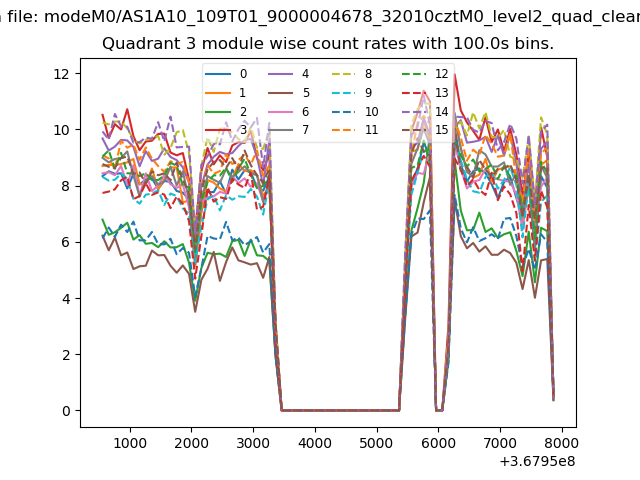 |
 |
| Parameter | Plot |
|---|---|
| CZT HV Monitor | 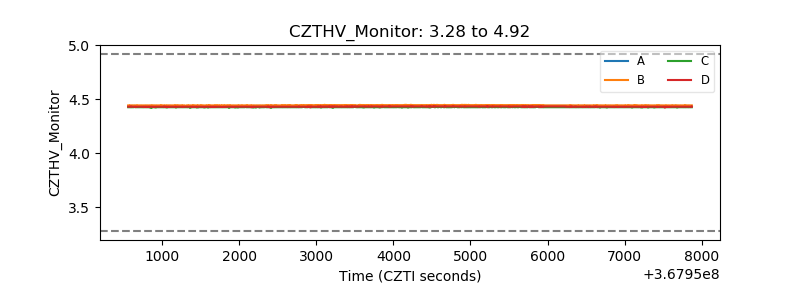 |
| D_VDD | 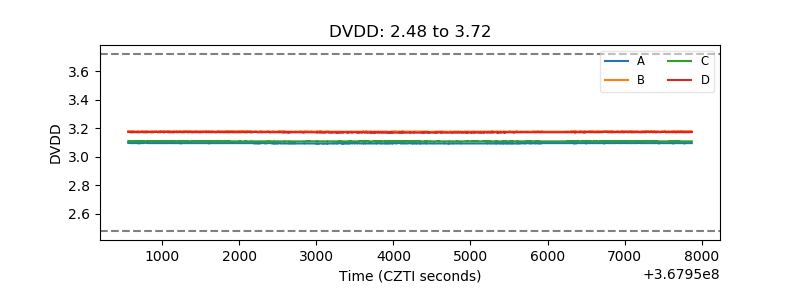 |
| Temperature 1 | 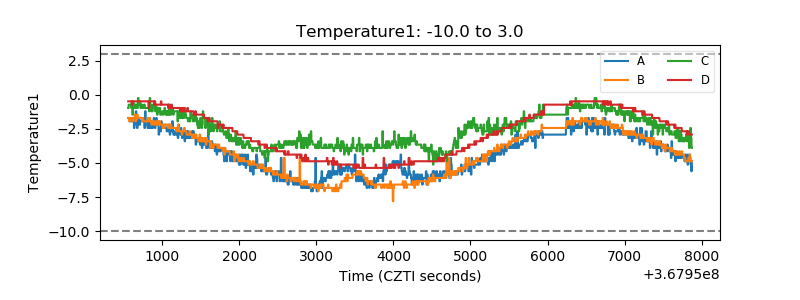 |
| Veto HV Monitor | 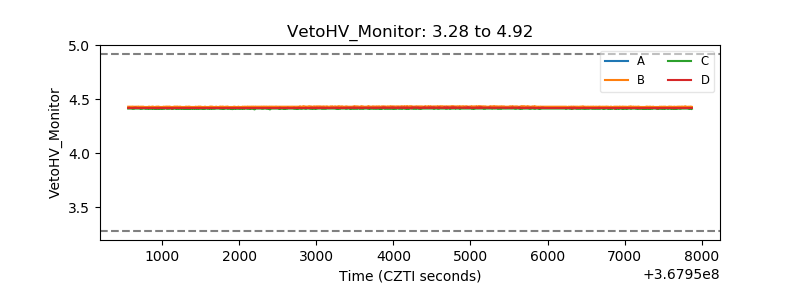 |
| Veto LLD | 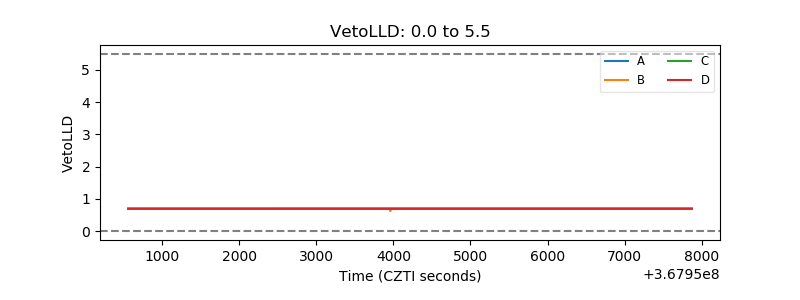 |
| Alpha Counter | 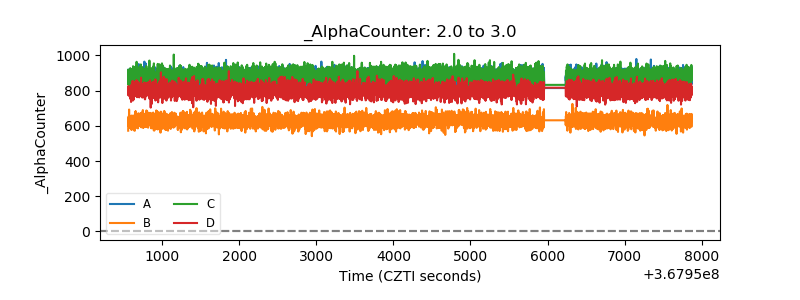 |
| _CPM_Rate | 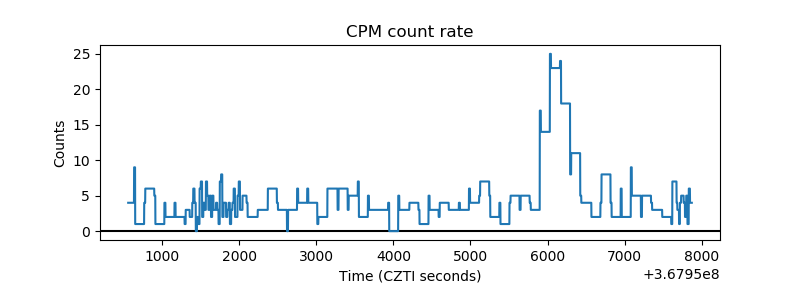 |
| CZT Counter | 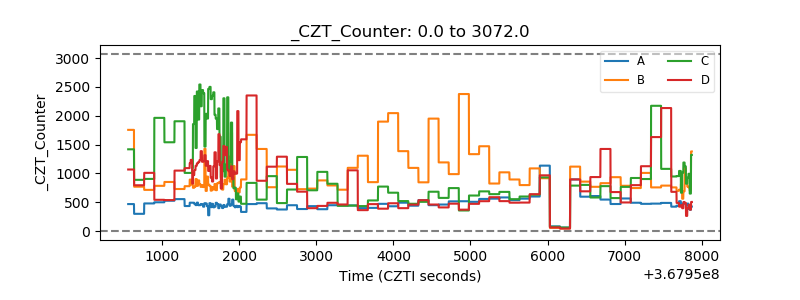 |
| +2.5 Volts monitor |  |
| +5 Volts monitor |  |
| _ROLL_ROT | 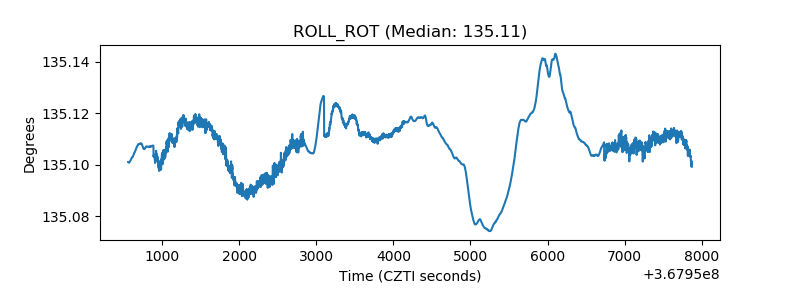 |
| _Roll_DEC | 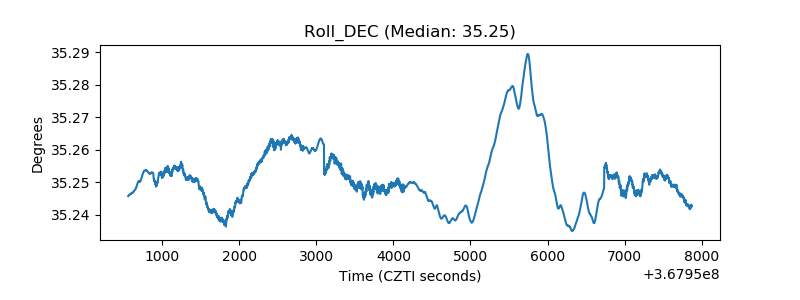 |
| _Roll_RA | 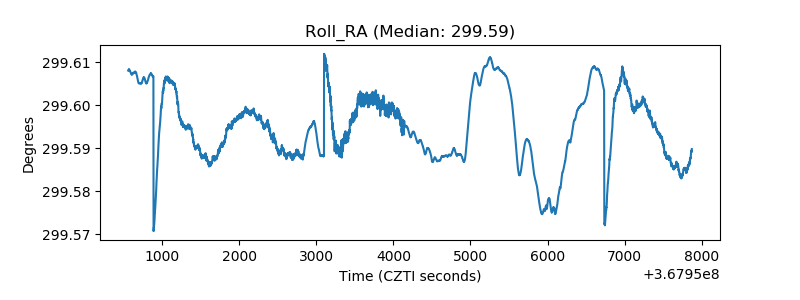 |
| Veto Counter | 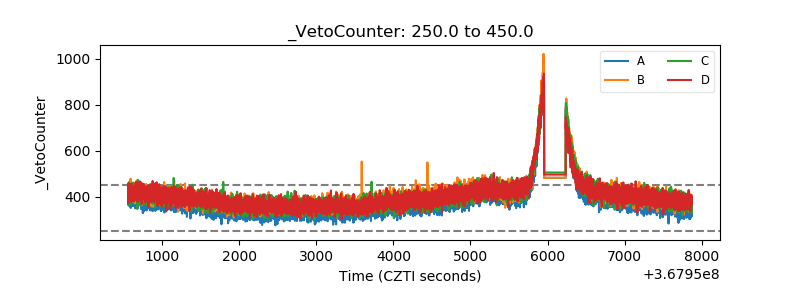 |