| Param | Original file | Final file |
|---|---|---|
| Filename | modeM0/AS1A10_109T01_9000004678_32013cztM0_level2.evt | modeM0/AS1A10_109T01_9000004678_32013cztM0_level2_quad_clean.evt |
| Size (bytes) | 1,671,624,000 | 266,279,040 |
| Size | 1.6 GB | 253.9 MB |
| Events in quadrant A | 8,763,541 | 1,778,588 |
| Events in quadrant B | 15,112,798 | 1,735,321 |
| Events in quadrant C | 14,468,447 | 1,649,629 |
| Events in quadrant D | 11,048,509 | 1,639,342 |
| Mode M9 | |||
|---|---|---|---|
| Quadrant | BADHDUFLAG | Total packets | Discarded packets |
| A | 0 | 23 | 0 |
| B | 0 | 23 | 0 |
| C | 0 | 23 | 0 |
| D | 0 | 23 | 0 |
| Mode SS | |||
|---|---|---|---|
| Quadrant | BADHDUFLAG | Total packets | Discarded packets |
| A | 0 | 378 | 0 |
| B | 0 | 376 | 0 |
| C | 0 | 376 | 0 |
| D | 0 | 376 | 0 |
| Mode M0 | |||
|---|---|---|---|
| Quadrant | BADHDUFLAG | Total packets | Discarded packets |
| A | 0 | 38078 | 4 |
| B | 0 | 58378 | 5 |
| C | 0 | 55695 | 4 |
| D | 0 | 45168 | 4 |
| Quadrant | Total seconds | Saturated seconds | Saturation percentage |
|---|---|---|---|
| A | 18305 | 124 | 0.677411% |
| B | 18305 | 552 | 3.015570% |
| C | 18305 | 977 | 5.337340% |
| D | 18305 | 425 | 2.321770% |
Noise dominated data is calculated using 1-second bins in cleaned event files. If a bin has >2000 counts, and if more than 50% of those come from <1% of pixels, then it is considered to be noise-dominated and hence unusable.
| Quadrant | # 1 sec bins | Bins with >0 counts | Bins with >2000 counts | High rate bins dominated by noise | Noise dominated (total time) | Noise dominated (detector-on time) | Marked lightcurve |
|---|---|---|---|---|---|---|---|
| A | 20720 | 18306 | 0 | 0 | 0.00% | 0.00% | 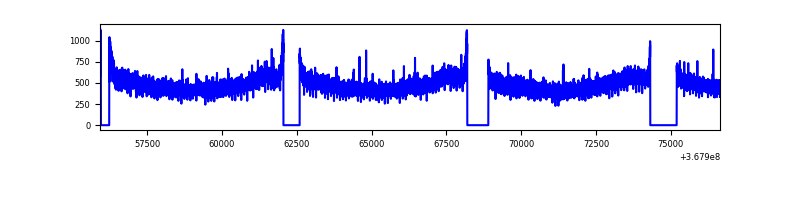 |
| B | 20720 | 18305 | 107 | 107 | 0.52% | 0.58% | 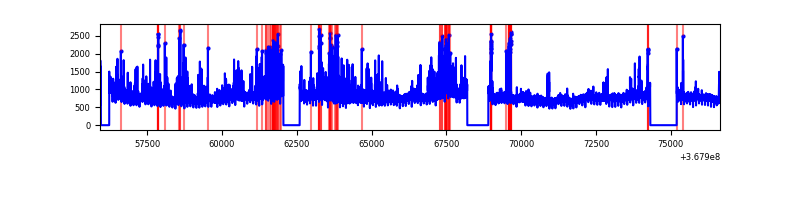 |
| C | 20720 | 18305 | 236 | 236 | 1.14% | 1.29% | 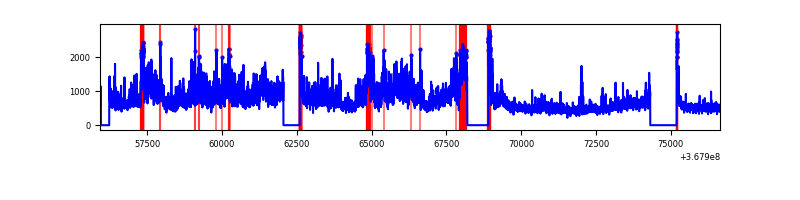 |
| D | 20720 | 18306 | 258 | 258 | 1.25% | 1.41% | 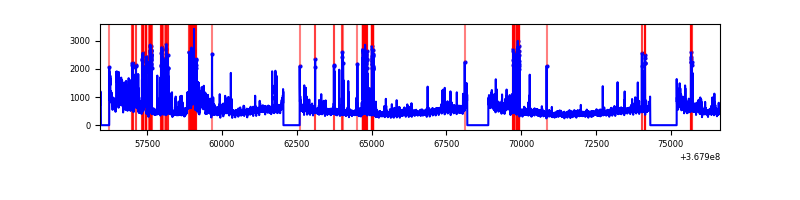 |
Top three noisy pixels from each quadrant. If the there are fewer than three noisy pixels in the level2.evt file, extra rows are filled as -1
| Pixel properties | Quadrant properties | ||||||
|---|---|---|---|---|---|---|---|
| Quadrant | DetID | PixID | Counts | Sigma | Mean | Median | Sigma |
| A | 13 | 254 | 34345 | 70.68 | 2265 | 2223 | 454.5 |
| A | 13 | 6 | 25404 | 51.0 | 2265 | 2223 | 454.5 |
| A | 3 | 137 | 23018 | 45.75 | 2265 | 2223 | 454.5 |
| B | 6 | 159 | 4934066 | 11553.3 | 2220 | 2165 | 426.9 |
| B | 12 | 18 | 797251 | 1862.54 | 2220 | 2165 | 426.9 |
| B | 10 | 245 | 251185 | 583.34 | 2220 | 2165 | 426.9 |
| C | 3 | 233 | 5132074 | 10231.56 | 2139 | 2163 | 501.4 |
| C | 0 | 10 | 477957 | 948.97 | 2139 | 2163 | 501.4 |
| C | 14 | 238 | 355168 | 704.07 | 2139 | 2163 | 501.4 |
| D | 8 | 195 | 1471915 | 2833.0 | 2175 | 2118 | 518.8 |
| D | 2 | 250 | 495590 | 951.16 | 2175 | 2118 | 518.8 |
| D | 13 | 249 | 490311 | 940.98 | 2175 | 2118 | 518.8 |
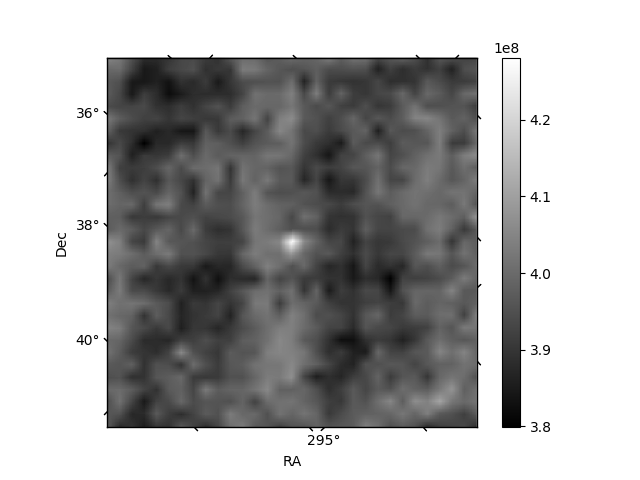
Histogram calculated using DETX and DETY for each event in the final _common_clean file
| Quadrant A | 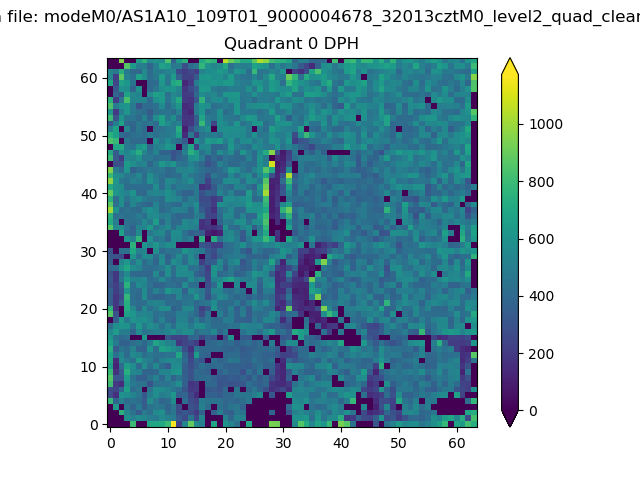 |
 |
Quadrant B |
|---|---|---|---|
| Quadrant D |  |
 |
Quadrant C |
| Plot type | Count rate plots | Images |
|---|---|---|
| Comparison with Poisson distribution Blue bars denote a histogram of data divided into 1 sec bins. Red curve is a Poisson curve with rate = median count rate of data. |
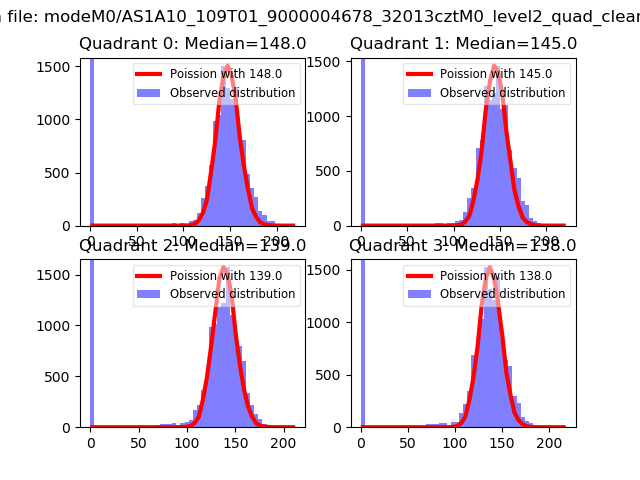 |
 |
| Quadrant-wise count rates Data is divided into 100 sec bins |
 |
|
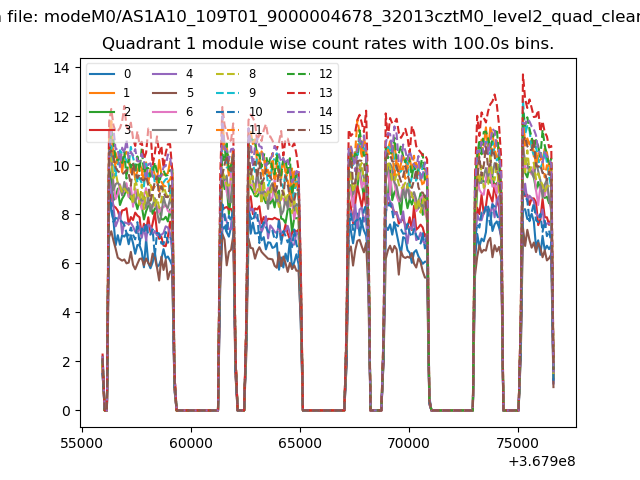
| Module-wise count rates for Quadrant A Data is divided into 100 sec bins |
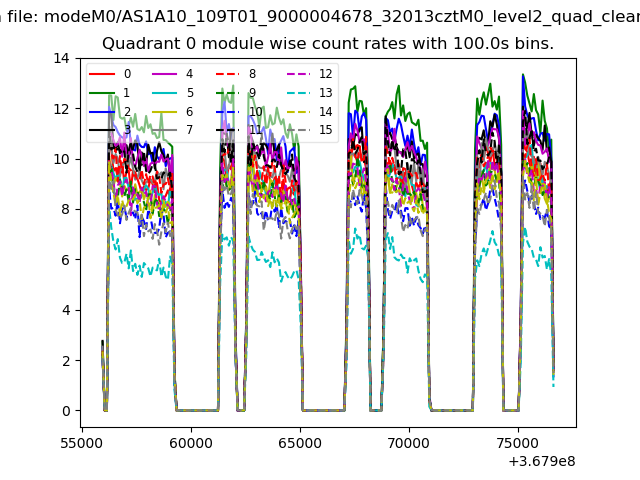 |
 |
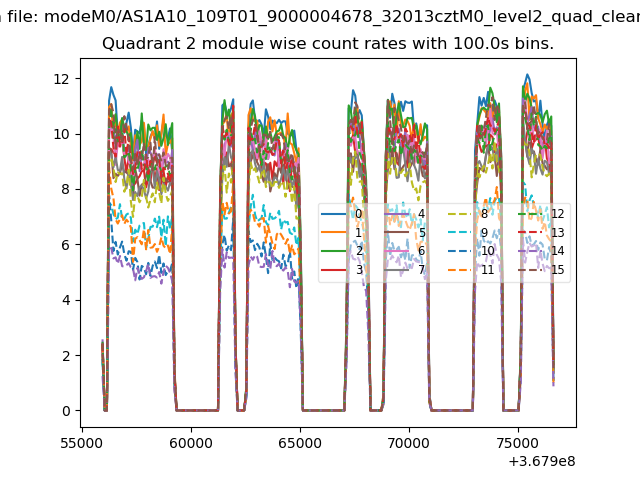
| Module-wise count rates for Quadrant B Data is divided into 100 sec bins |
 |
 |
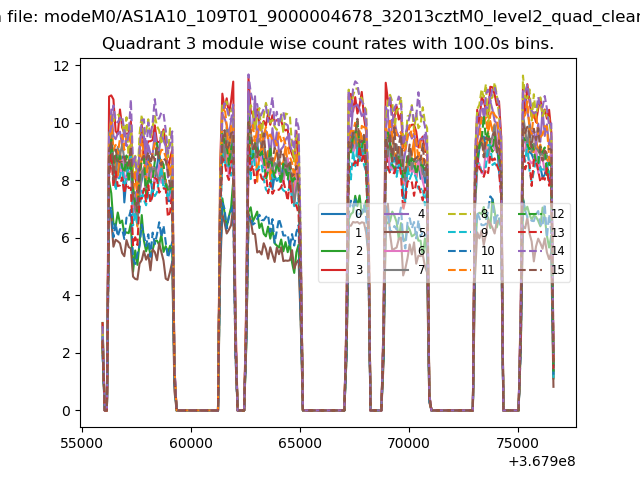
| Module-wise count rates for Quadrant C Data is divided into 100 sec bins |
 |
 |
| Module-wise count rates for Quadrant D Data is divided into 100 sec bins |
 |
 |
| Parameter | Plot |
|---|---|
| CZT HV Monitor | 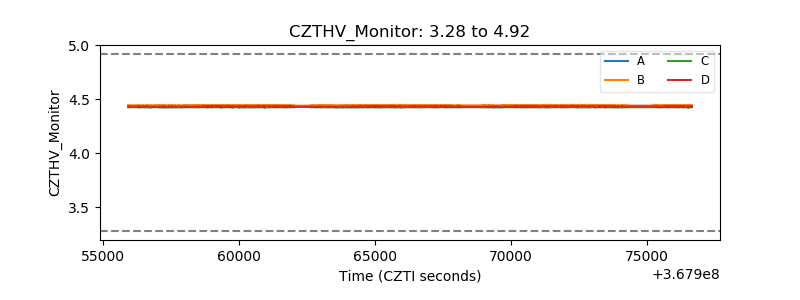 |
| D_VDD | 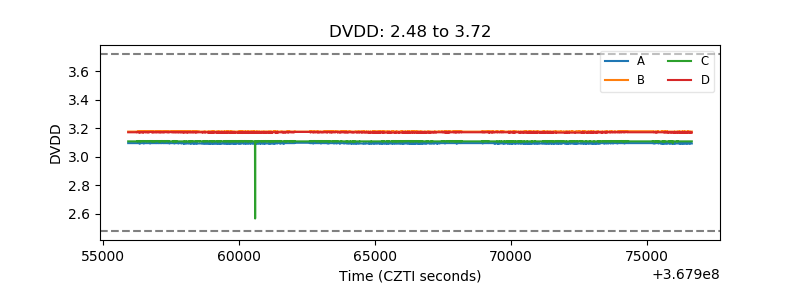 |
| Temperature 1 | 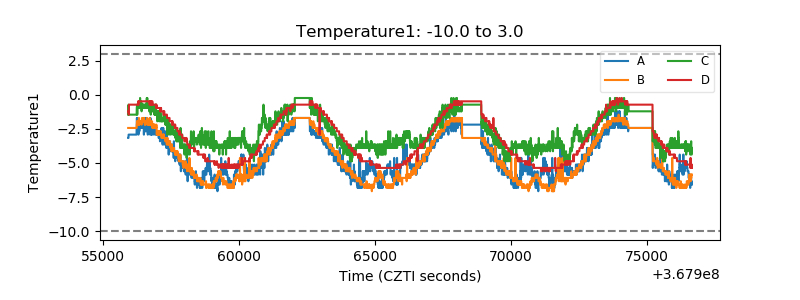 |
| Veto HV Monitor | 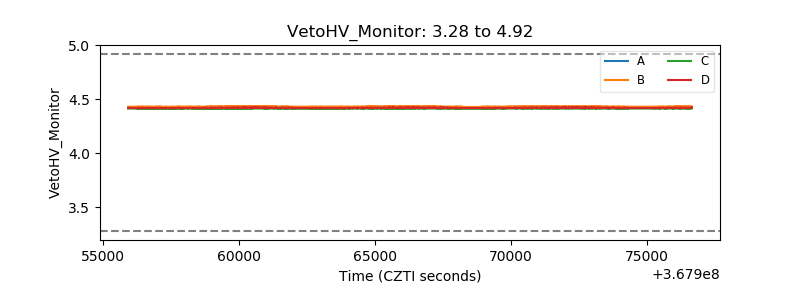 |
| Veto LLD | 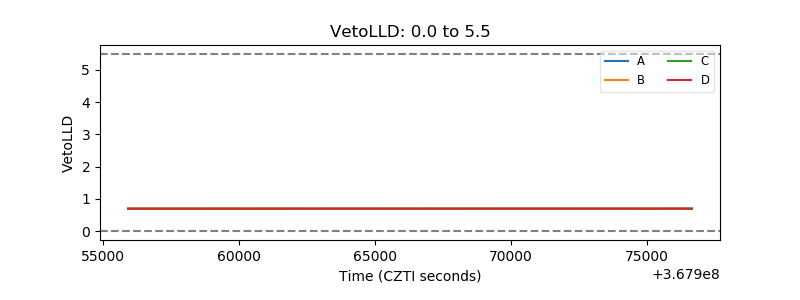 |
| Alpha Counter | 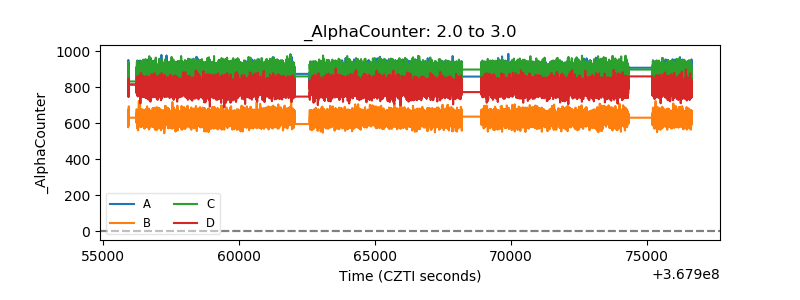 |
| _CPM_Rate | 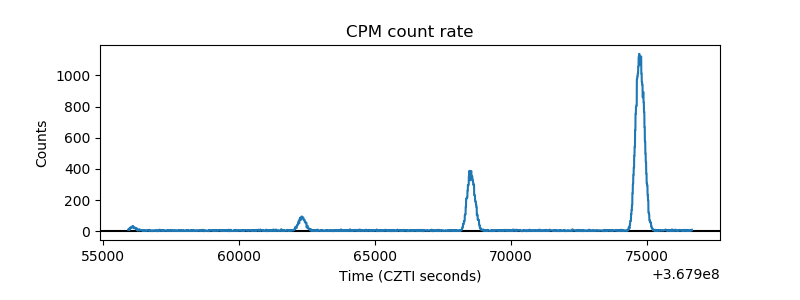 |
| CZT Counter | 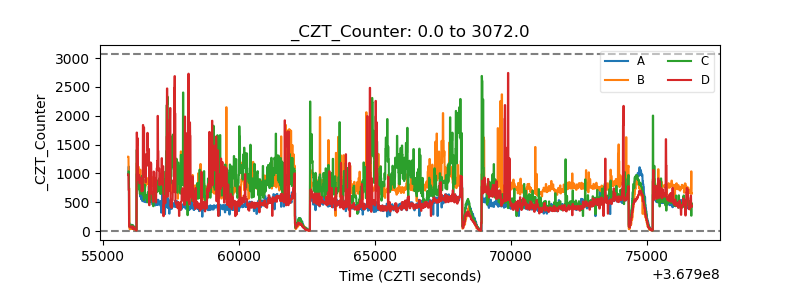 |
| +2.5 Volts monitor |  |
| +5 Volts monitor |  |
| _ROLL_ROT | 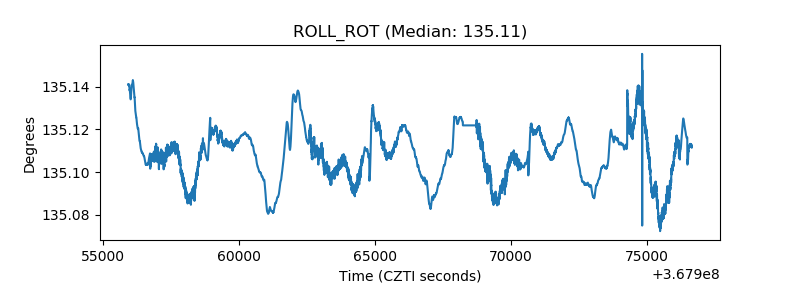 |
| _Roll_DEC | 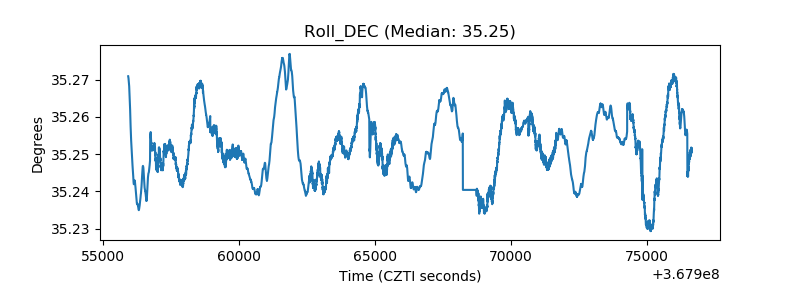 |
| _Roll_RA | 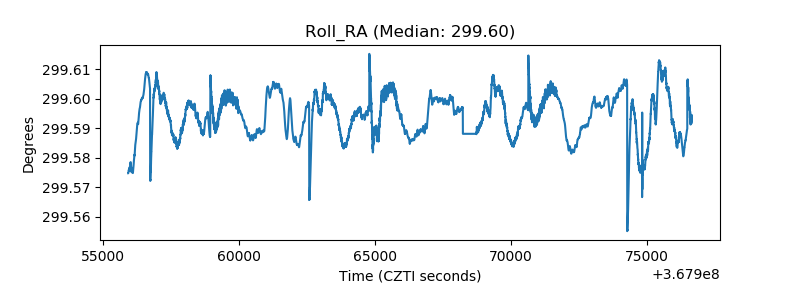 |
| Veto Counter | 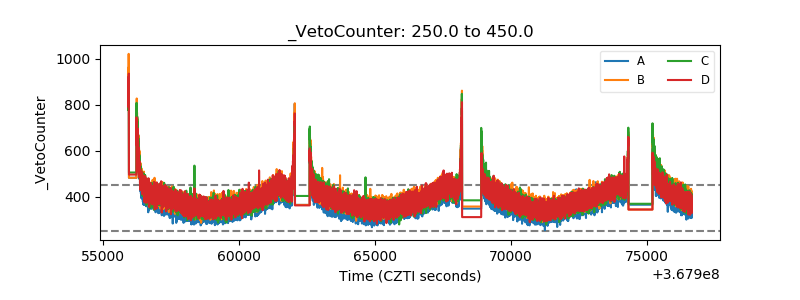 |