| Param | Original file | Final file |
|---|---|---|
| Filename | modeM0/AS1A10_109T01_9000004678_32016cztM0_level2.evt | modeM0/AS1A10_109T01_9000004678_32016cztM0_level2_quad_clean.evt |
| Size (bytes) | 507,484,800 | 83,439,360 |
| Size | 484.0 MB | 79.6 MB |
| Events in quadrant A | 2,973,655 | 549,230 |
| Events in quadrant B | 4,711,793 | 545,393 |
| Events in quadrant C | 3,539,488 | 514,240 |
| Events in quadrant D | 3,739,127 | 500,157 |
| Mode M9 | |||
|---|---|---|---|
| Quadrant | BADHDUFLAG | Total packets | Discarded packets |
| A | 0 | 12 | 0 |
| B | 0 | 12 | 0 |
| C | 0 | 12 | 0 |
| D | 0 | 12 | 0 |
| Mode SS | |||
|---|---|---|---|
| Quadrant | BADHDUFLAG | Total packets | Discarded packets |
| A | 0 | 122 | 0 |
| B | 0 | 122 | 0 |
| C | 0 | 122 | 0 |
| D | 0 | 122 | 0 |
| Mode M0 | |||
|---|---|---|---|
| Quadrant | BADHDUFLAG | Total packets | Discarded packets |
| A | 0 | 12439 | 1 |
| B | 0 | 18260 | 1 |
| C | 0 | 14292 | 1 |
| D | 0 | 15446 | 1 |
| Quadrant | Total seconds | Saturated seconds | Saturation percentage |
|---|---|---|---|
| A | 5978 | 24 | 0.401472% |
| B | 5978 | 56 | 0.936768% |
| C | 5978 | 132 | 2.208096% |
| D | 5978 | 79 | 1.321512% |
Noise dominated data is calculated using 1-second bins in cleaned event files. If a bin has >2000 counts, and if more than 50% of those come from <1% of pixels, then it is considered to be noise-dominated and hence unusable.
| Quadrant | # 1 sec bins | Bins with >0 counts | Bins with >2000 counts | High rate bins dominated by noise | Noise dominated (total time) | Noise dominated (detector-on time) | Marked lightcurve |
|---|---|---|---|---|---|---|---|
| A | 7158 | 5978 | 0 | 0 | 0.00% | 0.00% | 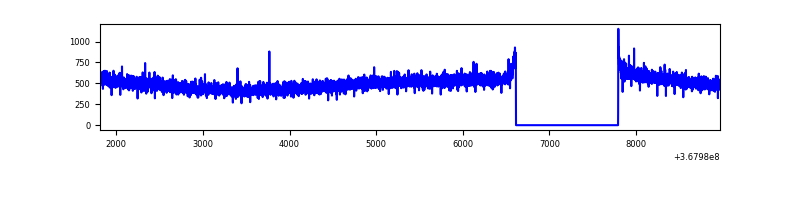 |
| B | 7158 | 5978 | 3 | 3 | 0.04% | 0.05% | 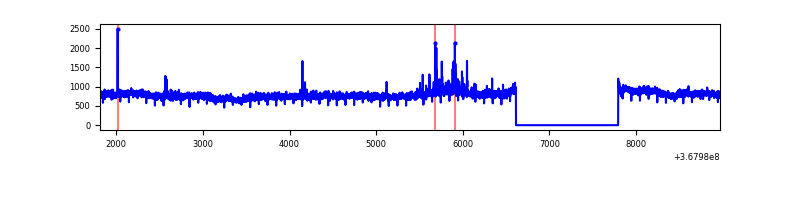 |
| C | 7158 | 5978 | 29 | 29 | 0.41% | 0.49% | 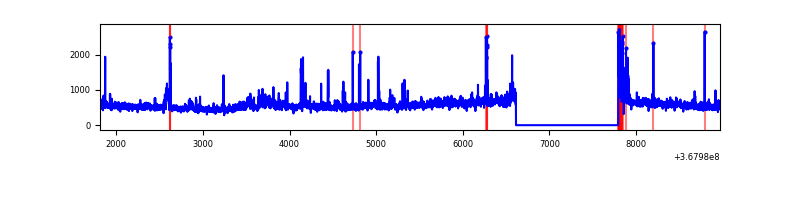 |
| D | 7158 | 5978 | 52 | 52 | 0.73% | 0.87% | 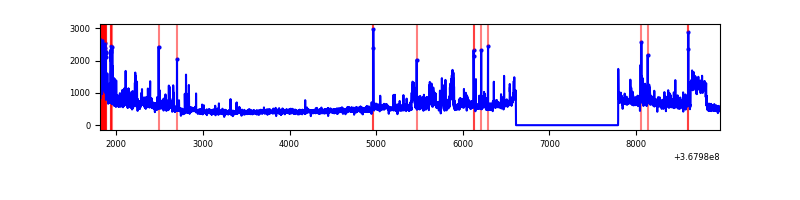 |
Top three noisy pixels from each quadrant. If the there are fewer than three noisy pixels in the level2.evt file, extra rows are filled as -1
| Pixel properties | Quadrant properties | ||||||
|---|---|---|---|---|---|---|---|
| Quadrant | DetID | PixID | Counts | Sigma | Mean | Median | Sigma |
| A | 13 | 254 | 11108 | 67.38 | 768 | 755 | 153.7 |
| A | 13 | 6 | 8214 | 48.55 | 768 | 755 | 153.7 |
| A | 3 | 137 | 7310 | 42.66 | 768 | 755 | 153.7 |
| B | 6 | 159 | 1620242 | 11274.85 | 758 | 741 | 143.6 |
| B | 15 | 33 | 54601 | 374.97 | 758 | 741 | 143.6 |
| B | 10 | 245 | 19440 | 130.18 | 758 | 741 | 143.6 |
| C | 3 | 233 | 378098 | 2210.73 | 728 | 734 | 170.7 |
| C | 0 | 10 | 171589 | 1000.93 | 728 | 734 | 170.7 |
| C | 14 | 238 | 121621 | 708.2 | 728 | 734 | 170.7 |
| D | 8 | 195 | 601610 | 3444.25 | 729 | 712 | 174.5 |
| D | 12 | 218 | 173679 | 991.42 | 729 | 712 | 174.5 |
| D | 12 | 227 | 136953 | 780.91 | 729 | 712 | 174.5 |
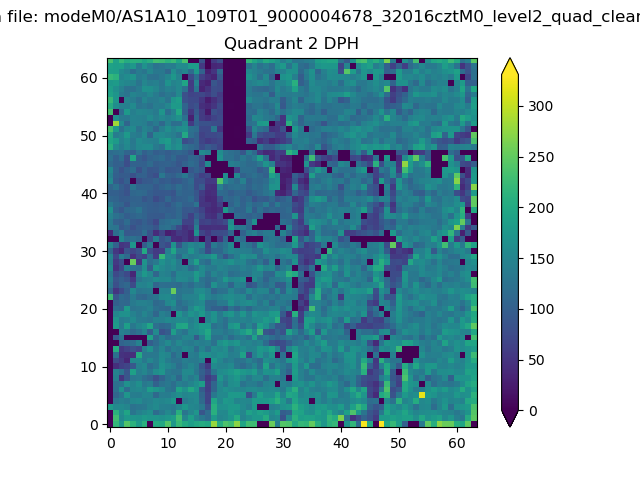
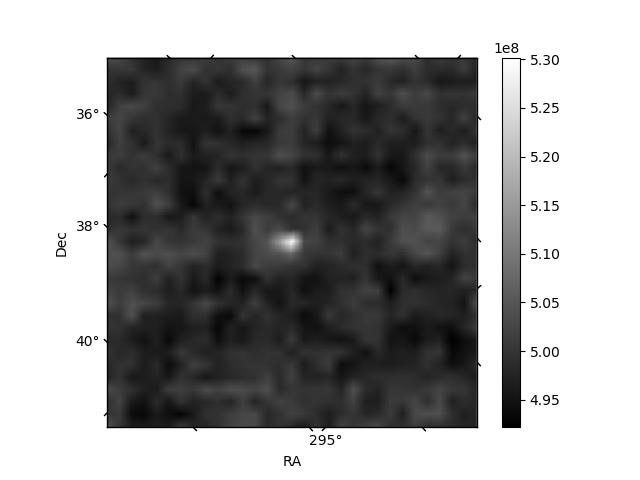
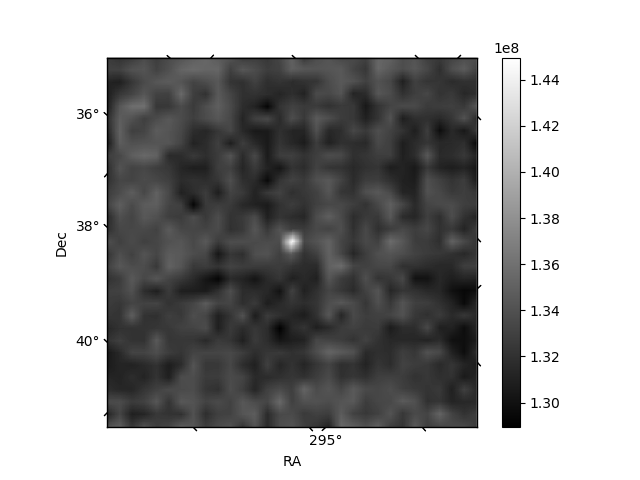
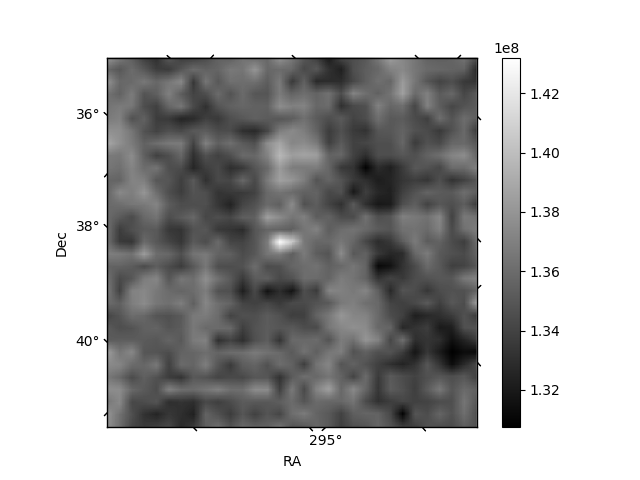
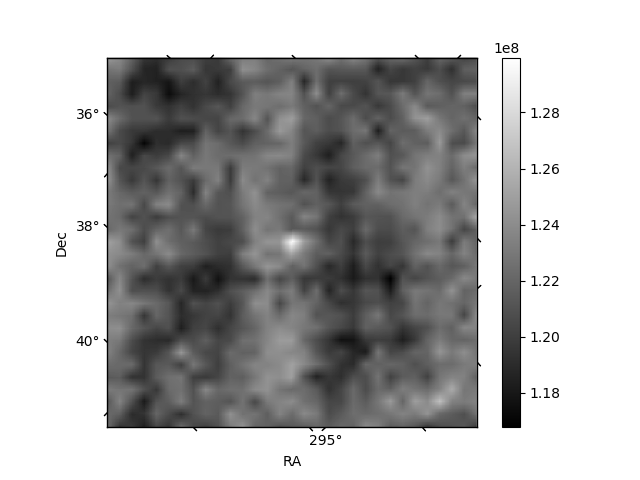
Histogram calculated using DETX and DETY for each event in the final _common_clean file
| Quadrant A | 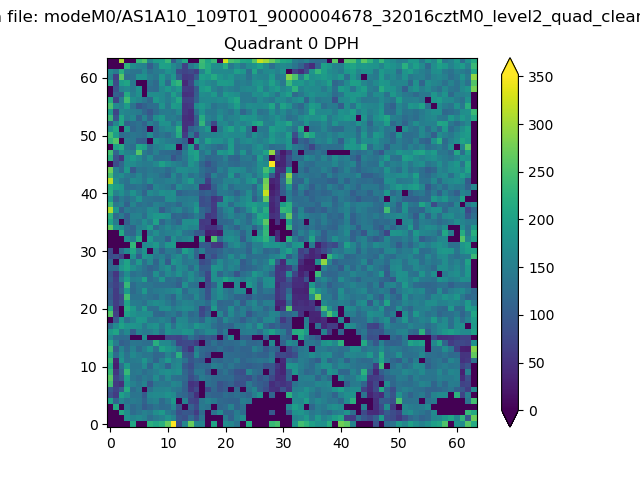 |
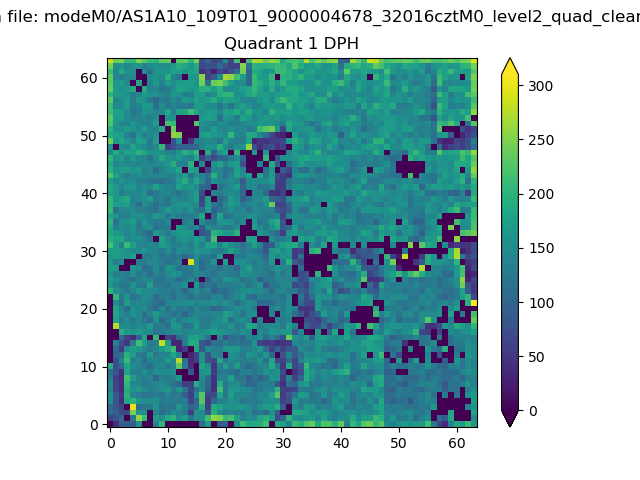 |
Quadrant B |
|---|---|---|---|
| Quadrant D | 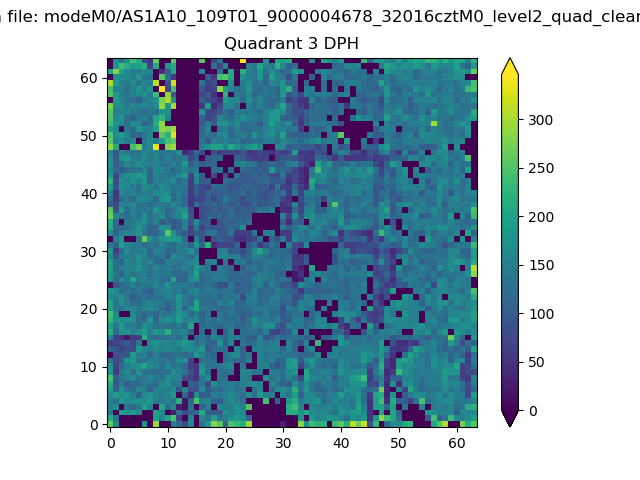 |
 |
Quadrant C |
| Plot type | Count rate plots | Images |
|---|---|---|
| Comparison with Poisson distribution Blue bars denote a histogram of data divided into 1 sec bins. Red curve is a Poisson curve with rate = median count rate of data. |
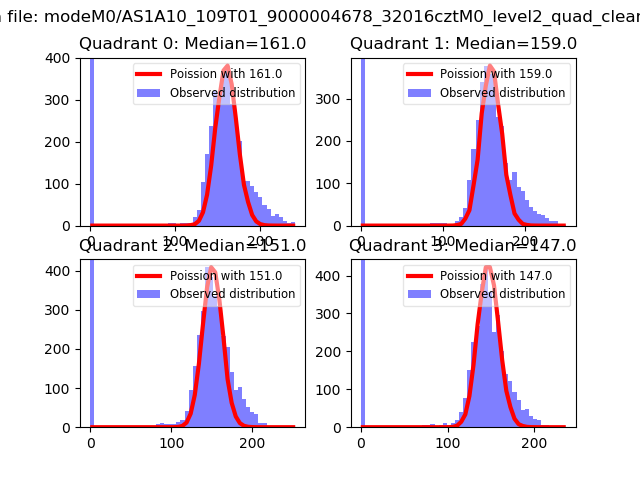 |
 |
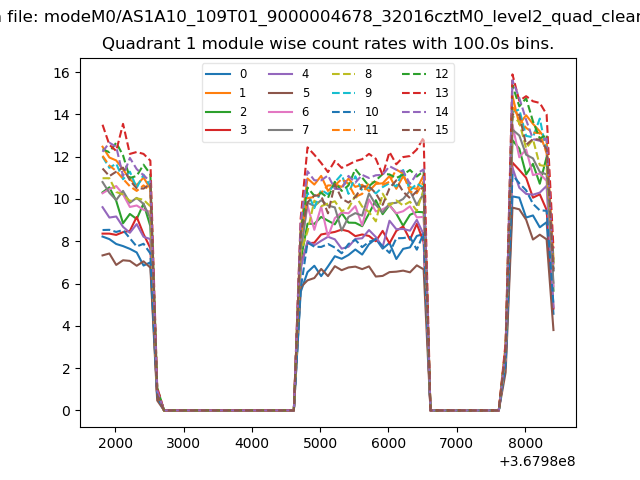
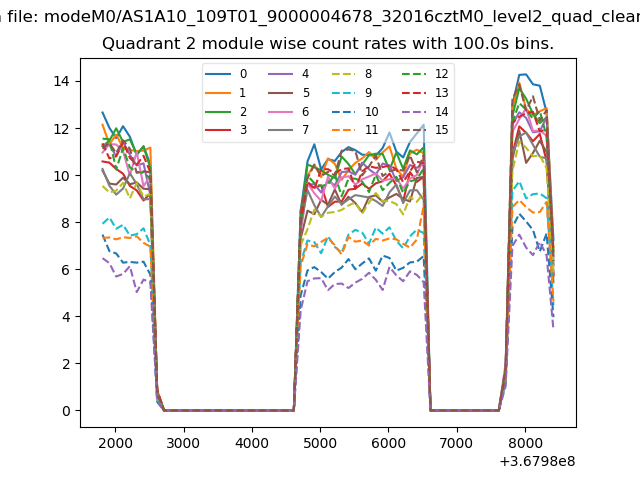
| Quadrant-wise count rates Data is divided into 100 sec bins |
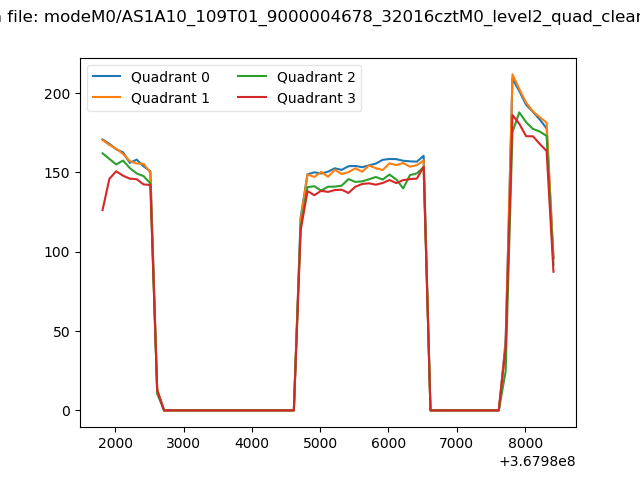 |
|
| Module-wise count rates for Quadrant A Data is divided into 100 sec bins |
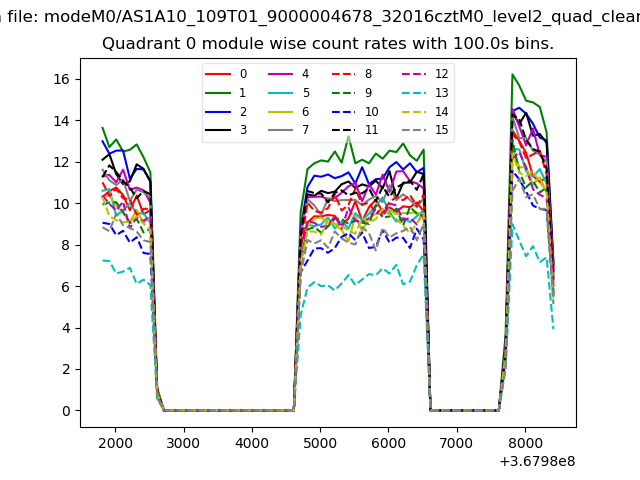 |
 |
| Module-wise count rates for Quadrant B Data is divided into 100 sec bins |
 |
 |
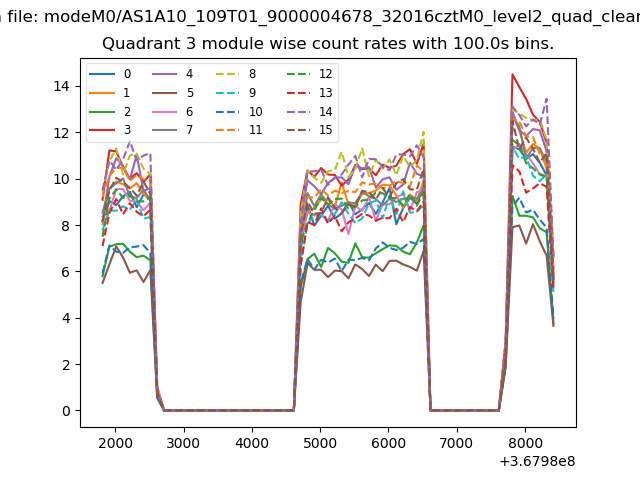
| Module-wise count rates for Quadrant C Data is divided into 100 sec bins |
 |
 |
| Module-wise count rates for Quadrant D Data is divided into 100 sec bins |
 |
 |
| Parameter | Plot |
|---|---|
| CZT HV Monitor | 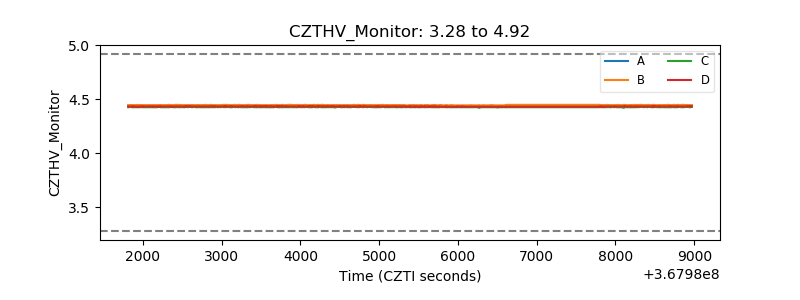 |
| D_VDD | 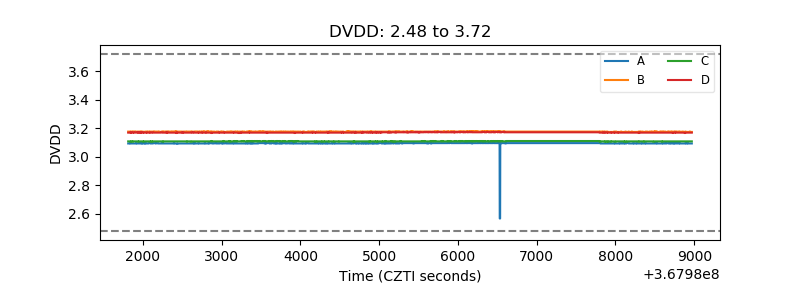 |
| Temperature 1 | 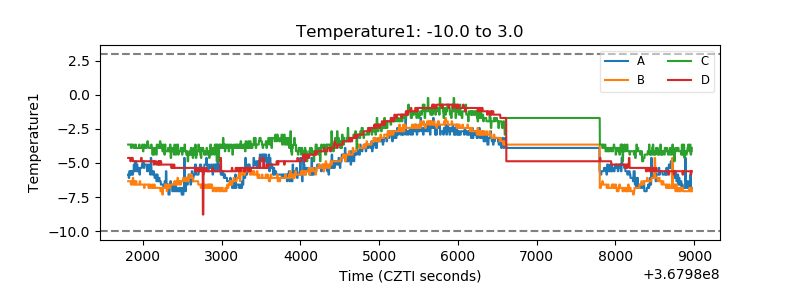 |
| Veto HV Monitor |  |
| Veto LLD | 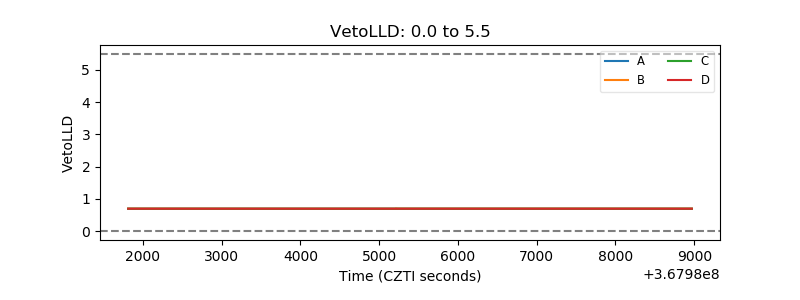 |
| Alpha Counter | 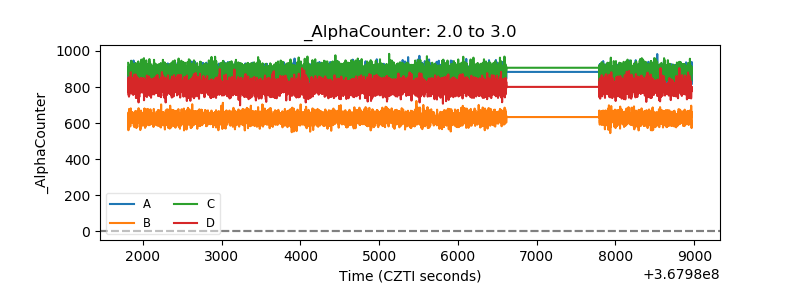 |
| _CPM_Rate | 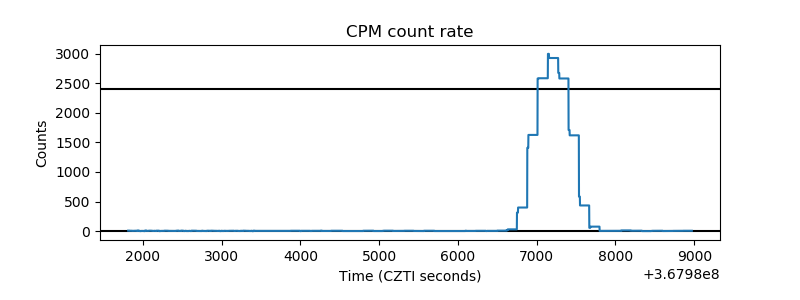 |
| CZT Counter | 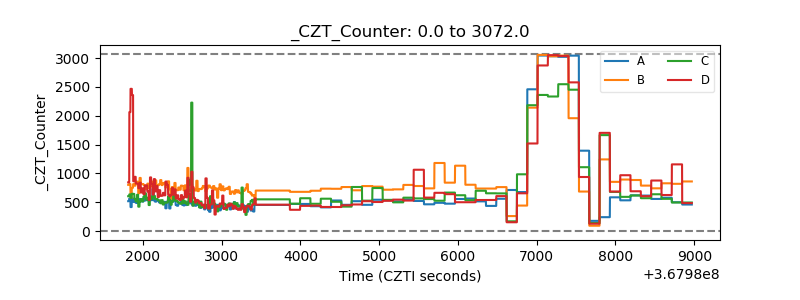 |
| +2.5 Volts monitor |  |
| +5 Volts monitor |  |
| _ROLL_ROT | 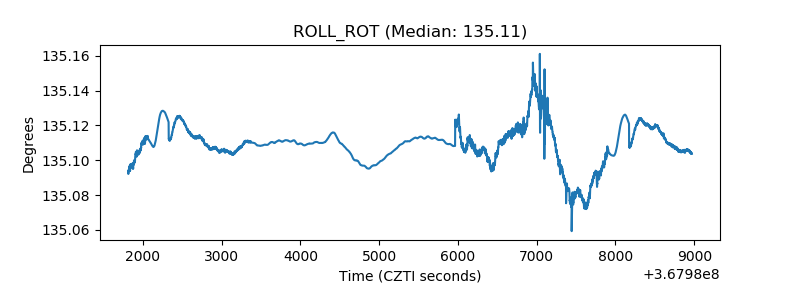 |
| _Roll_DEC | 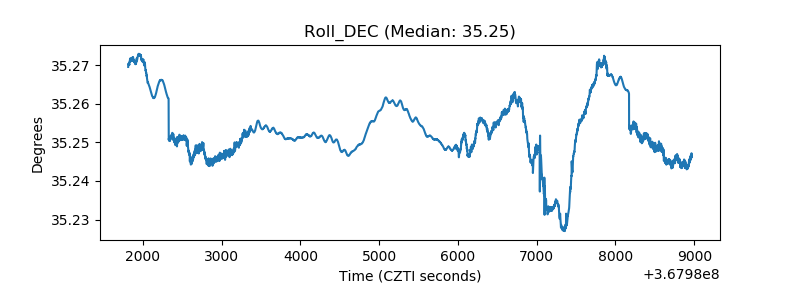 |
| _Roll_RA | 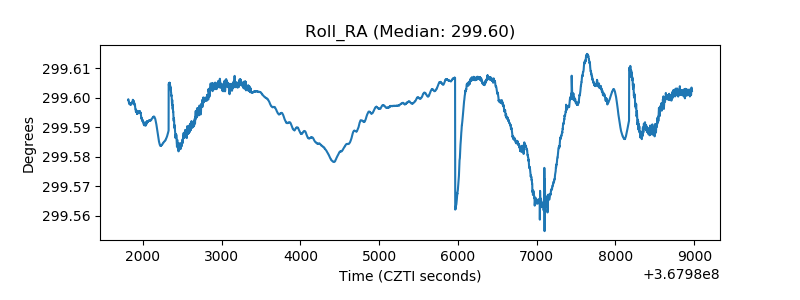 |
| Veto Counter | 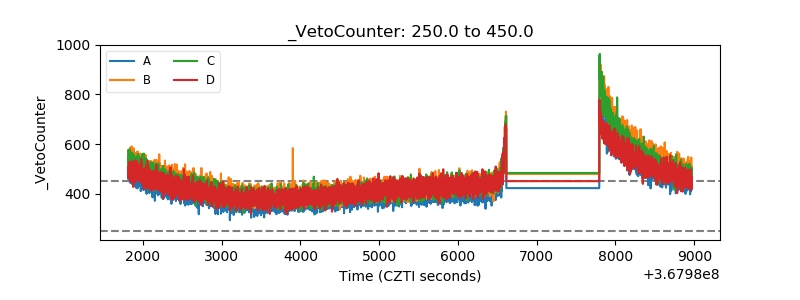 |