| Param | Original file | Final file |
|---|---|---|
| Filename | modeM0/AS1A10_109T01_9000004678_32017cztM0_level2.evt | modeM0/AS1A10_109T01_9000004678_32017cztM0_level2_quad_clean.evt |
| Size (bytes) | 601,352,640 | 88,418,880 |
| Size | 573.5 MB | 84.3 MB |
| Events in quadrant A | 3,452,228 | 579,915 |
| Events in quadrant B | 5,273,216 | 578,197 |
| Events in quadrant C | 4,152,667 | 539,408 |
| Events in quadrant D | 4,896,585 | 528,534 |
| Mode M9 | |||
|---|---|---|---|
| Quadrant | BADHDUFLAG | Total packets | Discarded packets |
| A | 0 | 24 | 0 |
| B | 0 | 24 | 0 |
| C | 0 | 24 | 0 |
| D | 0 | 24 | 0 |
| Mode SS | |||
|---|---|---|---|
| Quadrant | BADHDUFLAG | Total packets | Discarded packets |
| A | 0 | 134 | 0 |
| B | 0 | 134 | 0 |
| C | 0 | 134 | 0 |
| D | 0 | 134 | 0 |
| Mode M0 | |||
|---|---|---|---|
| Quadrant | BADHDUFLAG | Total packets | Discarded packets |
| A | 0 | 14056 | 2 |
| B | 0 | 19982 | 4 |
| C | 0 | 16611 | 2 |
| D | 0 | 19136 | 2 |
| Quadrant | Total seconds | Saturated seconds | Saturation percentage |
|---|---|---|---|
| A | 6470 | 56 | 0.865533% |
| B | 6470 | 147 | 2.272025% |
| C | 6470 | 239 | 3.693972% |
| D | 6470 | 89 | 1.375580% |
Noise dominated data is calculated using 1-second bins in cleaned event files. If a bin has >2000 counts, and if more than 50% of those come from <1% of pixels, then it is considered to be noise-dominated and hence unusable.
| Quadrant | # 1 sec bins | Bins with >0 counts | Bins with >2000 counts | High rate bins dominated by noise | Noise dominated (total time) | Noise dominated (detector-on time) | Marked lightcurve |
|---|---|---|---|---|---|---|---|
| A | 8885 | 6470 | 0 | 0 | 0.00% | 0.00% | 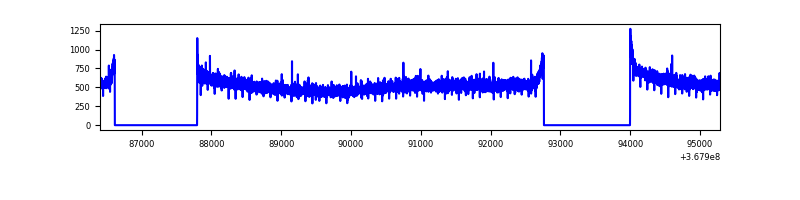 |
| B | 8885 | 6470 | 12 | 12 | 0.14% | 0.19% | 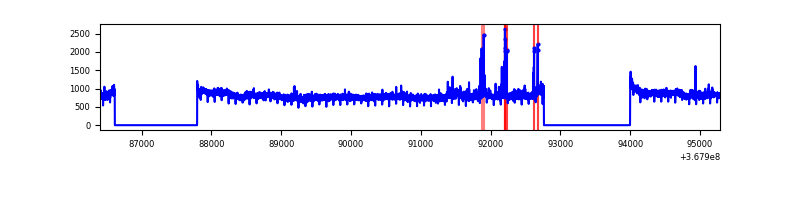 |
| C | 8885 | 6470 | 52 | 52 | 0.59% | 0.80% | 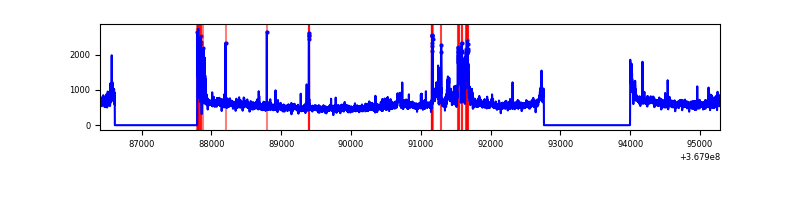 |
| D | 8885 | 6470 | 27 | 27 | 0.30% | 0.42% | 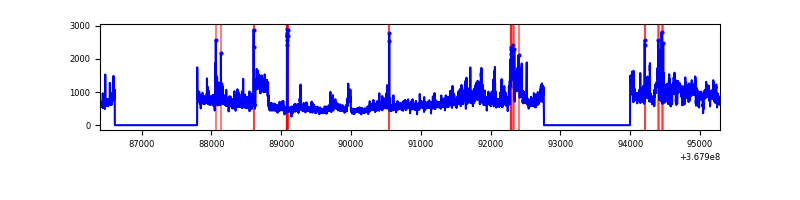 |
Top three noisy pixels from each quadrant. If the there are fewer than three noisy pixels in the level2.evt file, extra rows are filled as -1
| Pixel properties | Quadrant properties | ||||||
|---|---|---|---|---|---|---|---|
| Quadrant | DetID | PixID | Counts | Sigma | Mean | Median | Sigma |
| A | 13 | 254 | 11644 | 61.11 | 893 | 881 | 176.1 |
| A | 3 | 137 | 8311 | 42.19 | 893 | 881 | 176.1 |
| A | 0 | 226 | 7400 | 37.01 | 893 | 881 | 176.1 |
| B | 6 | 159 | 1696111 | 10216.23 | 882 | 862 | 165.9 |
| B | 10 | 245 | 54088 | 320.76 | 882 | 862 | 165.9 |
| B | 5 | 172 | 32413 | 190.14 | 882 | 862 | 165.9 |
| C | 3 | 233 | 526582 | 2687.29 | 840 | 847 | 195.6 |
| C | 0 | 10 | 168019 | 854.5 | 840 | 847 | 195.6 |
| C | 14 | 238 | 142585 | 724.49 | 840 | 847 | 195.6 |
| D | 8 | 195 | 1578680 | 7880.02 | 844 | 823 | 200.2 |
| D | 2 | 250 | 77412 | 382.5 | 844 | 823 | 200.2 |
| D | 2 | 234 | 25884 | 125.16 | 844 | 823 | 200.2 |
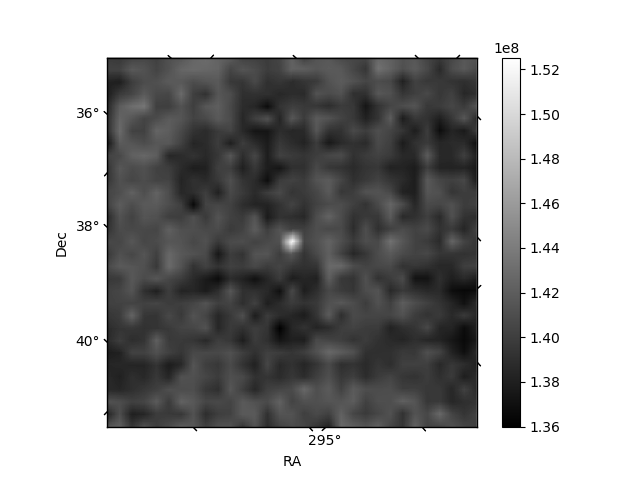
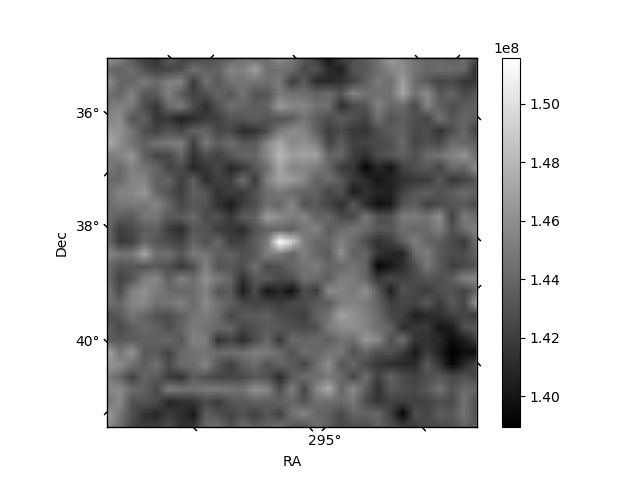
Histogram calculated using DETX and DETY for each event in the final _common_clean file
| Quadrant A |  |
 |
Quadrant B |
|---|---|---|---|
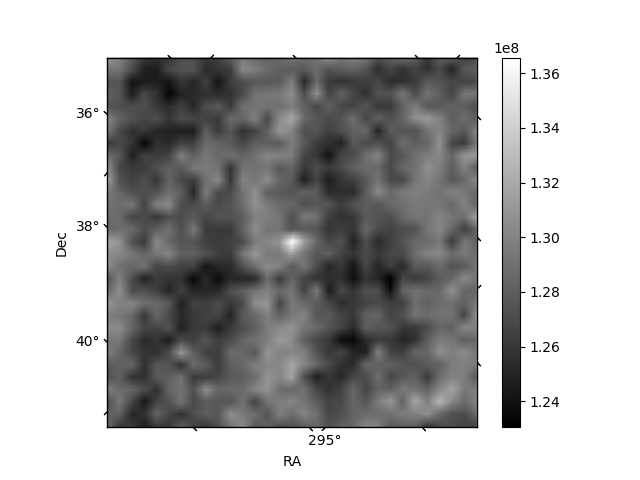
| Quadrant D | 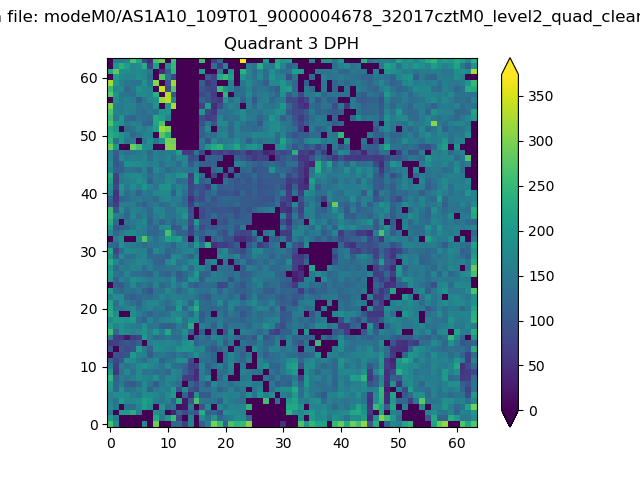 |
 |
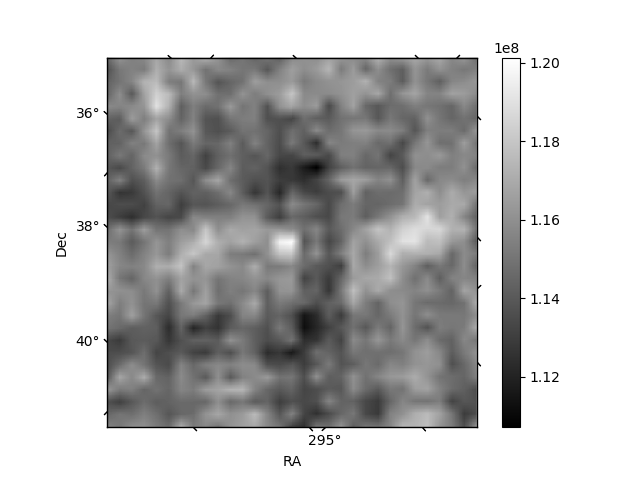
Quadrant C |
| Plot type | Count rate plots | Images |
|---|---|---|
| Comparison with Poisson distribution Blue bars denote a histogram of data divided into 1 sec bins. Red curve is a Poisson curve with rate = median count rate of data. |
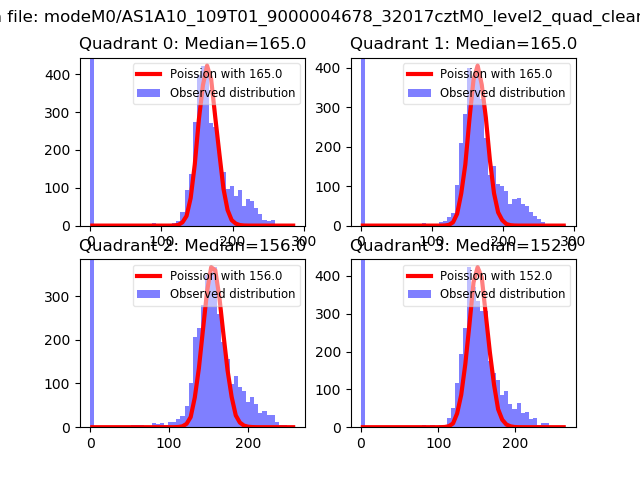 |
 |
| Quadrant-wise count rates Data is divided into 100 sec bins |
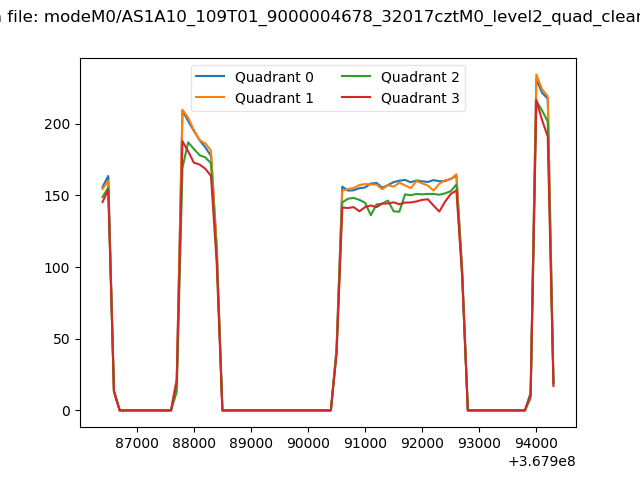 |
|
| Module-wise count rates for Quadrant A Data is divided into 100 sec bins |
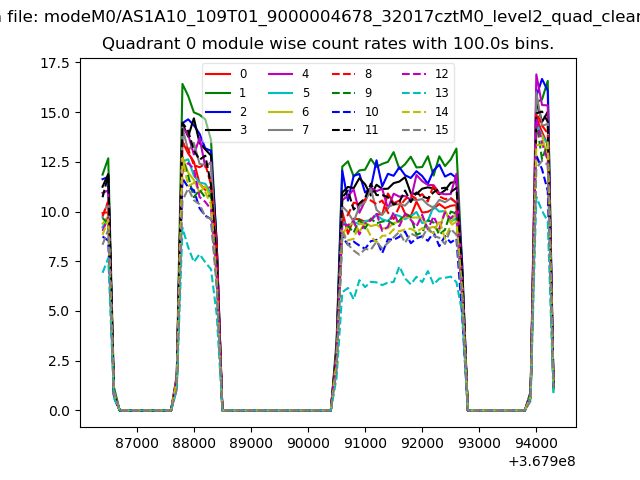 |
 |
| Module-wise count rates for Quadrant B Data is divided into 100 sec bins |
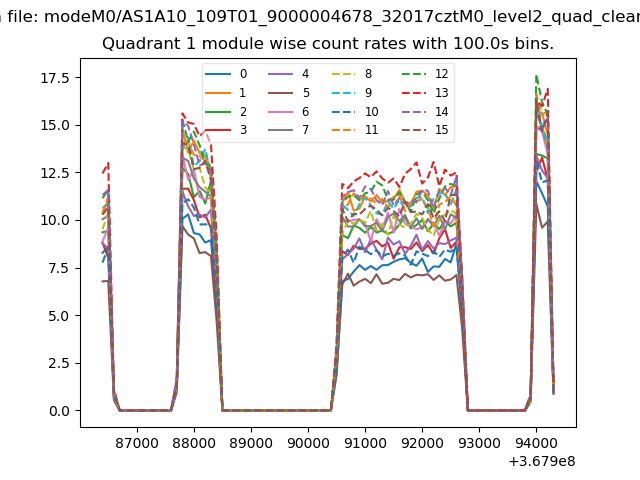 |
 |
| Module-wise count rates for Quadrant C Data is divided into 100 sec bins |
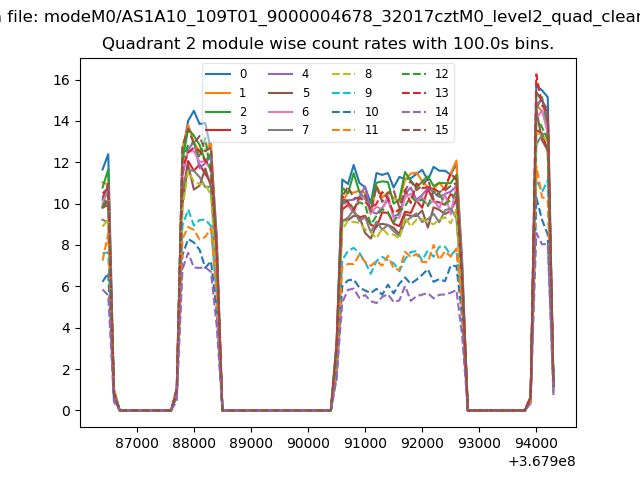 |
 |
| Module-wise count rates for Quadrant D Data is divided into 100 sec bins |
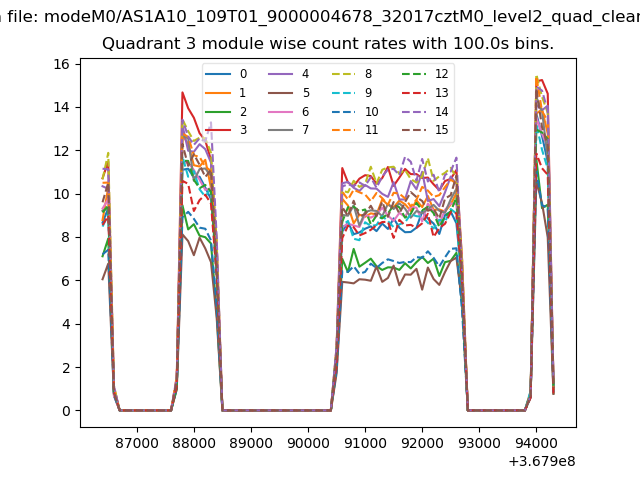 |
 |
| Parameter | Plot |
|---|---|
| CZT HV Monitor | 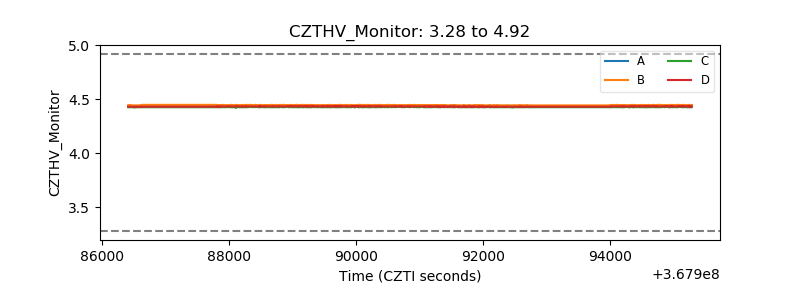 |
| D_VDD | 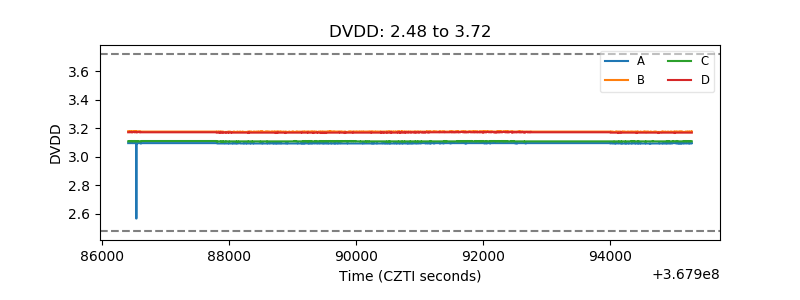 |
| Temperature 1 | 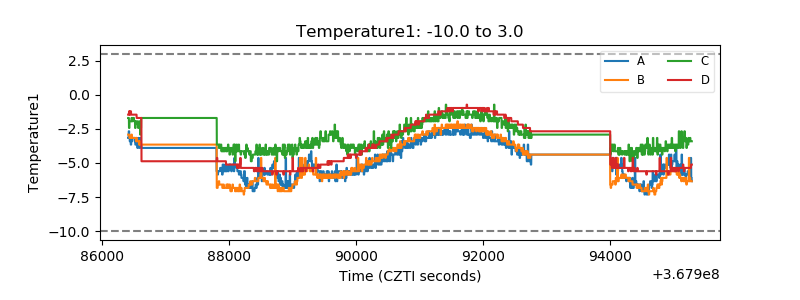 |
| Veto HV Monitor | 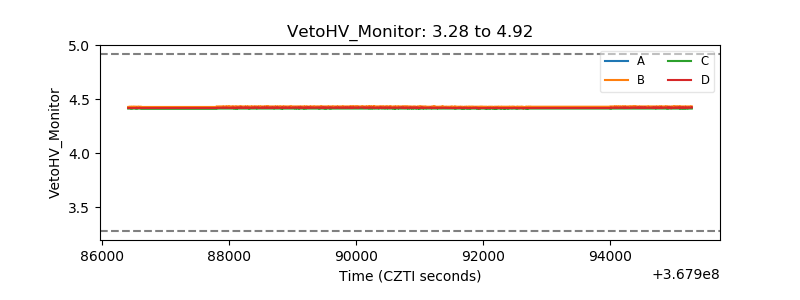 |
| Veto LLD | 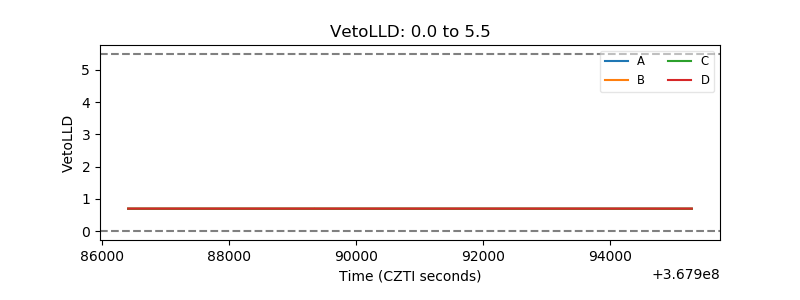 |
| Alpha Counter | 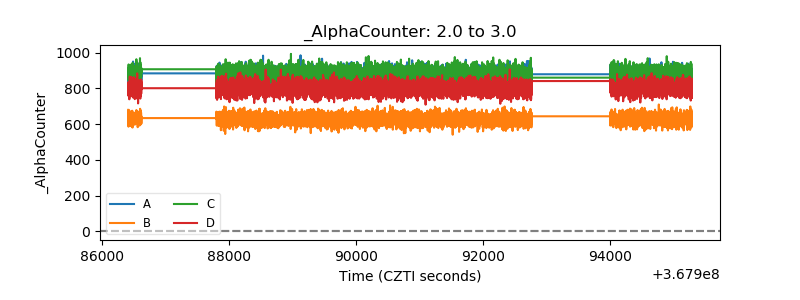 |
| _CPM_Rate | 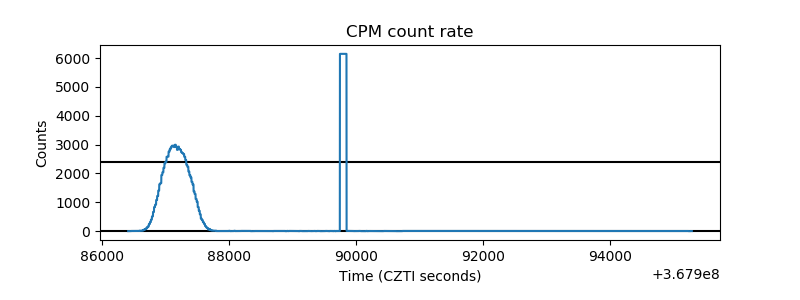 |
| CZT Counter |  |
| +2.5 Volts monitor |  |
| +5 Volts monitor |  |
| _ROLL_ROT | 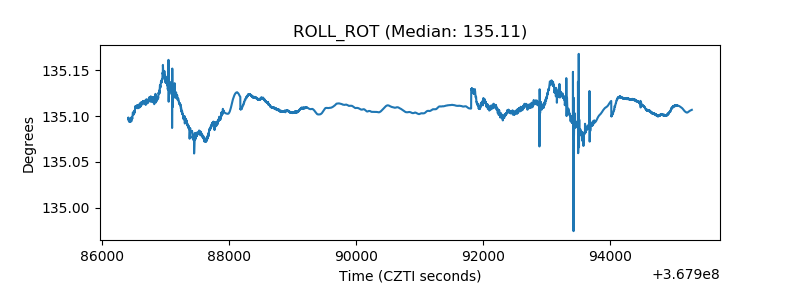 |
| _Roll_DEC | 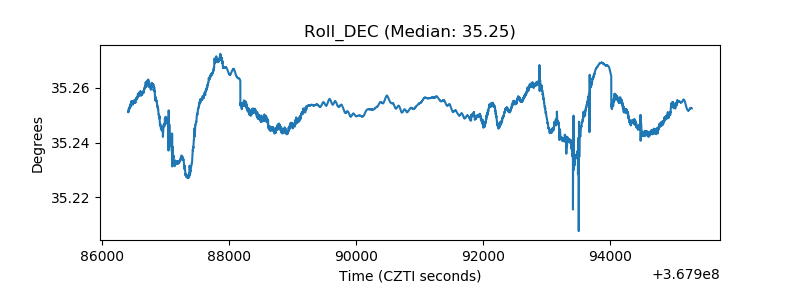 |
| _Roll_RA | 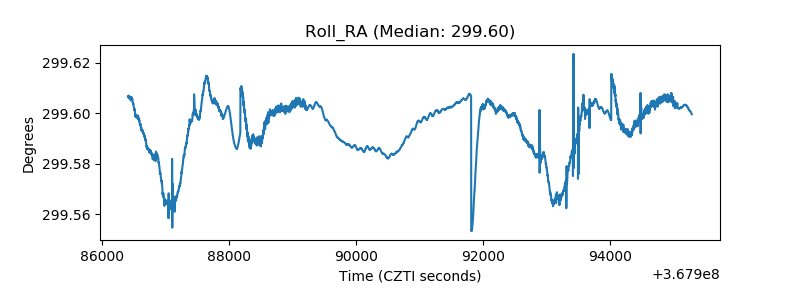 |
| Veto Counter | 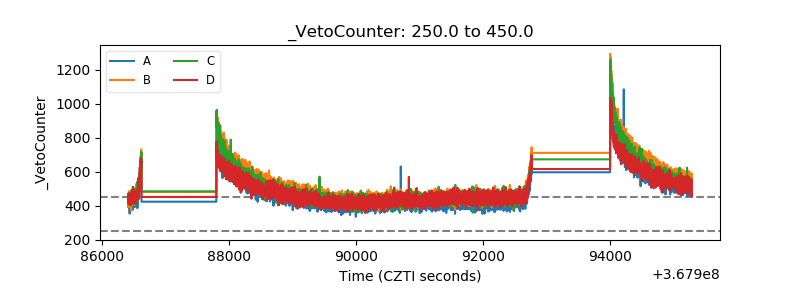 |