| Param | Original file | Final file |
|---|---|---|
| Filename | modeM0/AS1A10_109T01_9000004678_32018cztM0_level2.evt | modeM0/AS1A10_109T01_9000004678_32018cztM0_level2_quad_clean.evt |
| Size (bytes) | 642,237,120 | 80,919,360 |
| Size | 612.5 MB | 77.2 MB |
| Events in quadrant A | 3,691,398 | 520,994 |
| Events in quadrant B | 5,487,693 | 516,250 |
| Events in quadrant C | 4,128,697 | 486,151 |
| Events in quadrant D | 5,699,413 | 469,182 |
| Mode M9 | |||
|---|---|---|---|
| Quadrant | BADHDUFLAG | Total packets | Discarded packets |
| A | 0 | 26 | 0 |
| B | 0 | 26 | 0 |
| C | 0 | 26 | 0 |
| D | 0 | 26 | 0 |
| Mode SS | |||
|---|---|---|---|
| Quadrant | BADHDUFLAG | Total packets | Discarded packets |
| A | 0 | 134 | 0 |
| B | 0 | 134 | 0 |
| C | 0 | 134 | 0 |
| D | 0 | 134 | 0 |
| Mode M0 | |||
|---|---|---|---|
| Quadrant | BADHDUFLAG | Total packets | Discarded packets |
| A | 0 | 14764 | 2 |
| B | 0 | 20385 | 2 |
| C | 0 | 16578 | 2 |
| D | 0 | 21710 | 2 |
| Quadrant | Total seconds | Saturated seconds | Saturation percentage |
|---|---|---|---|
| A | 6568 | 67 | 1.020097% |
| B | 6568 | 180 | 2.740560% |
| C | 6568 | 346 | 5.267966% |
| D | 6568 | 105 | 1.598660% |
Noise dominated data is calculated using 1-second bins in cleaned event files. If a bin has >2000 counts, and if more than 50% of those come from <1% of pixels, then it is considered to be noise-dominated and hence unusable.
| Quadrant | # 1 sec bins | Bins with >0 counts | Bins with >2000 counts | High rate bins dominated by noise | Noise dominated (total time) | Noise dominated (detector-on time) | Marked lightcurve |
|---|---|---|---|---|---|---|---|
| A | 9133 | 6568 | 0 | 0 | 0.00% | 0.00% | 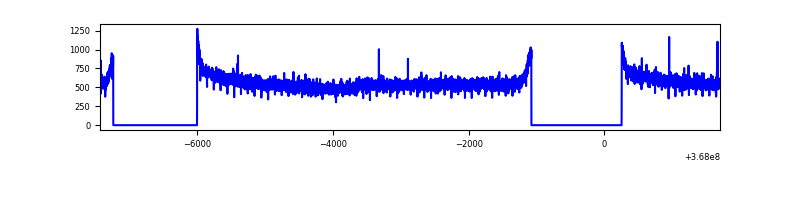 |
| B | 9133 | 6568 | 6 | 6 | 0.07% | 0.09% | 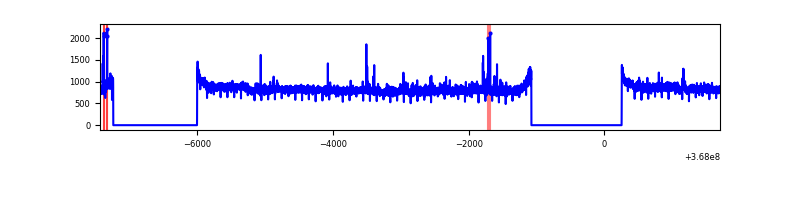 |
| C | 9133 | 6568 | 7 | 7 | 0.08% | 0.11% | 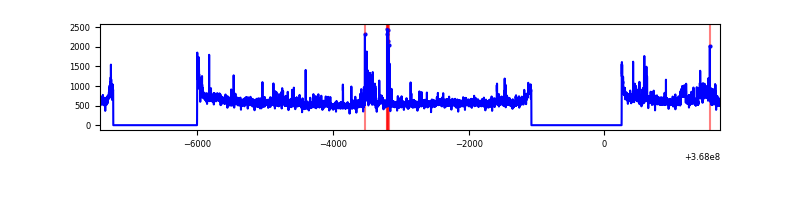 |
| D | 9133 | 6568 | 27 | 27 | 0.30% | 0.41% | 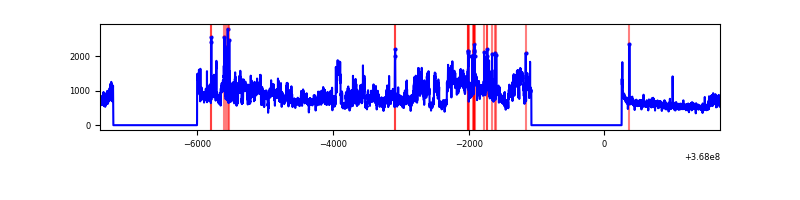 |
Top three noisy pixels from each quadrant. If the there are fewer than three noisy pixels in the level2.evt file, extra rows are filled as -1
| Pixel properties | Quadrant properties | ||||||
|---|---|---|---|---|---|---|---|
| Quadrant | DetID | PixID | Counts | Sigma | Mean | Median | Sigma |
| A | 13 | 254 | 11675 | 57.1 | 956 | 941 | 188.0 |
| A | 3 | 137 | 8466 | 40.03 | 956 | 941 | 188.0 |
| A | 0 | 226 | 7840 | 36.7 | 956 | 941 | 188.0 |
| B | 6 | 159 | 1690316 | 9688.26 | 940 | 919 | 174.4 |
| B | 0 | 190 | 44742 | 251.31 | 940 | 919 | 174.4 |
| B | 10 | 245 | 30194 | 167.88 | 940 | 919 | 174.4 |
| C | 14 | 238 | 205244 | 1006.93 | 883 | 890 | 202.9 |
| C | 3 | 233 | 197768 | 970.09 | 883 | 890 | 202.9 |
| C | 10 | 22 | 83892 | 408.98 | 883 | 890 | 202.9 |
| D | 8 | 195 | 2183816 | 10386.55 | 898 | 875 | 210.2 |
| D | 2 | 250 | 60606 | 284.2 | 898 | 875 | 210.2 |
| D | 12 | 218 | 46230 | 215.8 | 898 | 875 | 210.2 |
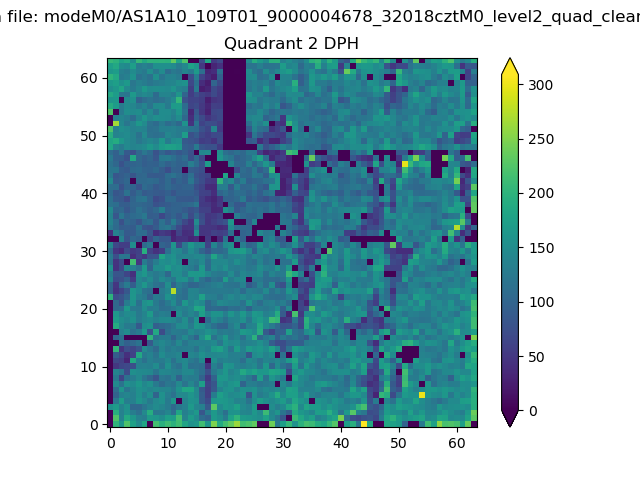
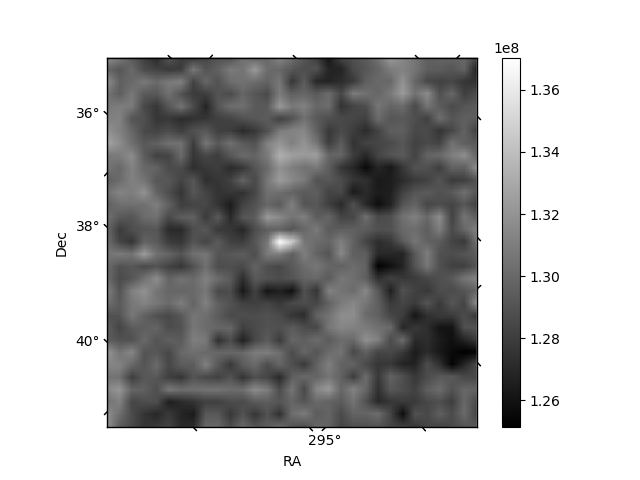
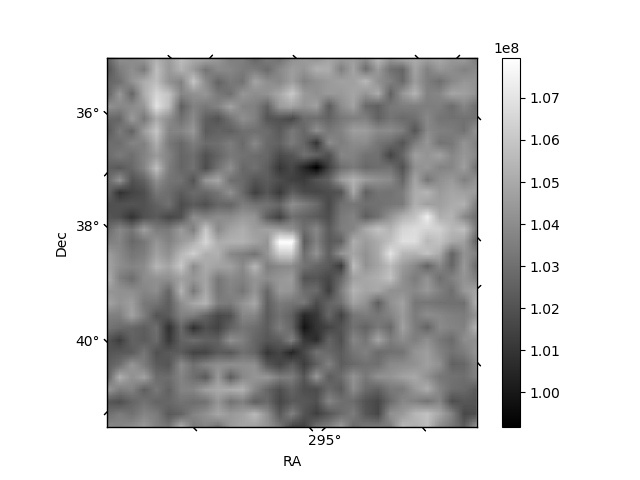
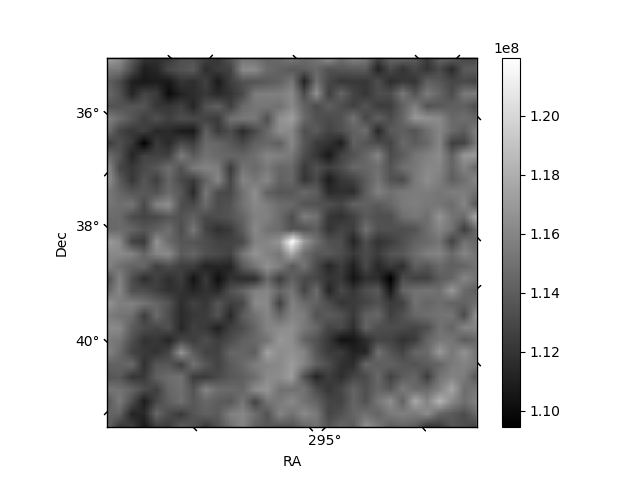
Histogram calculated using DETX and DETY for each event in the final _common_clean file
| Quadrant A | 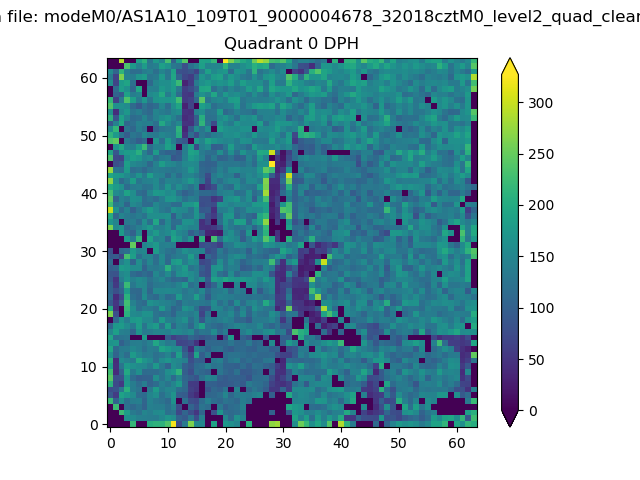 |
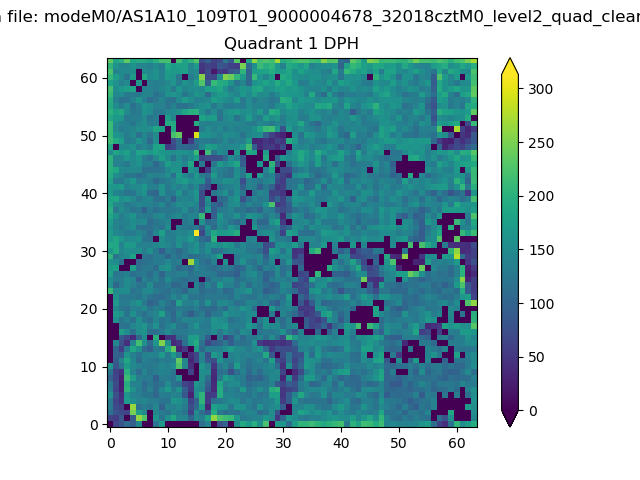 |
Quadrant B |
|---|---|---|---|
| Quadrant D | 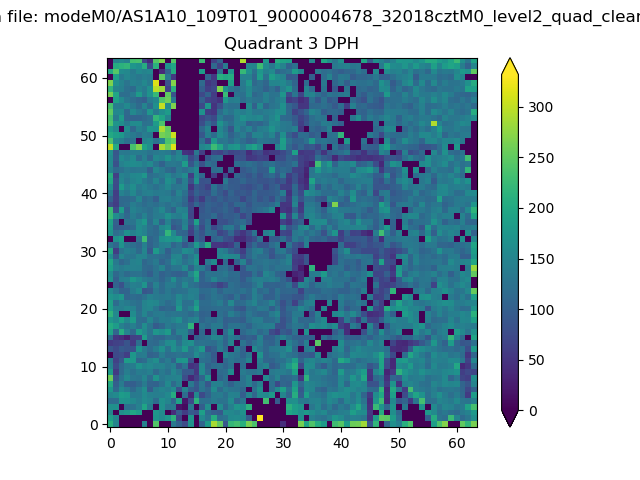 |
 |
Quadrant C |
| Plot type | Count rate plots | Images |
|---|---|---|
| Comparison with Poisson distribution Blue bars denote a histogram of data divided into 1 sec bins. Red curve is a Poisson curve with rate = median count rate of data. |
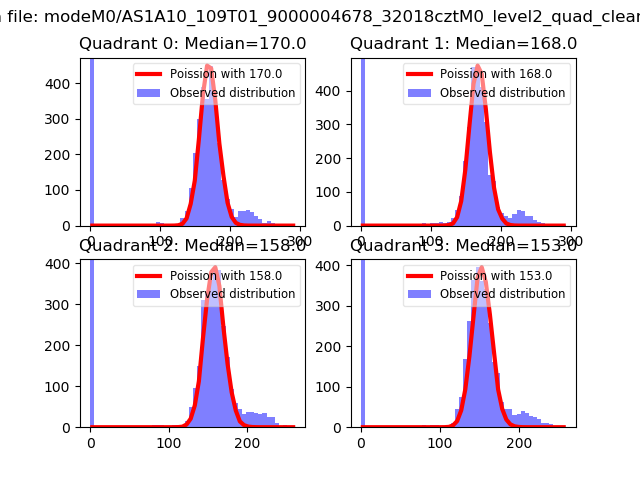 |
 |
| Quadrant-wise count rates Data is divided into 100 sec bins |
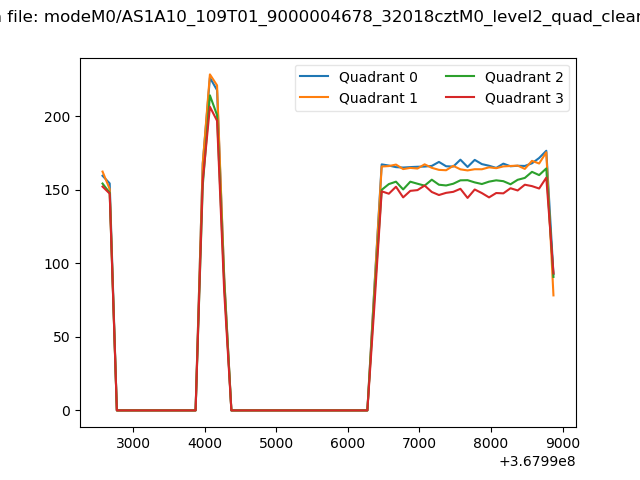 |
|
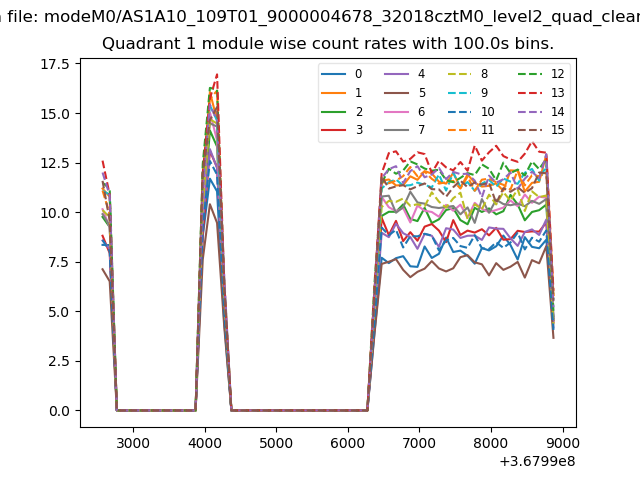
| Module-wise count rates for Quadrant A Data is divided into 100 sec bins |
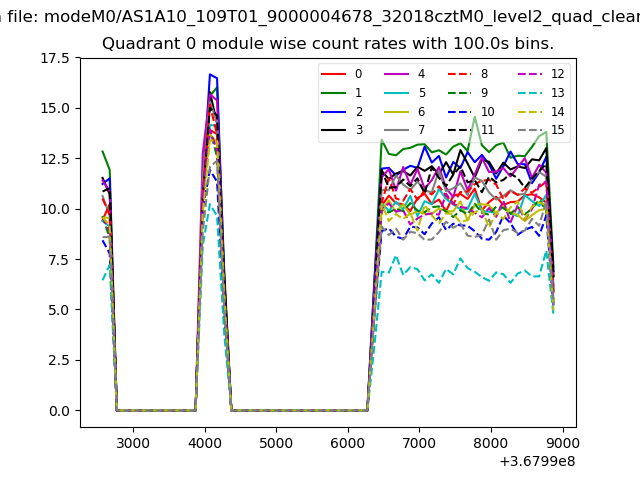 |
 |
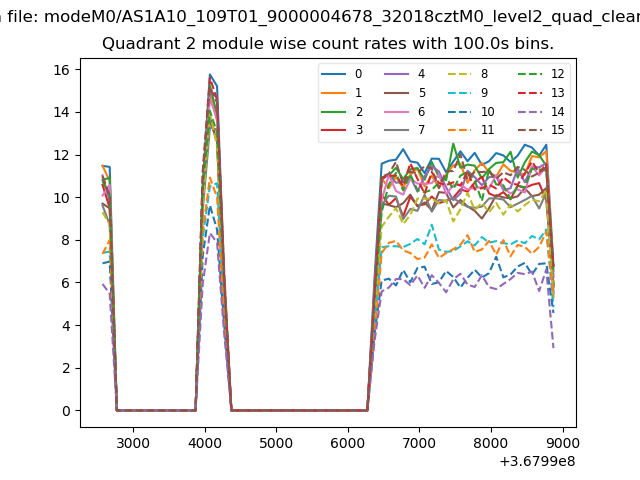
| Module-wise count rates for Quadrant B Data is divided into 100 sec bins |
 |
 |
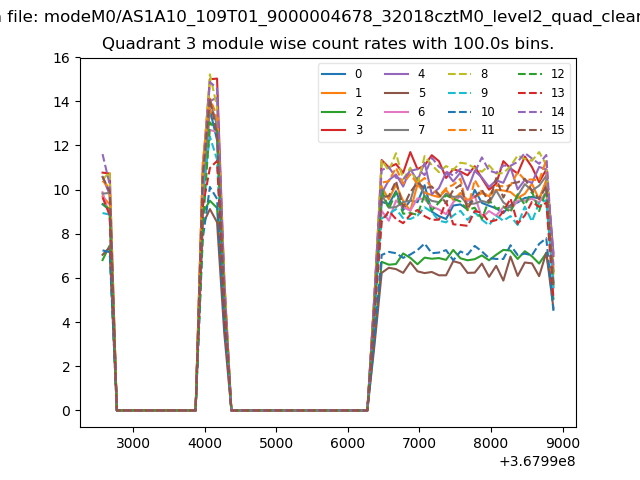
| Module-wise count rates for Quadrant C Data is divided into 100 sec bins |
 |
 |
| Module-wise count rates for Quadrant D Data is divided into 100 sec bins |
 |
 |
| Parameter | Plot |
|---|---|
| CZT HV Monitor | 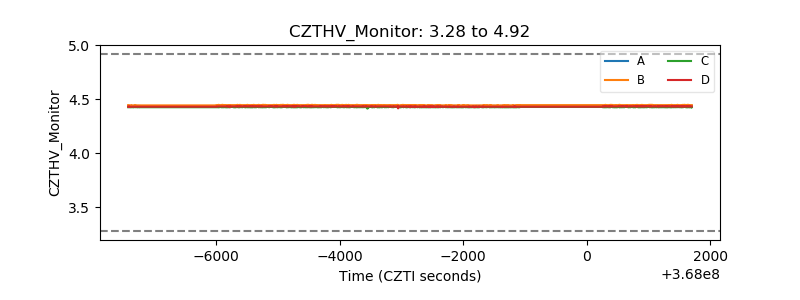 |
| D_VDD |  |
| Temperature 1 | 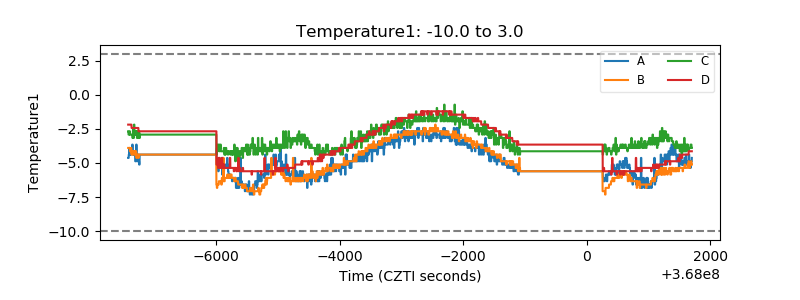 |
| Veto HV Monitor | 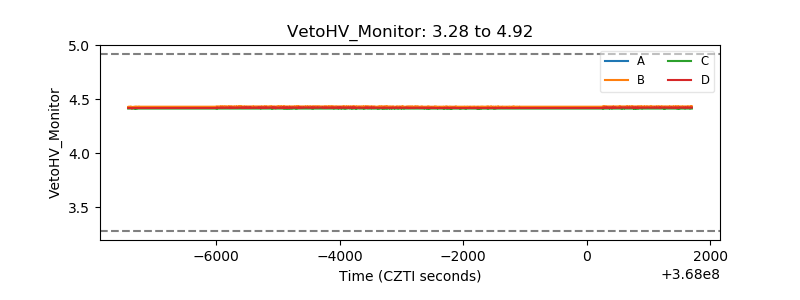 |
| Veto LLD | 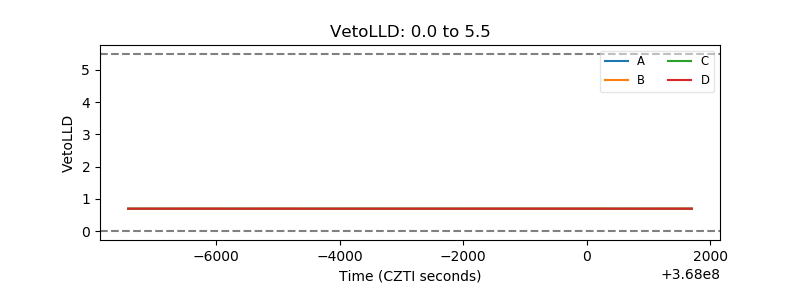 |
| Alpha Counter | 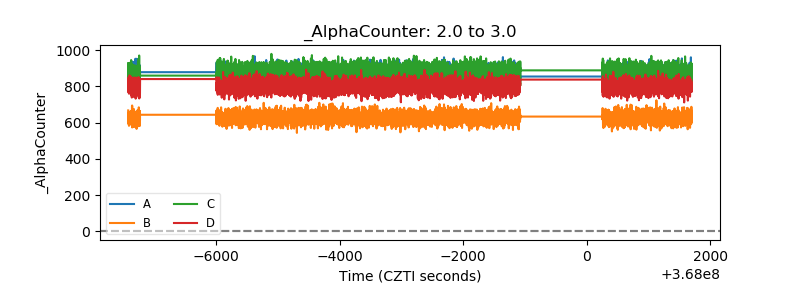 |
| _CPM_Rate | 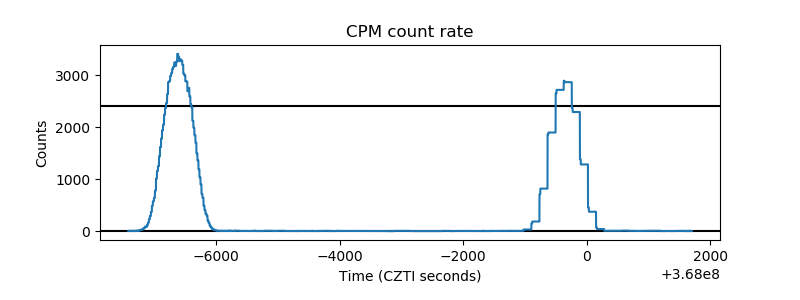 |
| CZT Counter | 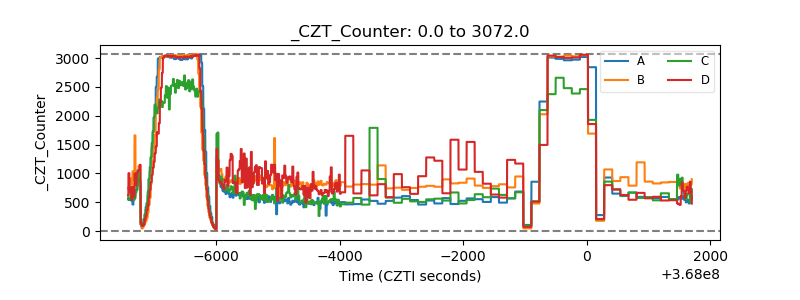 |
| +2.5 Volts monitor |  |
| +5 Volts monitor |  |
| _ROLL_ROT | 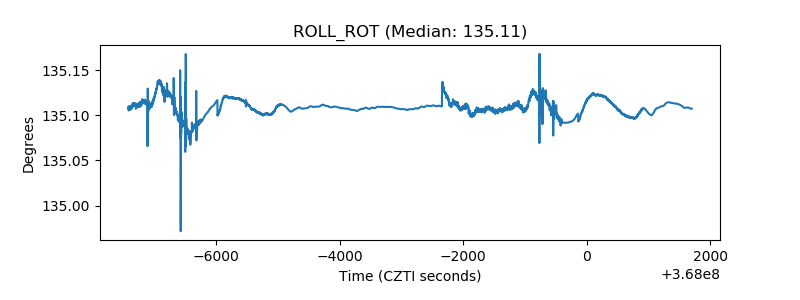 |
| _Roll_DEC | 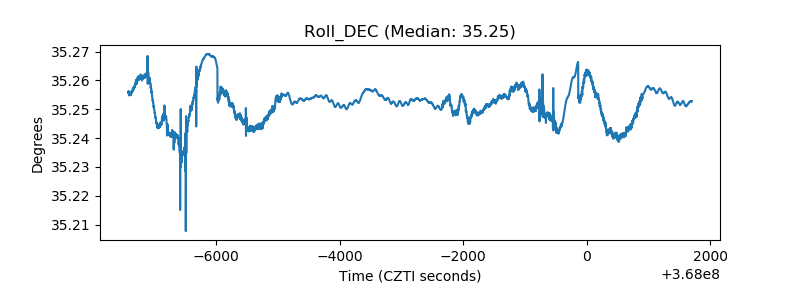 |
| _Roll_RA |  |
| Veto Counter | 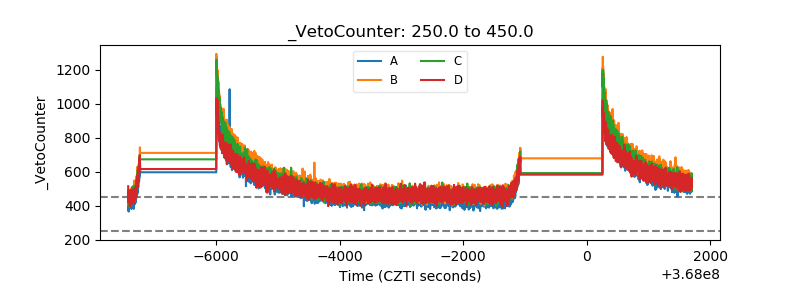 |