| Param | Original file | Final file |
|---|---|---|
| Filename | modeM0/AS1A10_109T01_9000004678_32019cztM0_level2.evt | modeM0/AS1A10_109T01_9000004678_32019cztM0_level2_quad_clean.evt |
| Size (bytes) | 558,910,080 | 77,699,520 |
| Size | 533.0 MB | 74.1 MB |
| Events in quadrant A | 3,517,766 | 501,896 |
| Events in quadrant B | 5,109,930 | 493,931 |
| Events in quadrant C | 3,764,987 | 466,389 |
| Events in quadrant D | 4,116,208 | 459,509 |
| Mode M9 | |||
|---|---|---|---|
| Quadrant | BADHDUFLAG | Total packets | Discarded packets |
| A | 0 | 13 | 0 |
| B | 0 | 13 | 0 |
| C | 0 | 13 | 0 |
| D | 0 | 13 | 0 |
| Mode SS | |||
|---|---|---|---|
| Quadrant | BADHDUFLAG | Total packets | Discarded packets |
| A | 0 | 126 | 0 |
| B | 0 | 126 | 0 |
| C | 0 | 126 | 0 |
| D | 0 | 126 | 0 |
| Mode M0 | |||
|---|---|---|---|
| Quadrant | BADHDUFLAG | Total packets | Discarded packets |
| A | 0 | 14034 | 2 |
| B | 0 | 19062 | 2 |
| C | 0 | 15078 | 2 |
| D | 0 | 16392 | 2 |
| Quadrant | Total seconds | Saturated seconds | Saturation percentage |
|---|---|---|---|
| A | 6173 | 80 | 1.295966% |
| B | 6173 | 149 | 2.413737% |
| C | 6173 | 343 | 5.556456% |
| D | 6173 | 78 | 1.263567% |
Noise dominated data is calculated using 1-second bins in cleaned event files. If a bin has >2000 counts, and if more than 50% of those come from <1% of pixels, then it is considered to be noise-dominated and hence unusable.
| Quadrant | # 1 sec bins | Bins with >0 counts | Bins with >2000 counts | High rate bins dominated by noise | Noise dominated (total time) | Noise dominated (detector-on time) | Marked lightcurve |
|---|---|---|---|---|---|---|---|
| A | 7498 | 6173 | 0 | 0 | 0.00% | 0.00% | 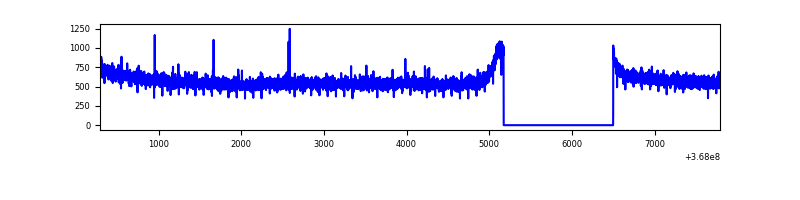 |
| B | 7498 | 6173 | 0 | 0 | 0.00% | 0.00% | 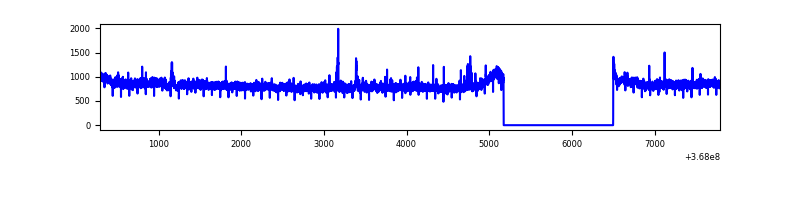 |
| C | 7498 | 6173 | 1 | 1 | 0.01% | 0.02% | 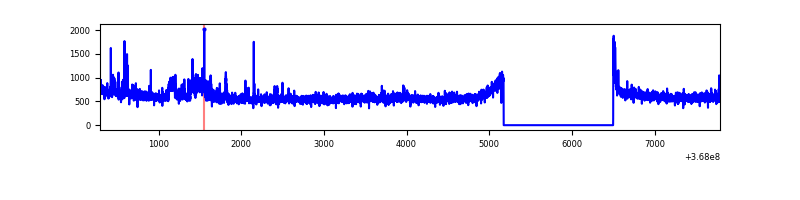 |
| D | 7498 | 6173 | 14 | 14 | 0.19% | 0.23% | 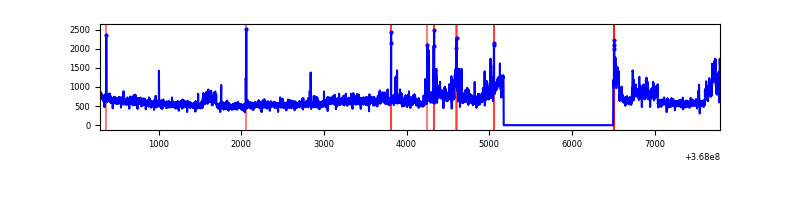 |
Top three noisy pixels from each quadrant. If the there are fewer than three noisy pixels in the level2.evt file, extra rows are filled as -1
| Pixel properties | Quadrant properties | ||||||
|---|---|---|---|---|---|---|---|
| Quadrant | DetID | PixID | Counts | Sigma | Mean | Median | Sigma |
| A | 13 | 254 | 11170 | 57.39 | 910 | 895 | 179.0 |
| A | 13 | 6 | 8489 | 42.41 | 910 | 895 | 179.0 |
| A | 3 | 137 | 8100 | 40.24 | 910 | 895 | 179.0 |
| B | 6 | 159 | 1550524 | 9331.17 | 891 | 872 | 166.1 |
| B | 0 | 190 | 30261 | 176.96 | 891 | 872 | 166.1 |
| B | 0 | 229 | 22347 | 129.31 | 891 | 872 | 166.1 |
| C | 14 | 238 | 207944 | 1082.48 | 836 | 846 | 191.3 |
| C | 3 | 233 | 136229 | 707.63 | 836 | 846 | 191.3 |
| C | 14 | 254 | 92473 | 478.92 | 836 | 846 | 191.3 |
| D | 8 | 195 | 712788 | 3553.85 | 859 | 840 | 200.3 |
| D | 12 | 218 | 93410 | 462.08 | 859 | 840 | 200.3 |
| D | 10 | 199 | 30476 | 147.94 | 859 | 840 | 200.3 |
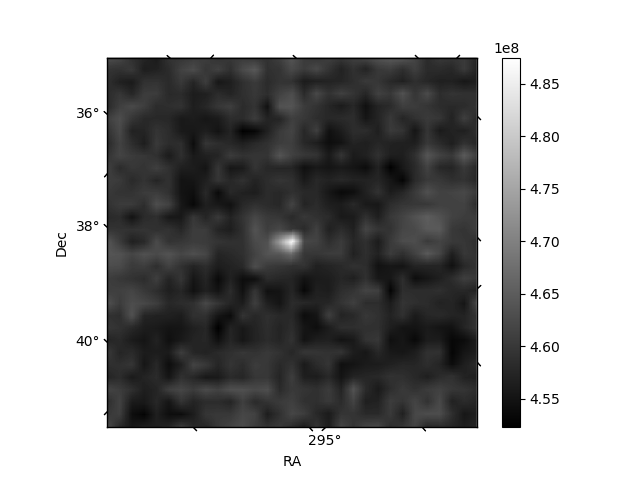
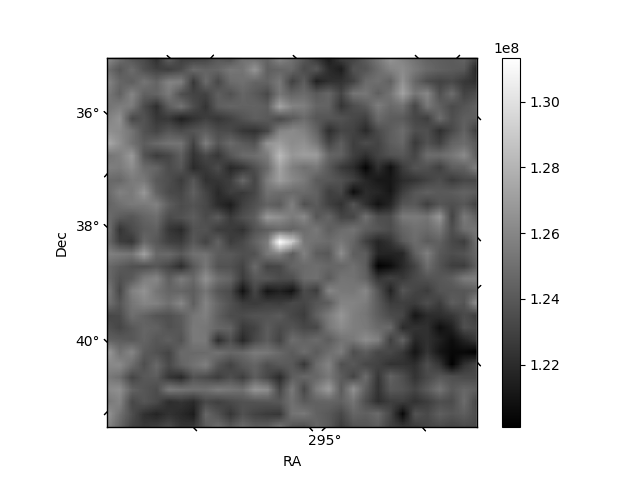
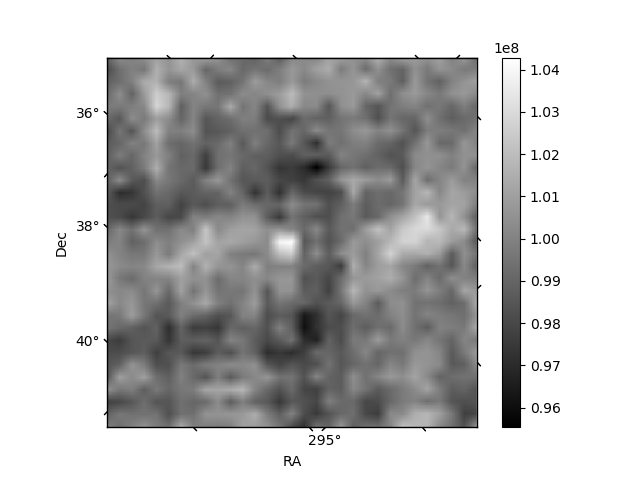
Histogram calculated using DETX and DETY for each event in the final _common_clean file
| Quadrant A | 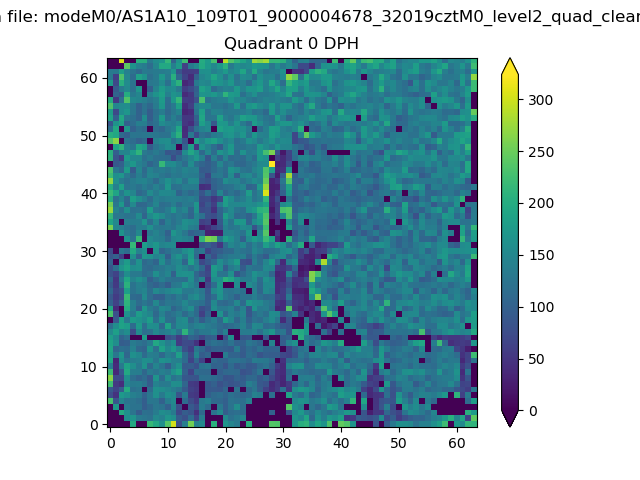 |
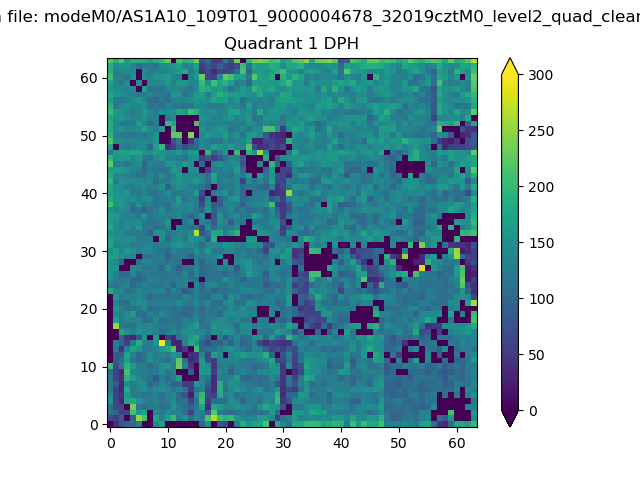 |
Quadrant B |
|---|---|---|---|
| Quadrant D |  |
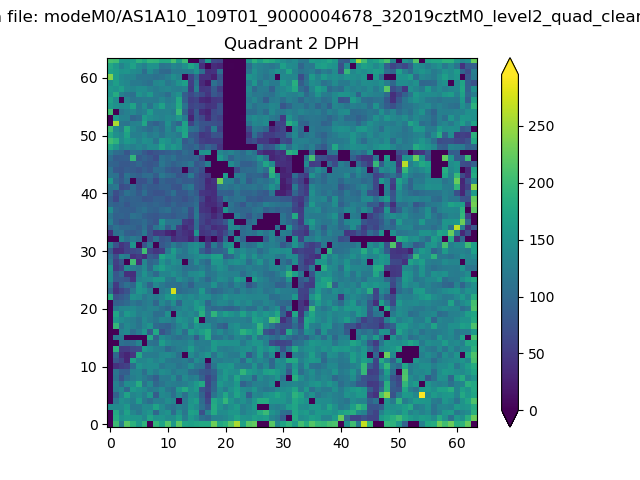 |
Quadrant C |
| Plot type | Count rate plots | Images |
|---|---|---|
| Comparison with Poisson distribution Blue bars denote a histogram of data divided into 1 sec bins. Red curve is a Poisson curve with rate = median count rate of data. |
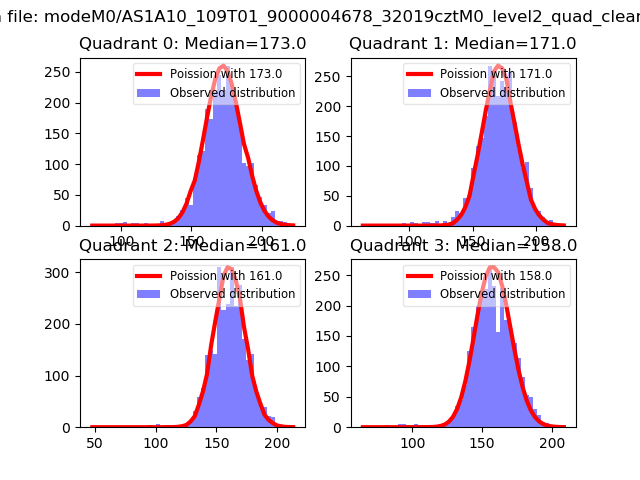 |
 |
| Quadrant-wise count rates Data is divided into 100 sec bins |
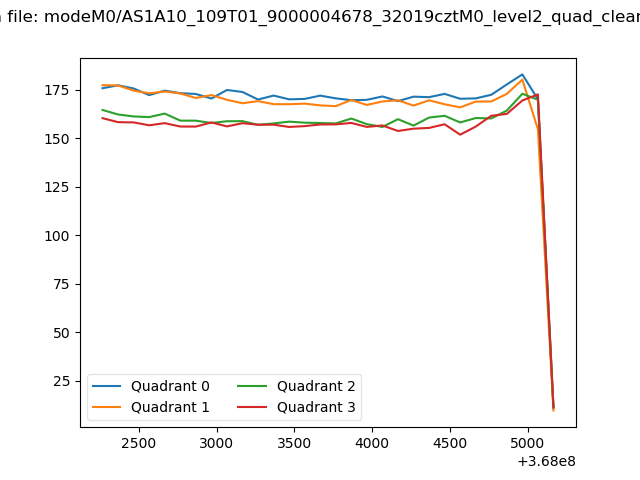 |
|
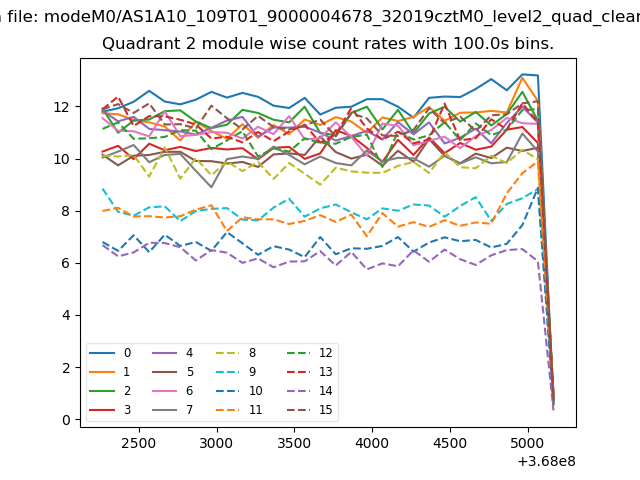
| Module-wise count rates for Quadrant A Data is divided into 100 sec bins |
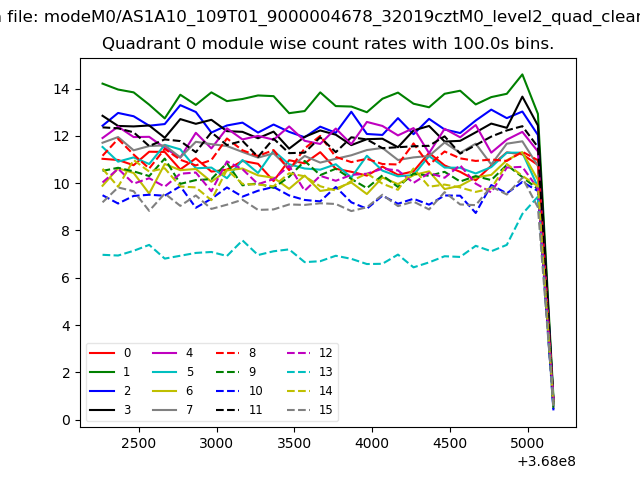 |
 |
| Module-wise count rates for Quadrant B Data is divided into 100 sec bins |
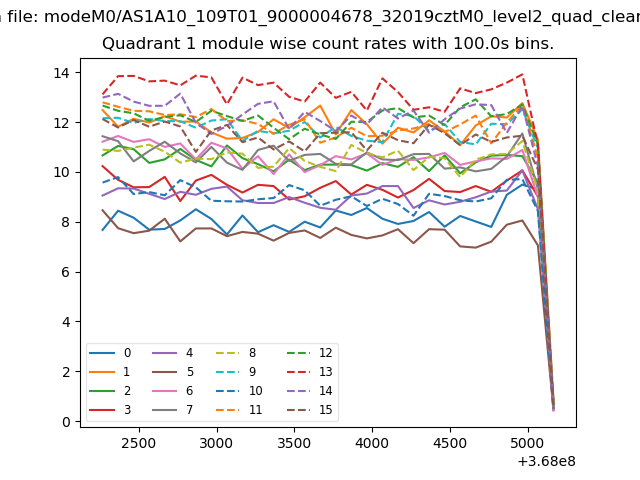 |
 |
| Module-wise count rates for Quadrant C Data is divided into 100 sec bins |
 |
 |
| Module-wise count rates for Quadrant D Data is divided into 100 sec bins |
 |
 |
| Parameter | Plot |
|---|---|
| CZT HV Monitor | 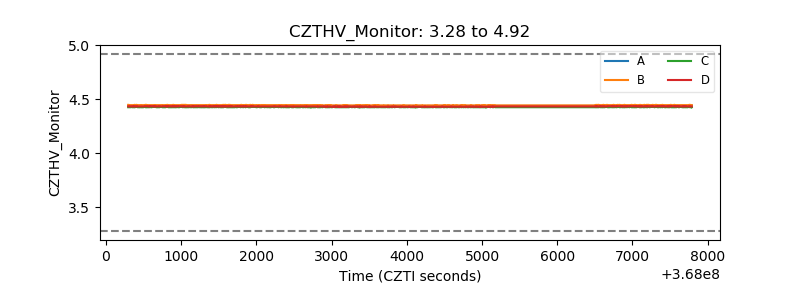 |
| D_VDD | 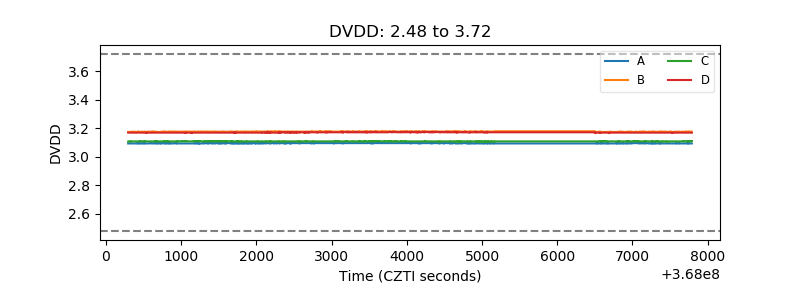 |
| Temperature 1 | 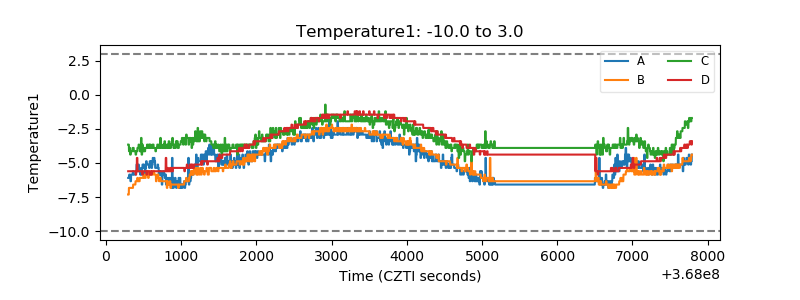 |
| Veto HV Monitor | 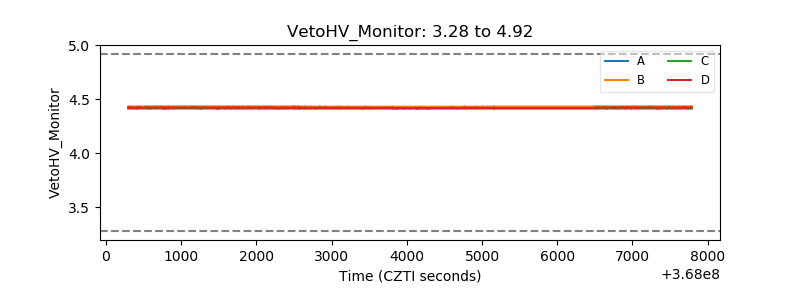 |
| Veto LLD | 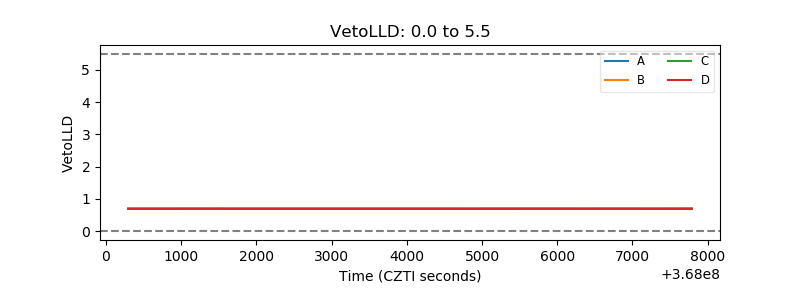 |
| Alpha Counter | 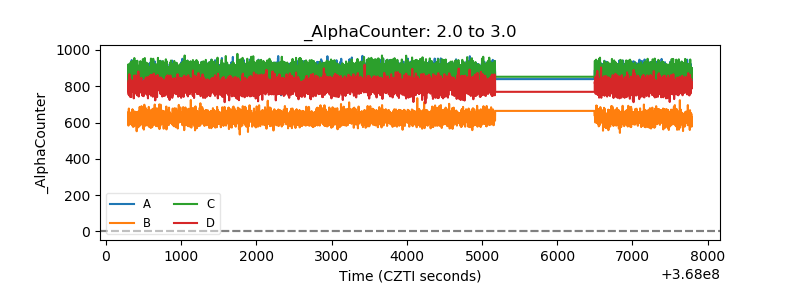 |
| _CPM_Rate | 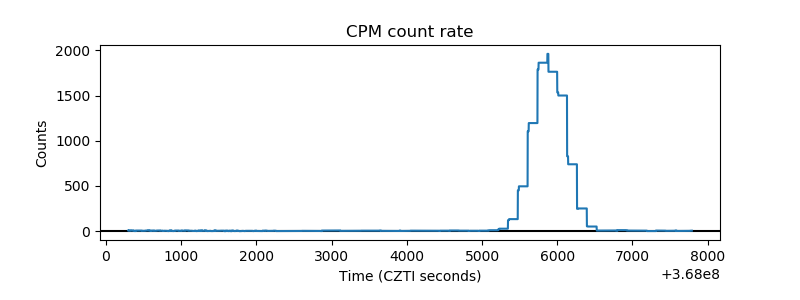 |
| CZT Counter | 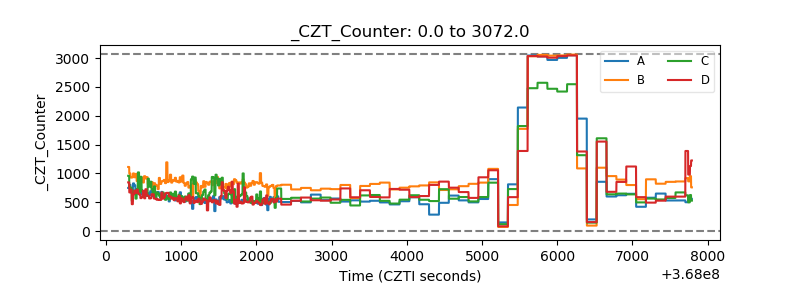 |
| +2.5 Volts monitor | 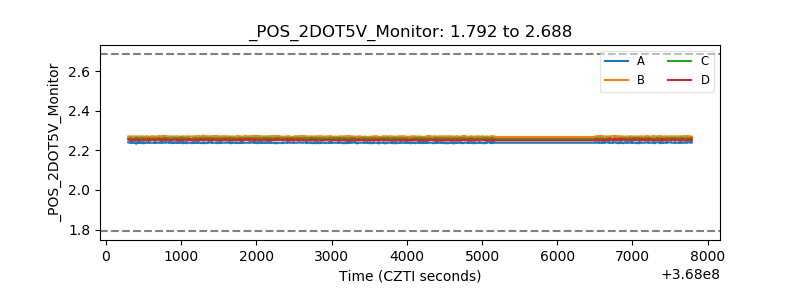 |
| +5 Volts monitor | 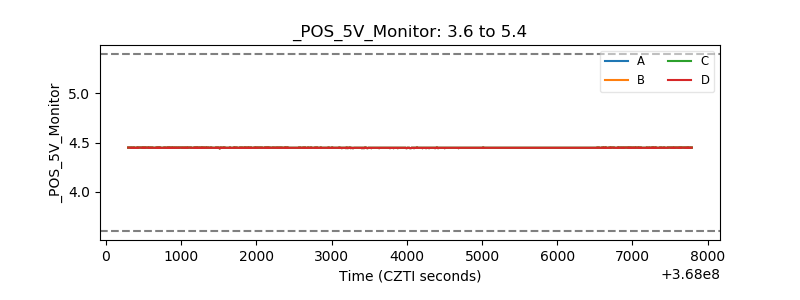 |
| _ROLL_ROT | 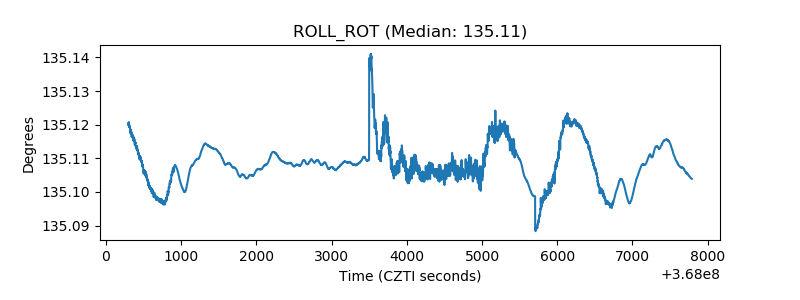 |
| _Roll_DEC | 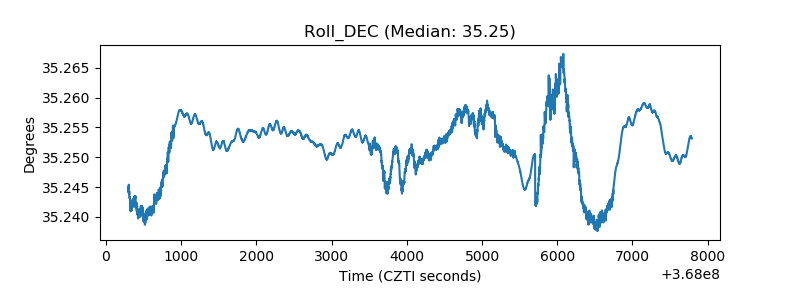 |
| _Roll_RA | 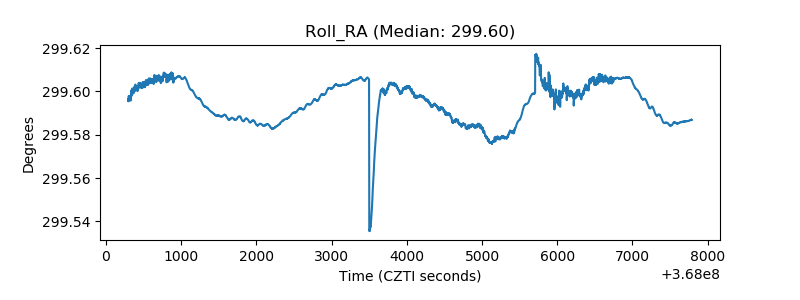 |
| Veto Counter | 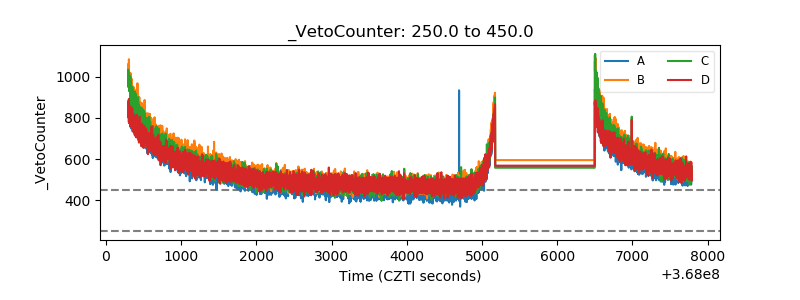 |