| Param | Original file | Final file |
|---|---|---|
| Filename | modeM0/AS1A10_109T01_9000004678_32022cztM0_level2.evt | modeM0/AS1A10_109T01_9000004678_32022cztM0_level2_quad_clean.evt |
| Size (bytes) | 643,786,560 | 112,999,680 |
| Size | 614.0 MB | 107.8 MB |
| Events in quadrant A | 3,728,243 | 760,090 |
| Events in quadrant B | 5,798,466 | 747,218 |
| Events in quadrant C | 4,159,371 | 711,305 |
| Events in quadrant D | 5,314,860 | 693,001 |
| Mode M9 | |||
|---|---|---|---|
| Quadrant | BADHDUFLAG | Total packets | Discarded packets |
| A | 0 | 17 | 0 |
| B | 0 | 17 | 0 |
| C | 0 | 17 | 0 |
| D | 0 | 17 | 0 |
| Mode SS | |||
|---|---|---|---|
| Quadrant | BADHDUFLAG | Total packets | Discarded packets |
| A | 0 | 150 | 0 |
| B | 0 | 150 | 0 |
| C | 0 | 150 | 0 |
| D | 0 | 150 | 0 |
| Mode M0 | |||
|---|---|---|---|
| Quadrant | BADHDUFLAG | Total packets | Discarded packets |
| A | 0 | 15277 | 2 |
| B | 0 | 22574 | 2 |
| C | 0 | 16651 | 2 |
| D | 0 | 20725 | 2 |
| Quadrant | Total seconds | Saturated seconds | Saturation percentage |
|---|---|---|---|
| A | 7340 | 149 | 2.029973% |
| B | 7340 | 262 | 3.569482% |
| C | 7340 | 284 | 3.869210% |
| D | 7341 | 181 | 2.465604% |
Noise dominated data is calculated using 1-second bins in cleaned event files. If a bin has >2000 counts, and if more than 50% of those come from <1% of pixels, then it is considered to be noise-dominated and hence unusable.
| Quadrant | # 1 sec bins | Bins with >0 counts | Bins with >2000 counts | High rate bins dominated by noise | Noise dominated (total time) | Noise dominated (detector-on time) | Marked lightcurve |
|---|---|---|---|---|---|---|---|
| A | 8940 | 7340 | 0 | 0 | 0.00% | 0.00% | 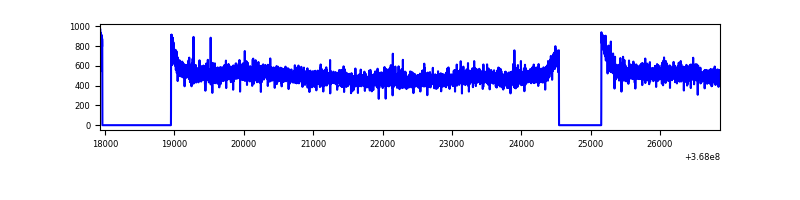 |
| B | 8940 | 7340 | 14 | 14 | 0.16% | 0.19% | 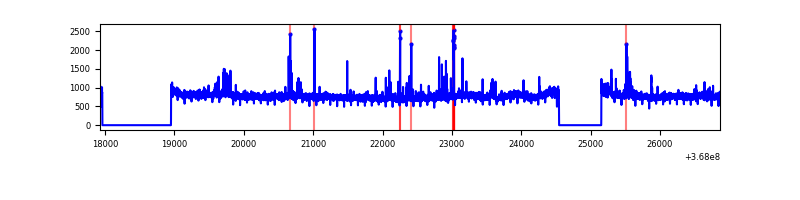 |
| C | 8940 | 7340 | 40 | 40 | 0.45% | 0.54% | 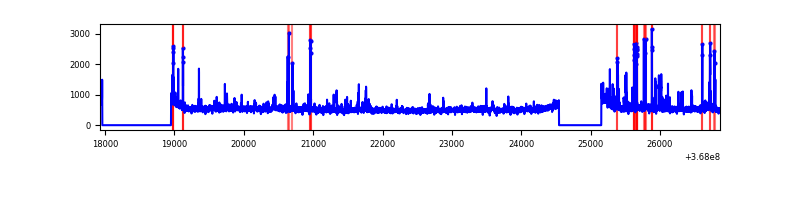 |
| D | 8941 | 7341 | 32 | 32 | 0.36% | 0.44% | 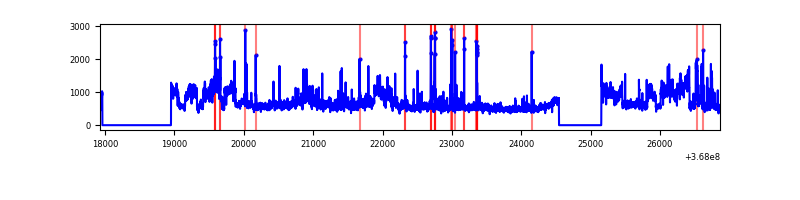 |
Top three noisy pixels from each quadrant. If the there are fewer than three noisy pixels in the level2.evt file, extra rows are filled as -1
| Pixel properties | Quadrant properties | ||||||
|---|---|---|---|---|---|---|---|
| Quadrant | DetID | PixID | Counts | Sigma | Mean | Median | Sigma |
| A | 13 | 6 | 15633 | 75.78 | 962 | 946 | 193.8 |
| A | 13 | 254 | 13811 | 66.38 | 962 | 946 | 193.8 |
| A | 3 | 137 | 9324 | 43.23 | 962 | 946 | 193.8 |
| B | 6 | 159 | 1907845 | 10647.78 | 938 | 916 | 179.1 |
| B | 0 | 190 | 87799 | 485.13 | 938 | 916 | 179.1 |
| B | 12 | 18 | 45958 | 251.5 | 938 | 916 | 179.1 |
| C | 0 | 10 | 282455 | 1335.59 | 906 | 913 | 210.8 |
| C | 3 | 233 | 159250 | 751.12 | 906 | 913 | 210.8 |
| C | 14 | 238 | 149065 | 702.81 | 906 | 913 | 210.8 |
| D | 8 | 195 | 1526044 | 6951.23 | 922 | 901 | 219.4 |
| D | 2 | 250 | 120650 | 545.79 | 922 | 901 | 219.4 |
| D | 10 | 199 | 80095 | 360.95 | 922 | 901 | 219.4 |
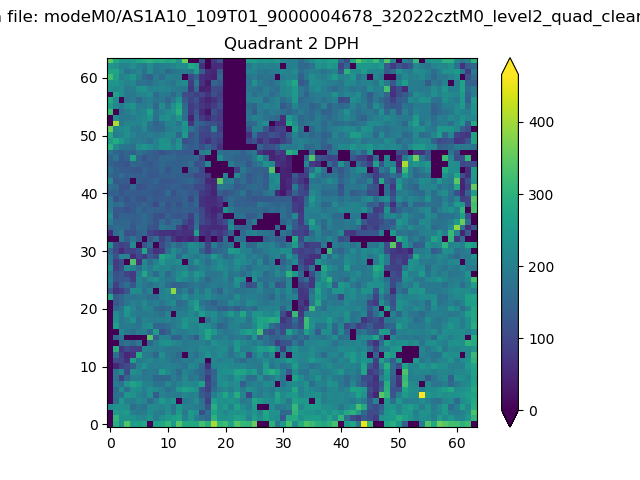
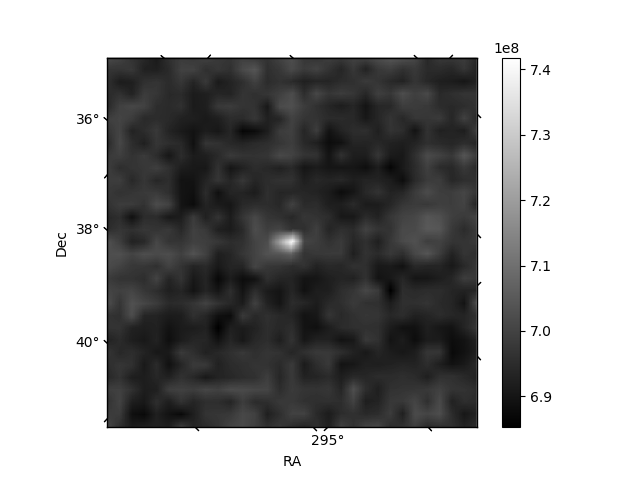
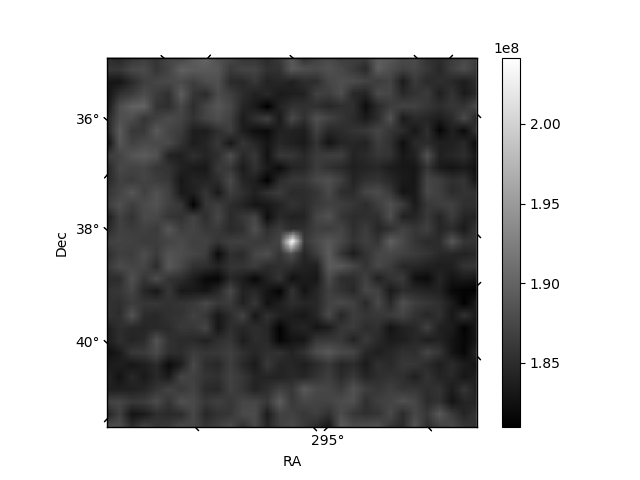
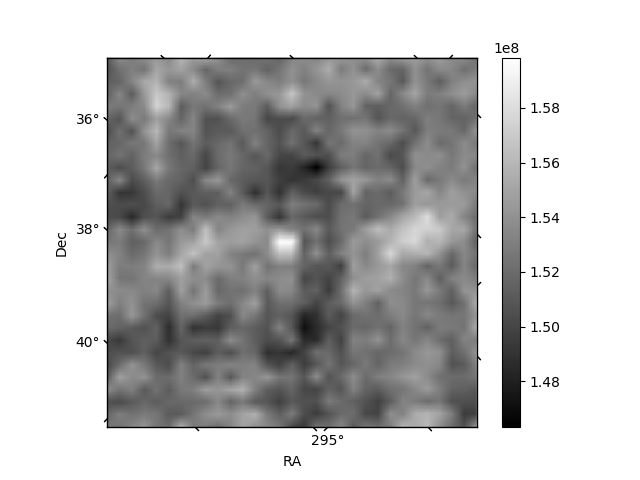
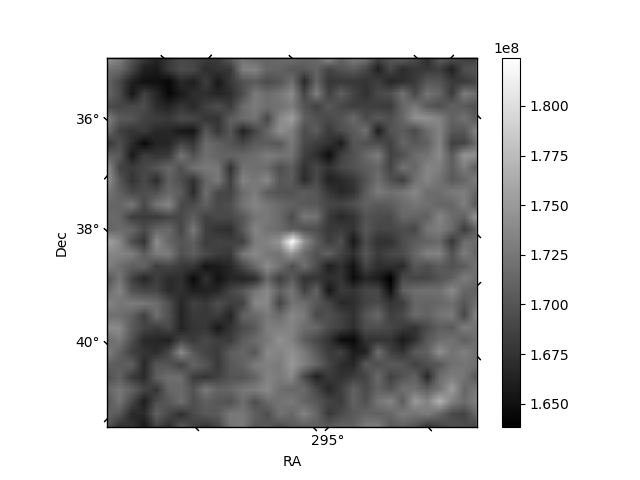
Histogram calculated using DETX and DETY for each event in the final _common_clean file
| Quadrant A | 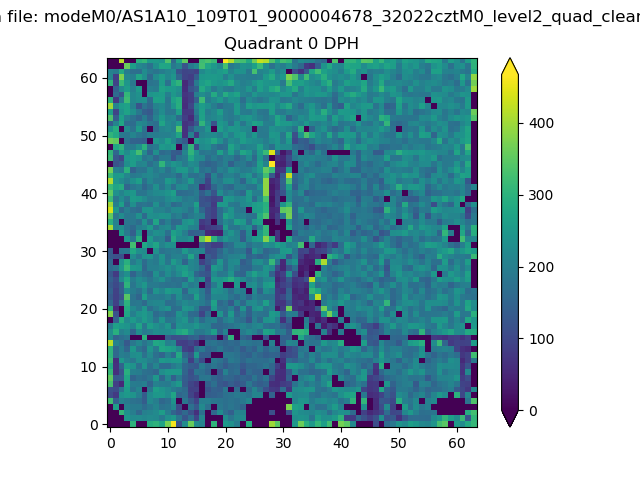 |
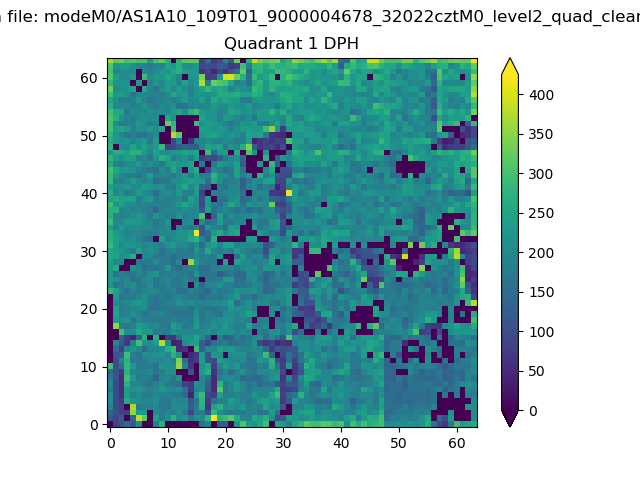 |
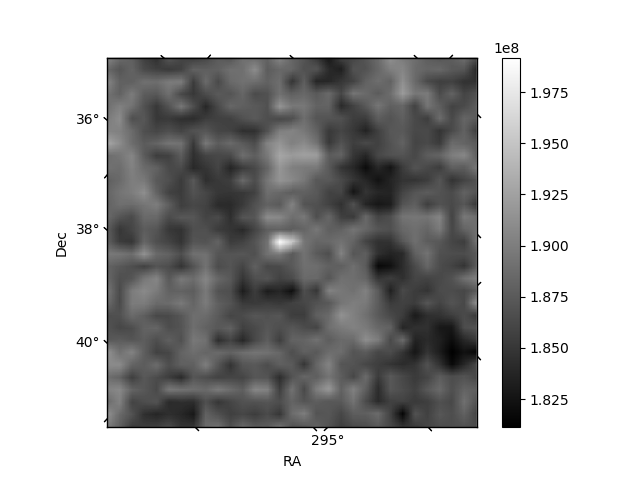
Quadrant B |
|---|---|---|---|
| Quadrant D | 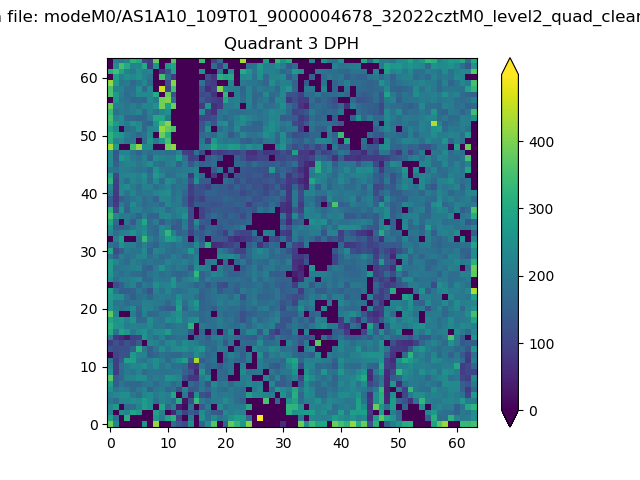 |
 |
Quadrant C |
| Plot type | Count rate plots | Images |
|---|---|---|
| Comparison with Poisson distribution Blue bars denote a histogram of data divided into 1 sec bins. Red curve is a Poisson curve with rate = median count rate of data. |
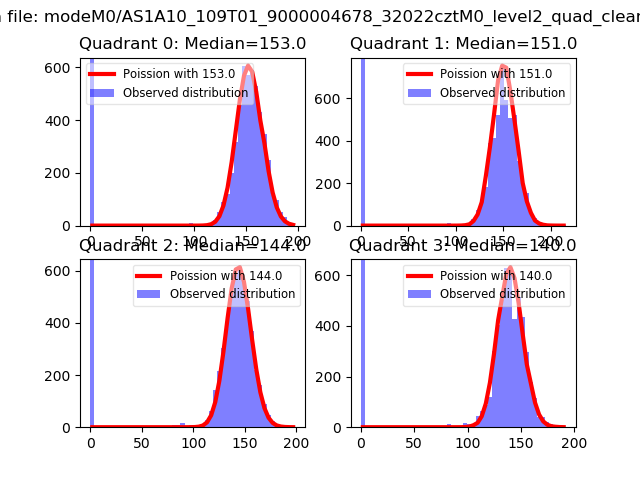 |
 |
| Quadrant-wise count rates Data is divided into 100 sec bins |
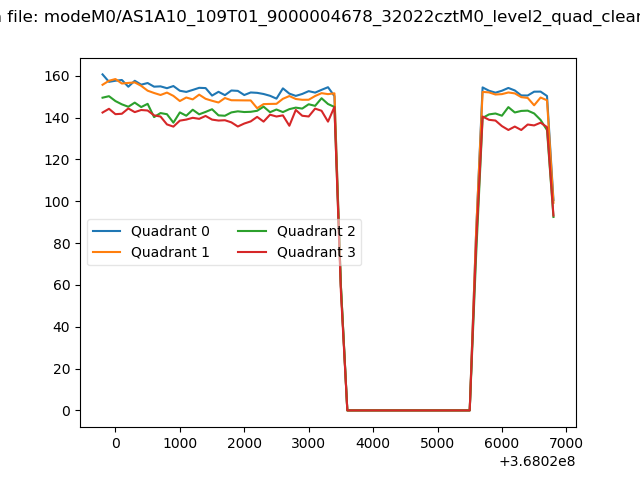 |
|
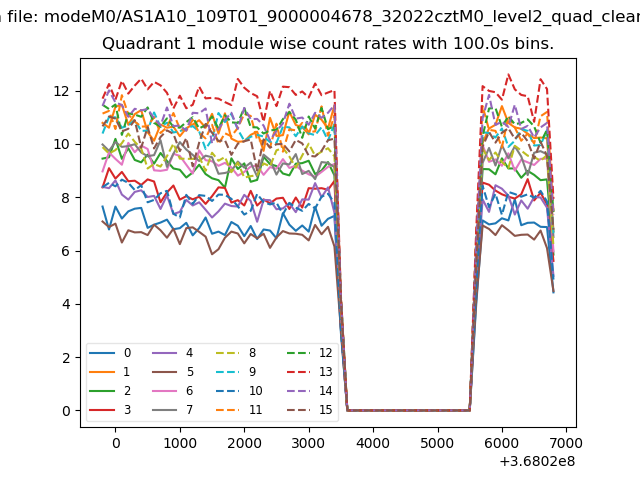
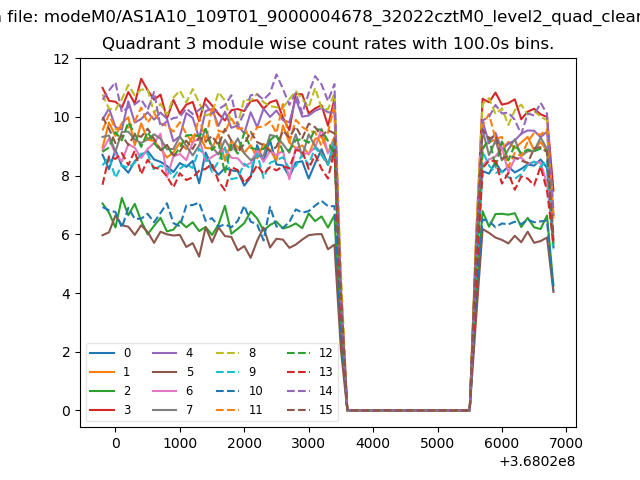
| Module-wise count rates for Quadrant A Data is divided into 100 sec bins |
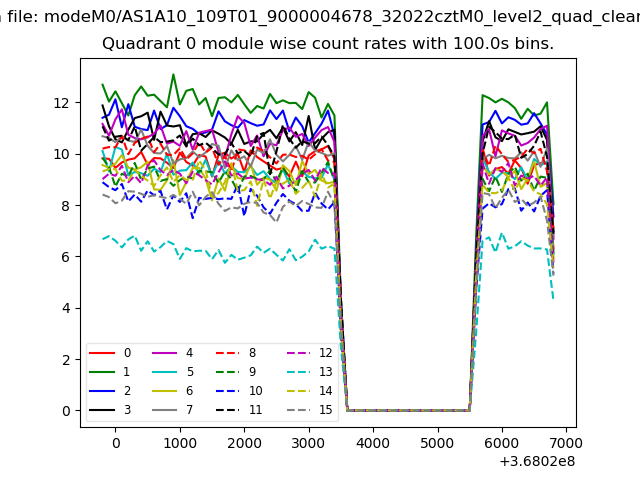 |
 |
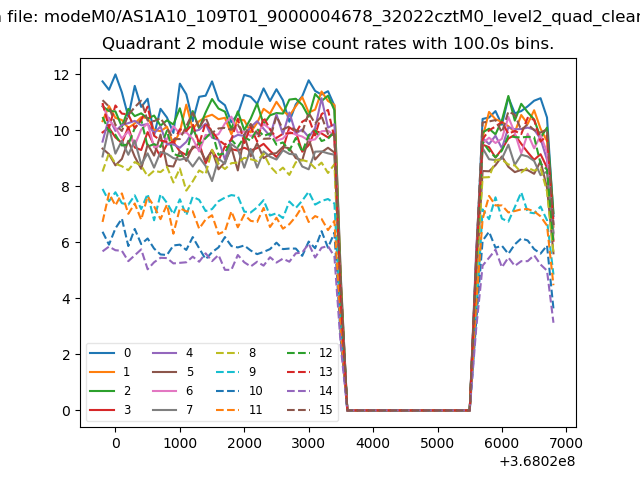
| Module-wise count rates for Quadrant B Data is divided into 100 sec bins |
 |
 |
| Module-wise count rates for Quadrant C Data is divided into 100 sec bins |
 |
 |
| Module-wise count rates for Quadrant D Data is divided into 100 sec bins |
 |
 |
| Parameter | Plot |
|---|---|
| CZT HV Monitor | 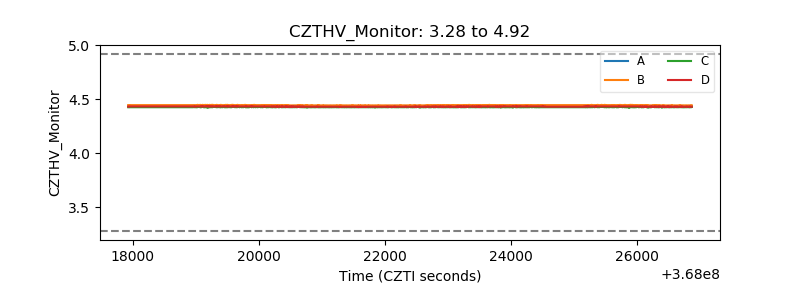 |
| D_VDD | 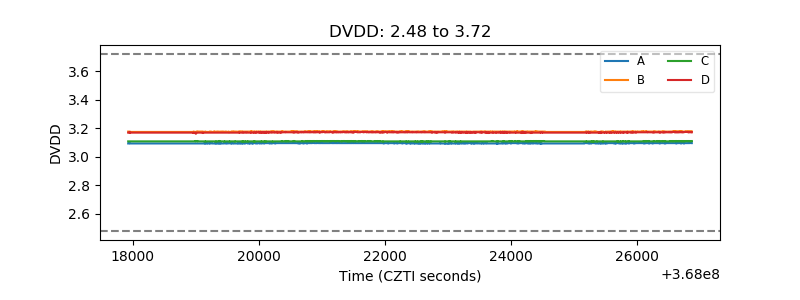 |
| Temperature 1 | 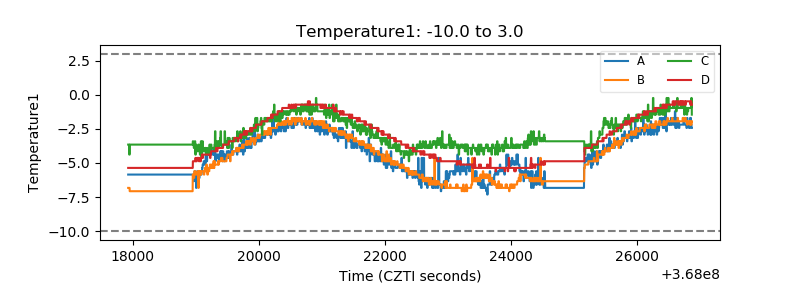 |
| Veto HV Monitor | 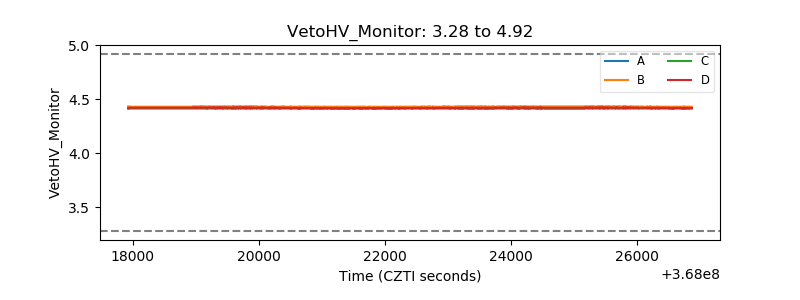 |
| Veto LLD | 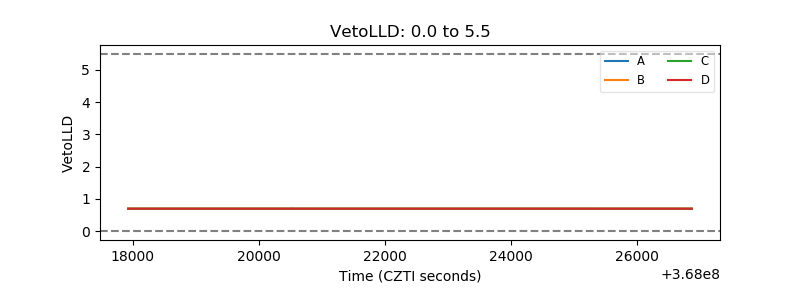 |
| Alpha Counter | 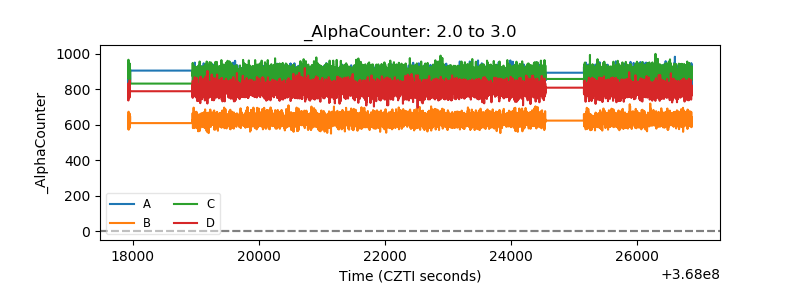 |
| _CPM_Rate | 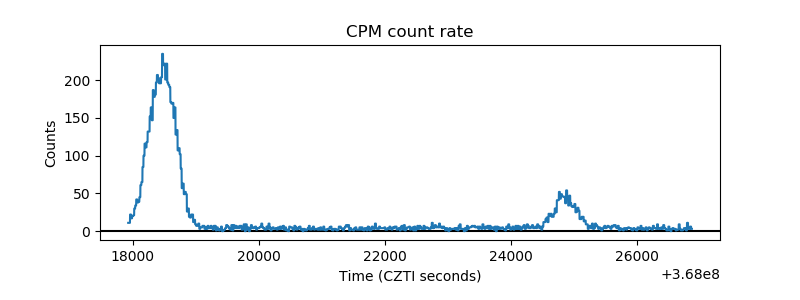 |
| CZT Counter | 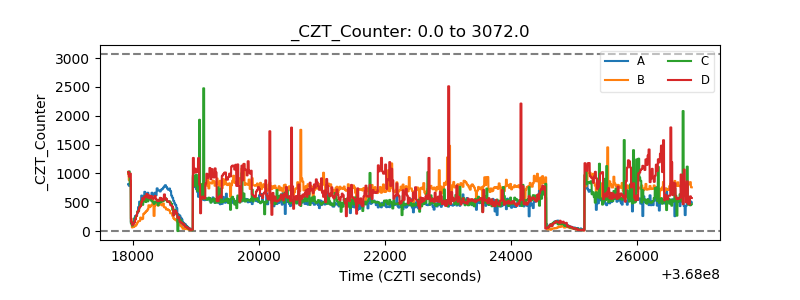 |
| +2.5 Volts monitor |  |
| +5 Volts monitor |  |
| _ROLL_ROT | 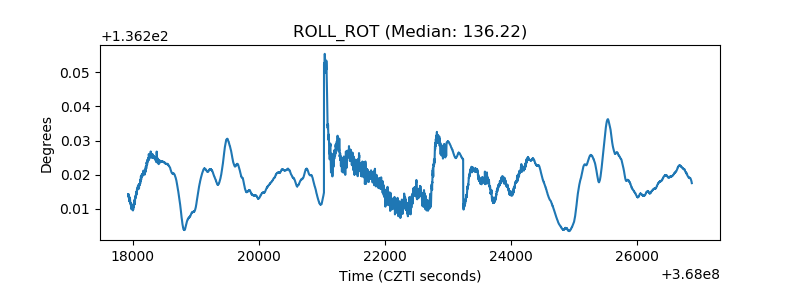 |
| _Roll_DEC | 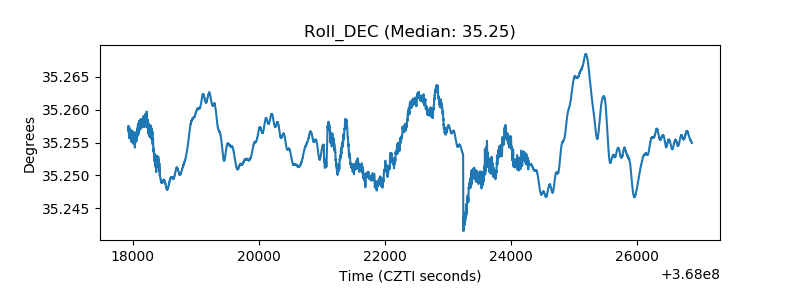 |
| _Roll_RA | 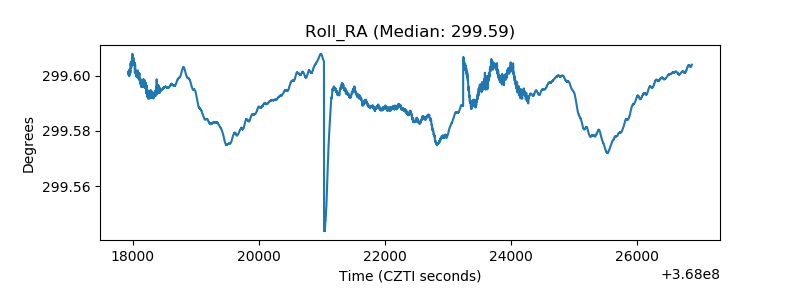 |
| Veto Counter | 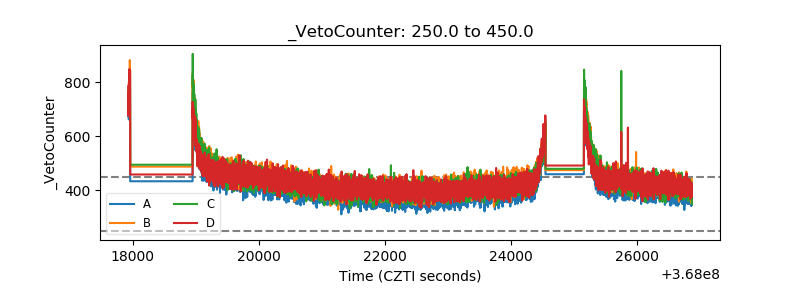 |