| Param | Original file | Final file |
|---|---|---|
| Filename | modeM0/AS1A10_109T01_9000004678_32023cztM0_level2.evt | modeM0/AS1A10_109T01_9000004678_32023cztM0_level2_quad_clean.evt |
| Size (bytes) | 644,754,240 | 112,579,200 |
| Size | 614.9 MB | 107.4 MB |
| Events in quadrant A | 3,590,656 | 765,418 |
| Events in quadrant B | 6,315,005 | 735,694 |
| Events in quadrant C | 4,243,257 | 717,913 |
| Events in quadrant D | 4,898,484 | 697,325 |
| Mode M9 | |||
|---|---|---|---|
| Quadrant | BADHDUFLAG | Total packets | Discarded packets |
| A | 0 | 2 | 0 |
| B | 0 | 2 | 0 |
| C | 0 | 2 | 0 |
| D | 0 | 2 | 0 |
| Mode SS | |||
|---|---|---|---|
| Quadrant | BADHDUFLAG | Total packets | Discarded packets |
| A | 0 | 142 | 0 |
| B | 0 | 142 | 0 |
| C | 0 | 142 | 0 |
| D | 0 | 142 | 0 |
| Mode M0 | |||
|---|---|---|---|
| Quadrant | BADHDUFLAG | Total packets | Discarded packets |
| A | 0 | 14921 | 1 |
| B | 0 | 23912 | 1 |
| C | 0 | 16907 | 2 |
| D | 0 | 19271 | 1 |
| Quadrant | Total seconds | Saturated seconds | Saturation percentage |
|---|---|---|---|
| A | 7087 | 200 | 2.822069% |
| B | 7087 | 604 | 8.522647% |
| C | 7086 | 373 | 5.263901% |
| D | 7087 | 298 | 4.204882% |
Noise dominated data is calculated using 1-second bins in cleaned event files. If a bin has >2000 counts, and if more than 50% of those come from <1% of pixels, then it is considered to be noise-dominated and hence unusable.
| Quadrant | # 1 sec bins | Bins with >0 counts | Bins with >2000 counts | High rate bins dominated by noise | Noise dominated (total time) | Noise dominated (detector-on time) | Marked lightcurve |
|---|---|---|---|---|---|---|---|
| A | 7202 | 7087 | 0 | 0 | 0.00% | 0.00% | 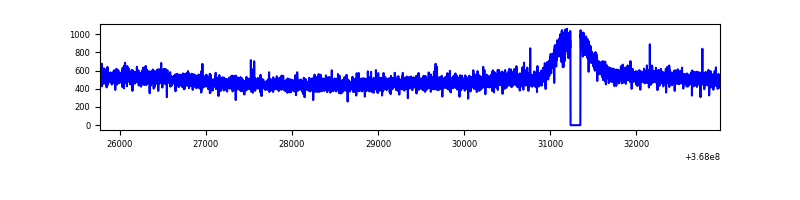 |
| B | 7202 | 7087 | 207 | 207 | 2.87% | 2.92% | 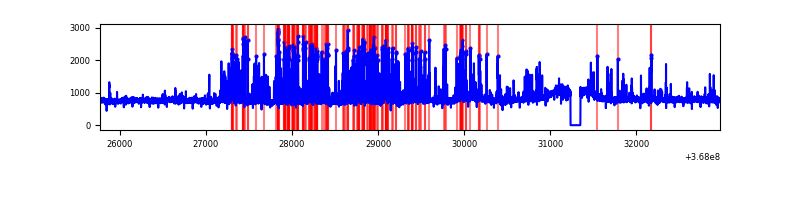 |
| C | 7201 | 7086 | 58 | 58 | 0.81% | 0.82% | 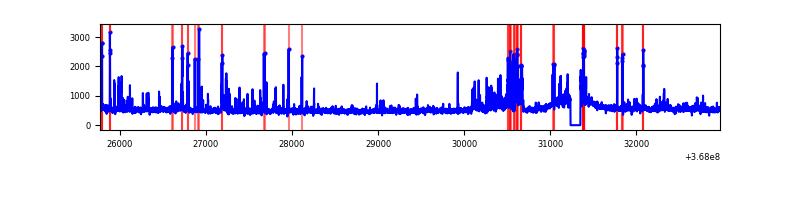 |
| D | 7202 | 7087 | 126 | 126 | 1.75% | 1.78% | 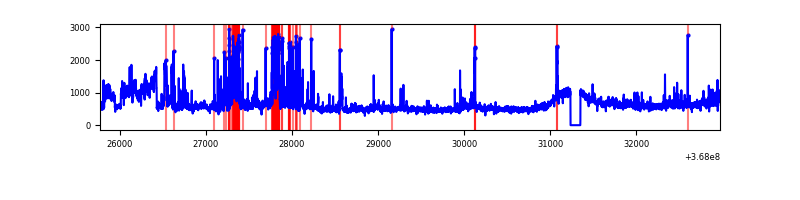 |
Top three noisy pixels from each quadrant. If the there are fewer than three noisy pixels in the level2.evt file, extra rows are filled as -1
| Pixel properties | Quadrant properties | ||||||
|---|---|---|---|---|---|---|---|
| Quadrant | DetID | PixID | Counts | Sigma | Mean | Median | Sigma |
| A | 13 | 254 | 13439 | 66.37 | 927 | 907 | 188.8 |
| A | 13 | 6 | 12835 | 63.17 | 927 | 907 | 188.8 |
| A | 3 | 137 | 9472 | 45.36 | 927 | 907 | 188.8 |
| B | 6 | 159 | 1794307 | 10493.86 | 889 | 867 | 170.9 |
| B | 12 | 18 | 881255 | 5151.37 | 889 | 867 | 170.9 |
| B | 0 | 229 | 38710 | 221.43 | 889 | 867 | 170.9 |
| C | 0 | 10 | 291051 | 1400.86 | 873 | 880 | 207.1 |
| C | 3 | 233 | 167101 | 802.46 | 873 | 880 | 207.1 |
| C | 14 | 238 | 139603 | 669.71 | 873 | 880 | 207.1 |
| D | 8 | 195 | 968947 | 4550.42 | 892 | 869 | 212.7 |
| D | 13 | 249 | 377006 | 1768.02 | 892 | 869 | 212.7 |
| D | 2 | 250 | 110269 | 514.23 | 892 | 869 | 212.7 |
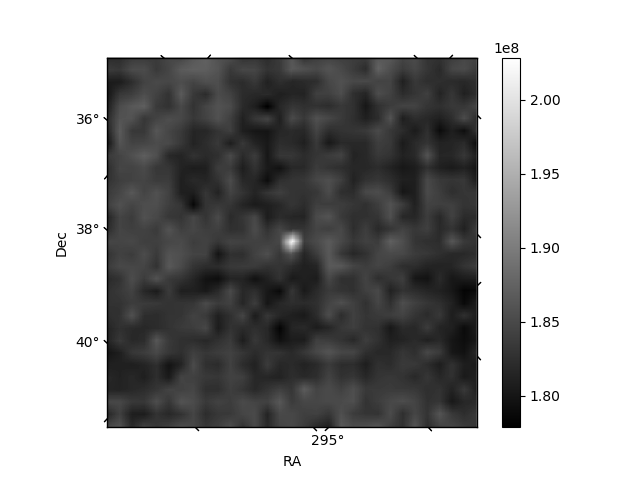
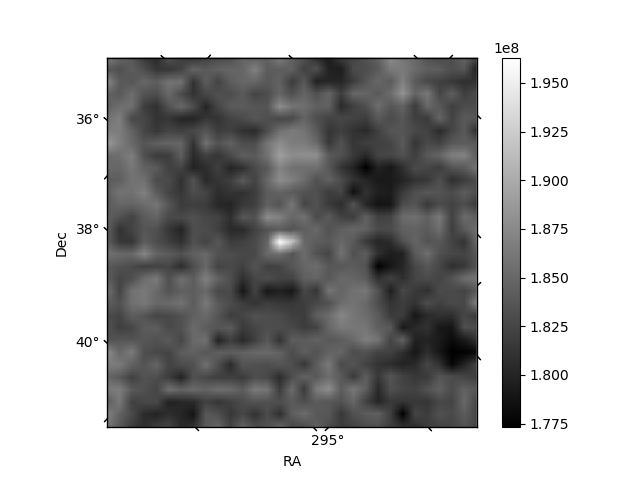
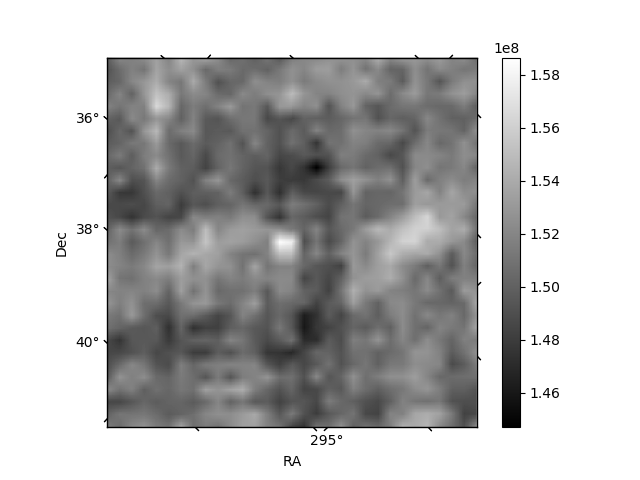
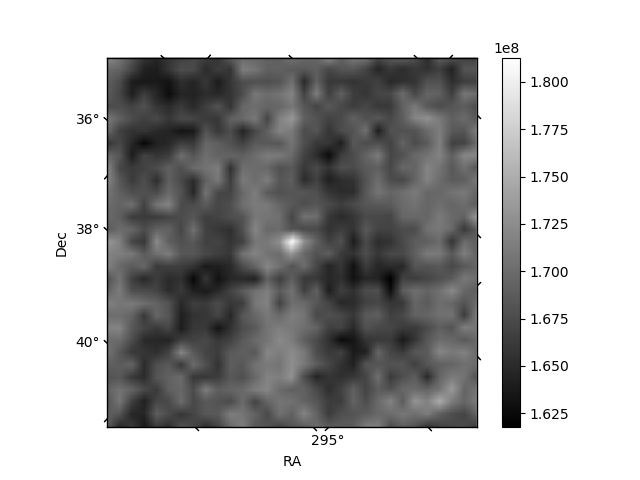
Histogram calculated using DETX and DETY for each event in the final _common_clean file
| Quadrant A |  |
 |
Quadrant B |
|---|---|---|---|
| Quadrant D | 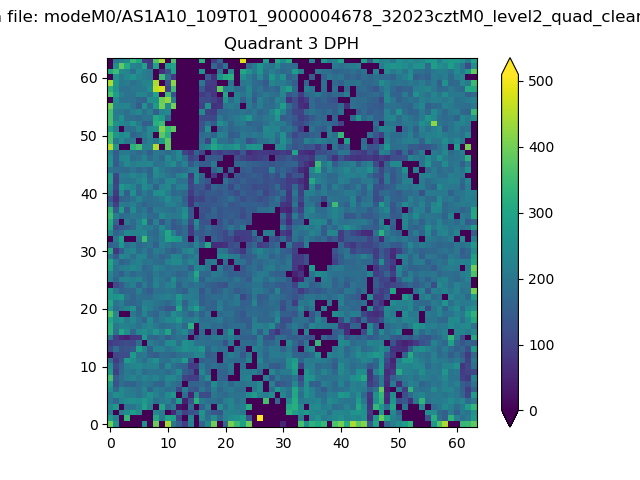 |
 |
Quadrant C |
| Plot type | Count rate plots | Images |
|---|---|---|
| Comparison with Poisson distribution Blue bars denote a histogram of data divided into 1 sec bins. Red curve is a Poisson curve with rate = median count rate of data. |
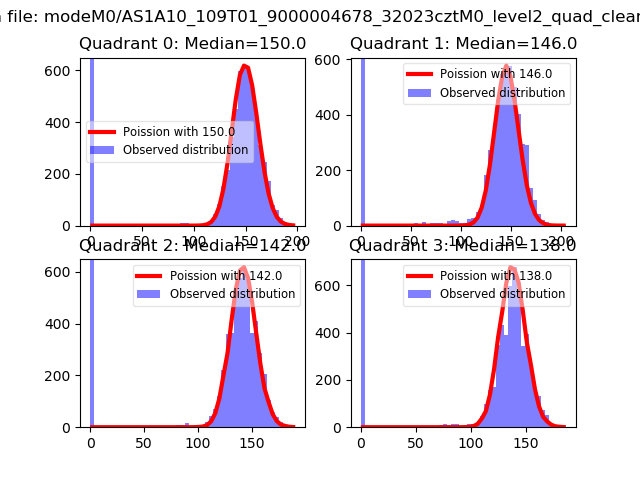 |
 |
| Quadrant-wise count rates Data is divided into 100 sec bins |
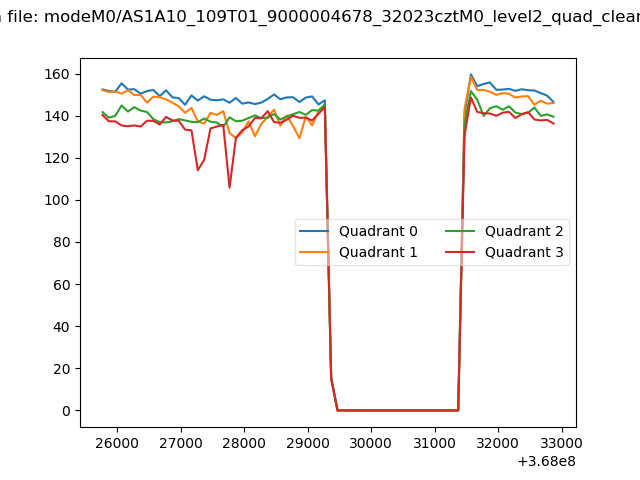 |
|
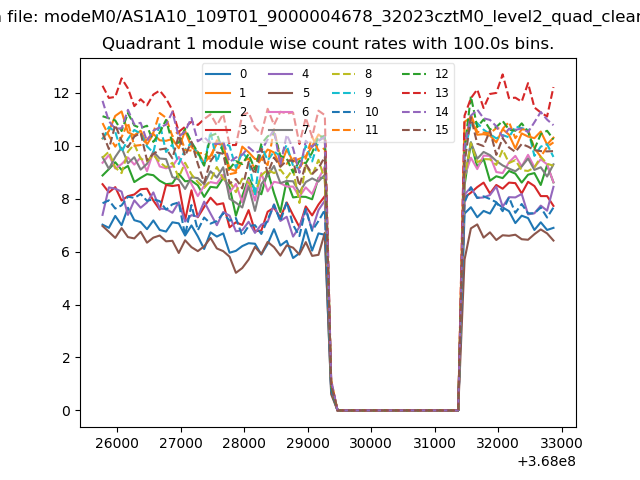
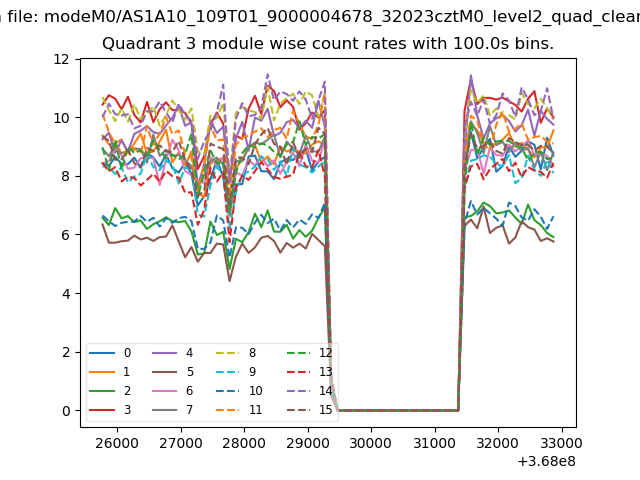
| Module-wise count rates for Quadrant A Data is divided into 100 sec bins |
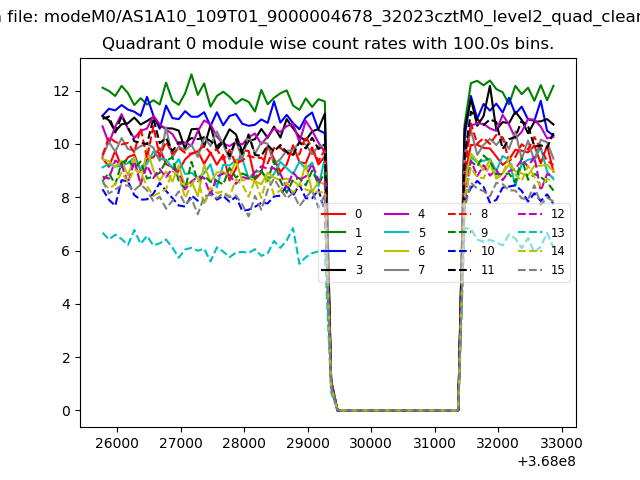 |
 |
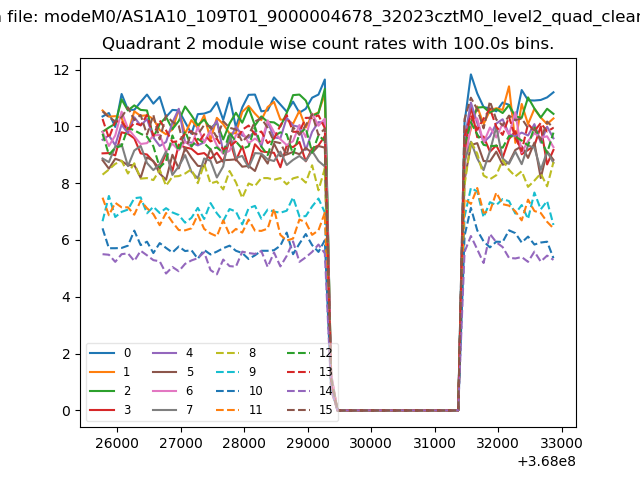
| Module-wise count rates for Quadrant B Data is divided into 100 sec bins |
 |
 |
| Module-wise count rates for Quadrant C Data is divided into 100 sec bins |
 |
 |
| Module-wise count rates for Quadrant D Data is divided into 100 sec bins |
 |
 |
| Parameter | Plot |
|---|---|
| CZT HV Monitor | 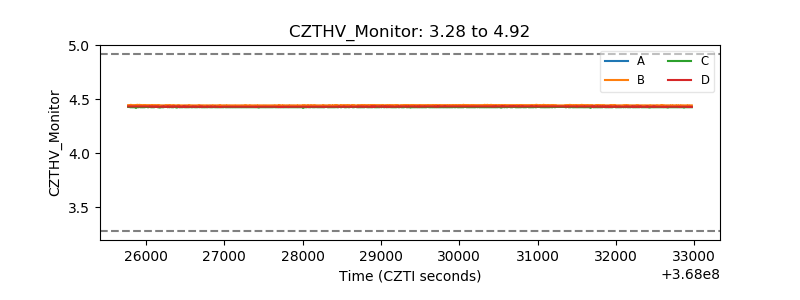 |
| D_VDD | 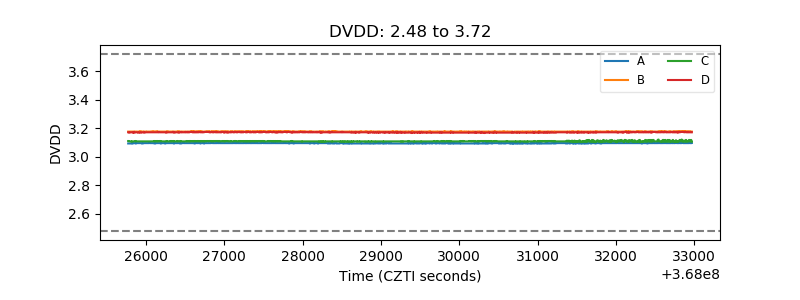 |
| Temperature 1 | 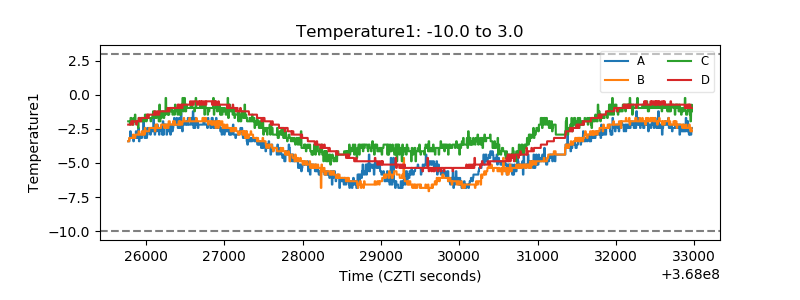 |
| Veto HV Monitor | 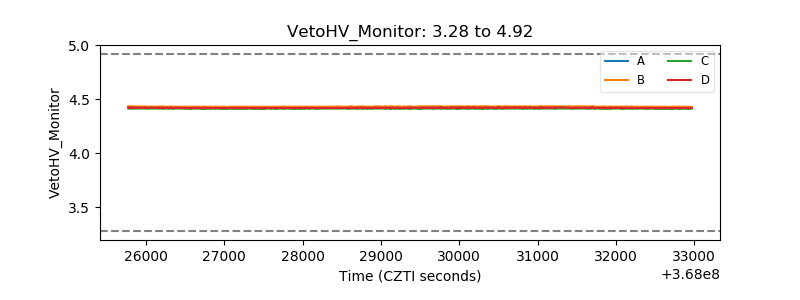 |
| Veto LLD |  |
| Alpha Counter | 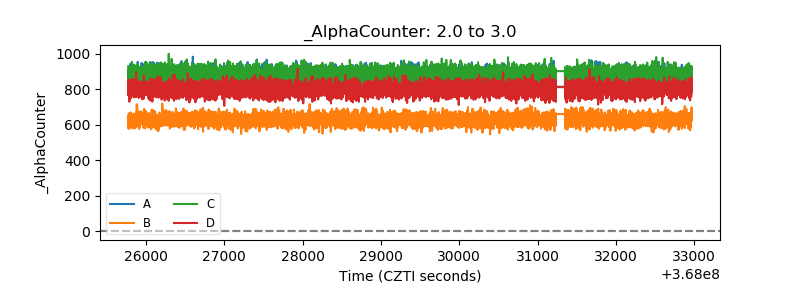 |
| _CPM_Rate | 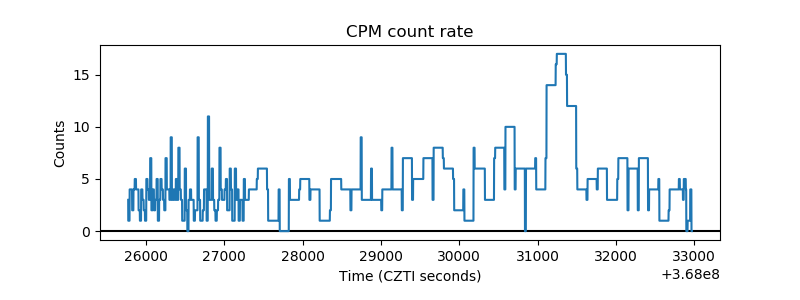 |
| CZT Counter | 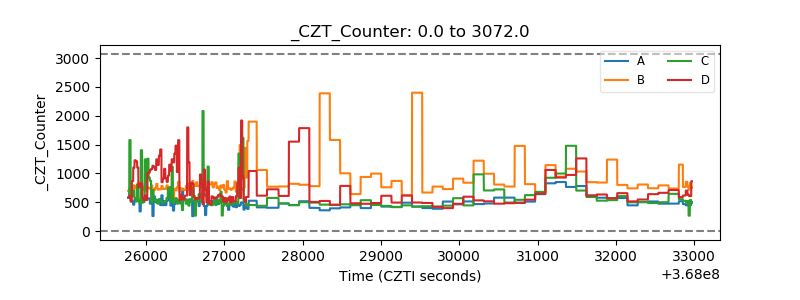 |
| +2.5 Volts monitor |  |
| +5 Volts monitor | 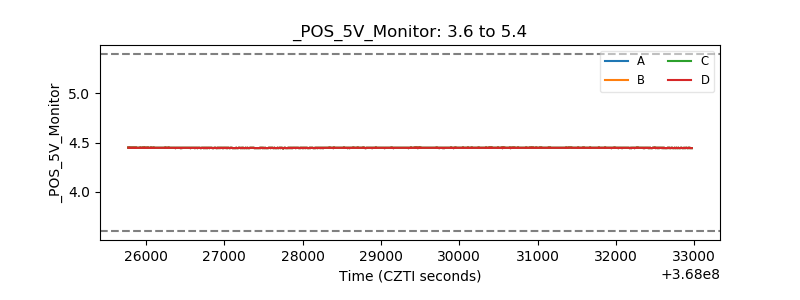 |
| _ROLL_ROT | 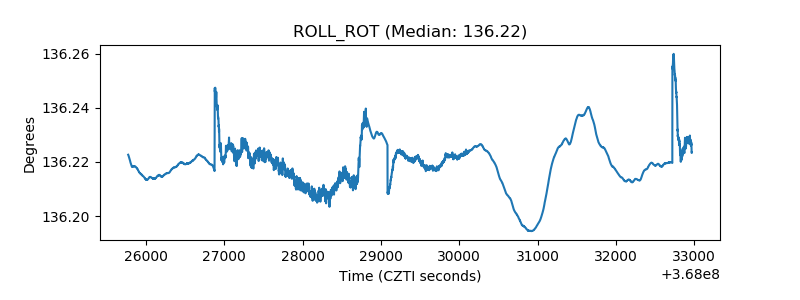 |
| _Roll_DEC | 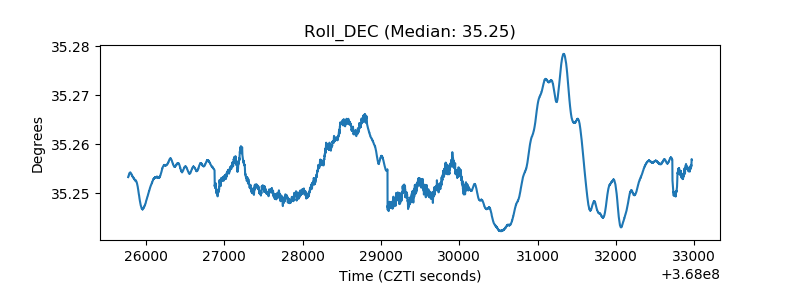 |
| _Roll_RA |  |
| Veto Counter | 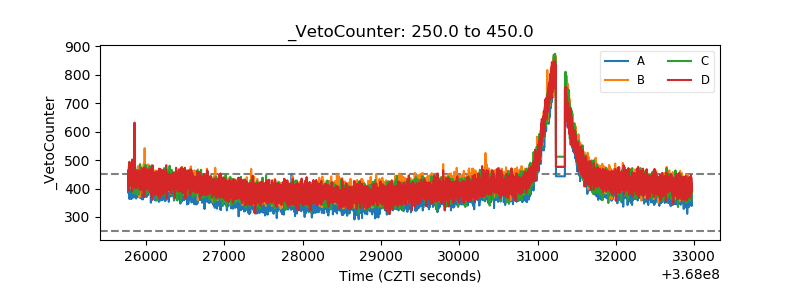 |