| Param | Original file | Final file |
|---|---|---|
| Filename | modeM0/AS1A10_109T01_9000004678_32025cztM0_level2.evt | modeM0/AS1A10_109T01_9000004678_32025cztM0_level2_quad_clean.evt |
| Size (bytes) | 686,496,960 | 118,506,240 |
| Size | 654.7 MB | 113.0 MB |
| Events in quadrant A | 3,741,040 | 809,123 |
| Events in quadrant B | 6,969,399 | 766,001 |
| Events in quadrant C | 4,229,353 | 761,444 |
| Events in quadrant D | 5,342,278 | 728,932 |
| Mode M9 | |||
|---|---|---|---|
| Quadrant | BADHDUFLAG | Total packets | Discarded packets |
| A | 0 | 5 | 0 |
| B | 0 | 5 | 0 |
| C | 0 | 5 | 0 |
| D | 0 | 5 | 0 |
| Mode SS | |||
|---|---|---|---|
| Quadrant | BADHDUFLAG | Total packets | Discarded packets |
| A | 0 | 150 | 0 |
| B | 0 | 150 | 0 |
| C | 0 | 150 | 0 |
| D | 0 | 150 | 0 |
| Mode M0 | |||
|---|---|---|---|
| Quadrant | BADHDUFLAG | Total packets | Discarded packets |
| A | 0 | 15843 | 2 |
| B | 0 | 26117 | 2 |
| C | 0 | 17223 | 2 |
| D | 0 | 21047 | 2 |
| Quadrant | Total seconds | Saturated seconds | Saturation percentage |
|---|---|---|---|
| A | 7527 | 108 | 1.434835% |
| B | 7528 | 632 | 8.395324% |
| C | 7528 | 215 | 2.856004% |
| D | 7527 | 479 | 6.363757% |
Noise dominated data is calculated using 1-second bins in cleaned event files. If a bin has >2000 counts, and if more than 50% of those come from <1% of pixels, then it is considered to be noise-dominated and hence unusable.
| Quadrant | # 1 sec bins | Bins with >0 counts | Bins with >2000 counts | High rate bins dominated by noise | Noise dominated (total time) | Noise dominated (detector-on time) | Marked lightcurve |
|---|---|---|---|---|---|---|---|
| A | 7952 | 7527 | 0 | 0 | 0.00% | 0.00% | 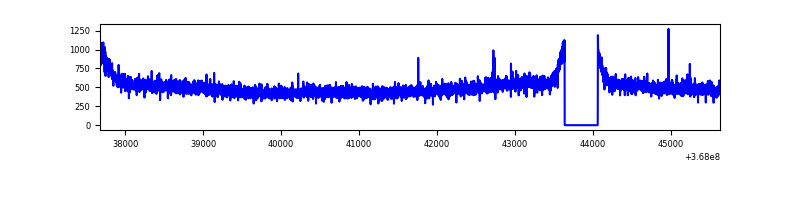 |
| B | 7953 | 7528 | 278 | 278 | 3.50% | 3.69% | 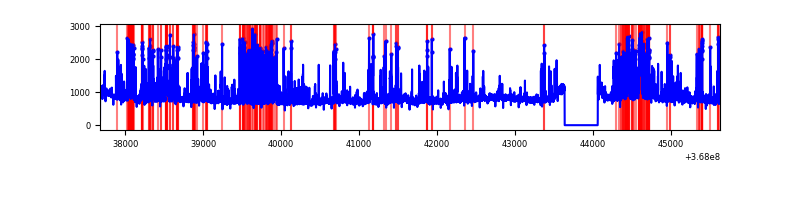 |
| C | 7953 | 7528 | 13 | 13 | 0.16% | 0.17% | 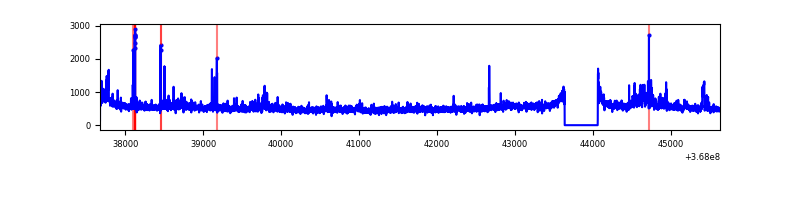 |
| D | 7952 | 7528 | 391 | 391 | 4.92% | 5.19% | 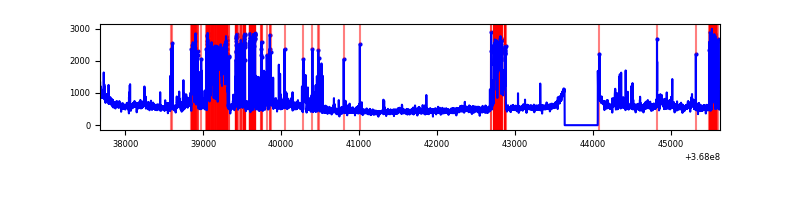 |
Top three noisy pixels from each quadrant. If the there are fewer than three noisy pixels in the level2.evt file, extra rows are filled as -1
| Pixel properties | Quadrant properties | ||||||
|---|---|---|---|---|---|---|---|
| Quadrant | DetID | PixID | Counts | Sigma | Mean | Median | Sigma |
| A | 13 | 6 | 18060 | 87.6 | 963 | 944 | 195.4 |
| A | 13 | 254 | 14069 | 67.17 | 963 | 944 | 195.4 |
| A | 3 | 137 | 9510 | 43.84 | 963 | 944 | 195.4 |
| B | 6 | 159 | 1966181 | 11108.35 | 921 | 899 | 176.9 |
| B | 12 | 18 | 948740 | 5357.48 | 921 | 899 | 176.9 |
| B | 0 | 190 | 313726 | 1768.19 | 921 | 899 | 176.9 |
| C | 3 | 233 | 336685 | 1548.73 | 915 | 922 | 216.8 |
| C | 14 | 238 | 148869 | 682.42 | 915 | 922 | 216.8 |
| C | 0 | 10 | 121566 | 556.48 | 915 | 922 | 216.8 |
| D | 8 | 195 | 511019 | 2332.61 | 911 | 890 | 218.7 |
| D | 13 | 249 | 460427 | 2101.27 | 911 | 890 | 218.7 |
| D | 2 | 250 | 278821 | 1270.86 | 911 | 890 | 218.7 |
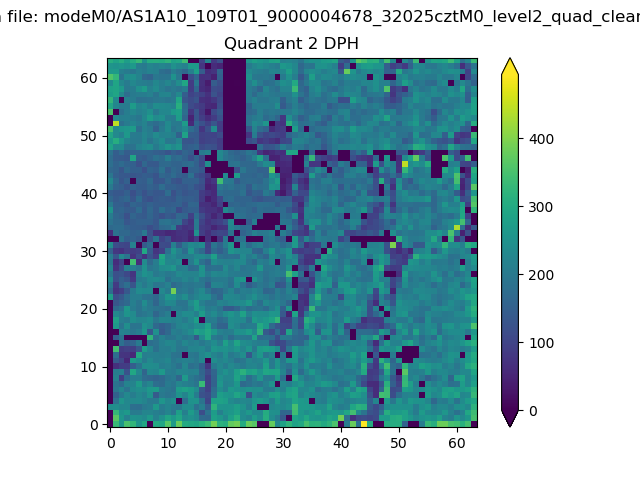
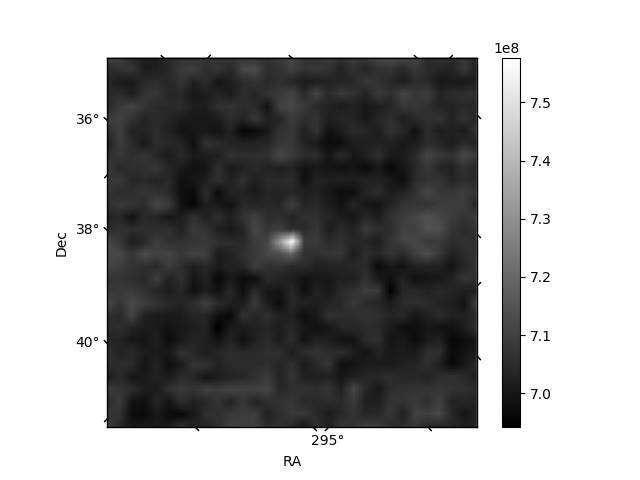
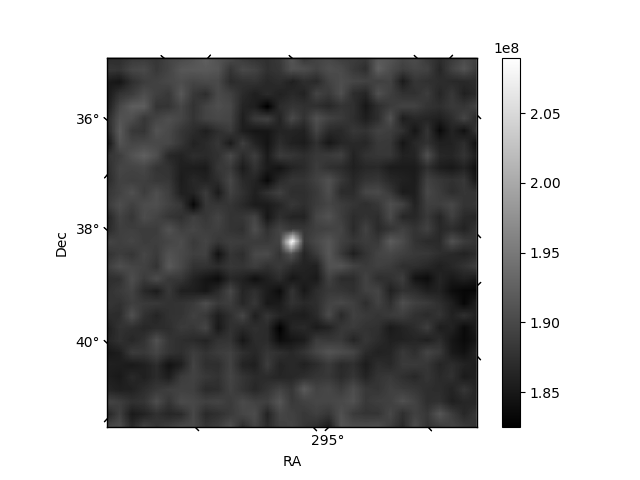
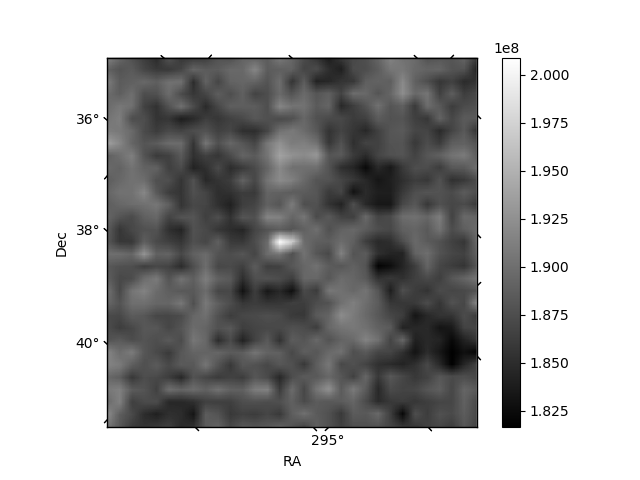
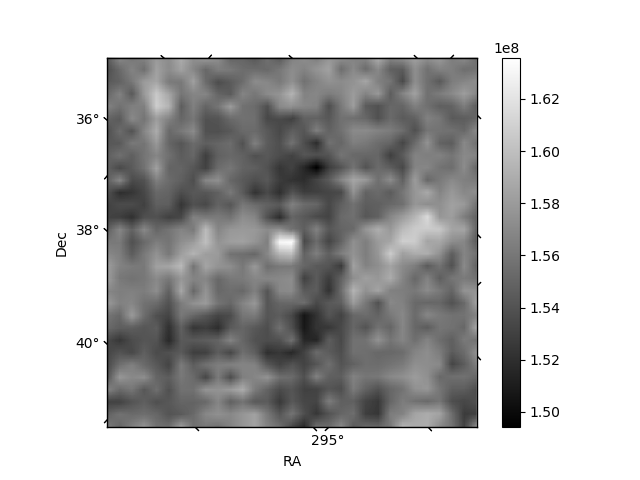
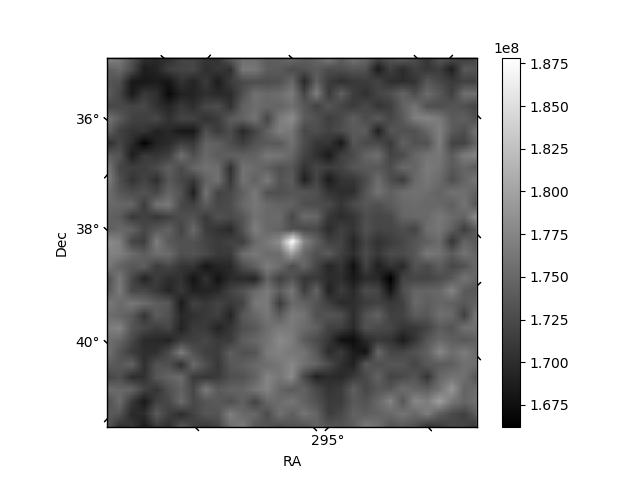
Histogram calculated using DETX and DETY for each event in the final _common_clean file
| Quadrant A | 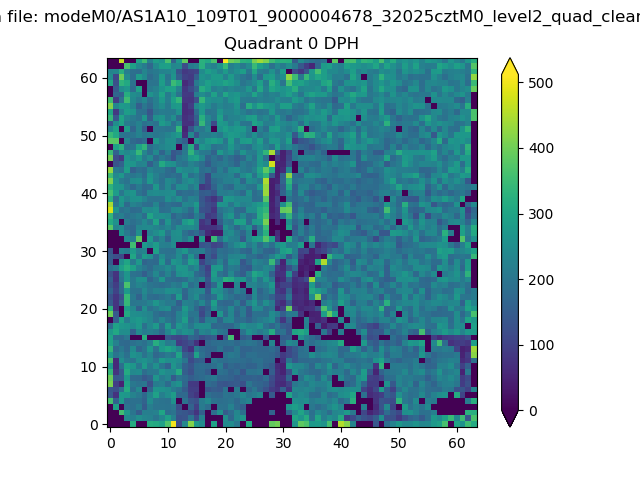 |
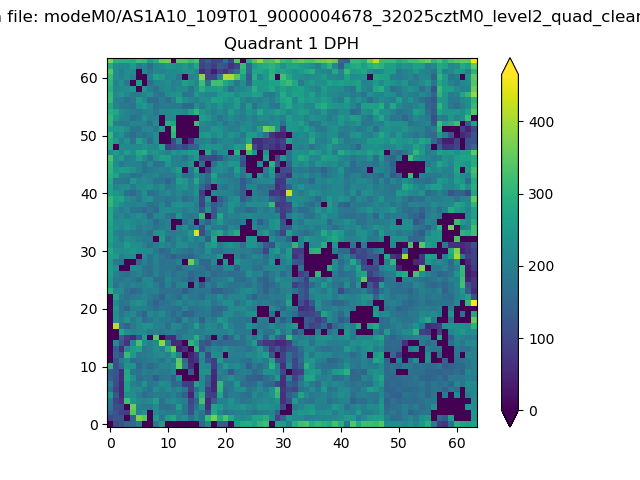 |
Quadrant B |
|---|---|---|---|
| Quadrant D | 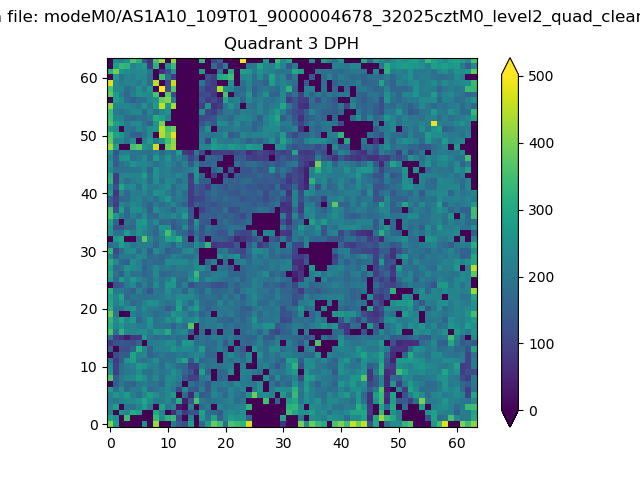 |
 |
Quadrant C |
| Plot type | Count rate plots | Images |
|---|---|---|
| Comparison with Poisson distribution Blue bars denote a histogram of data divided into 1 sec bins. Red curve is a Poisson curve with rate = median count rate of data. |
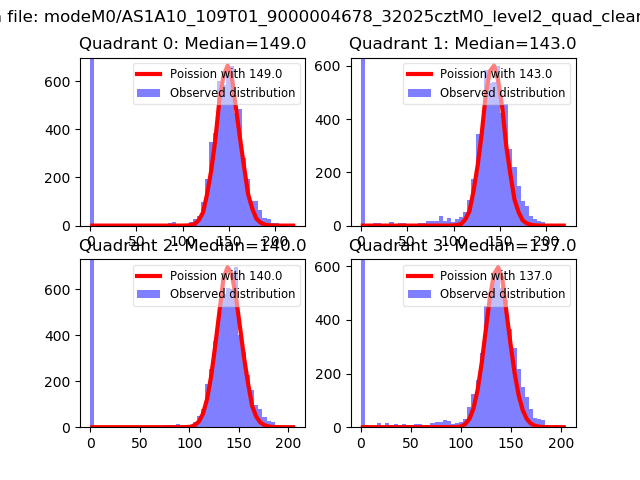 |
 |
| Quadrant-wise count rates Data is divided into 100 sec bins |
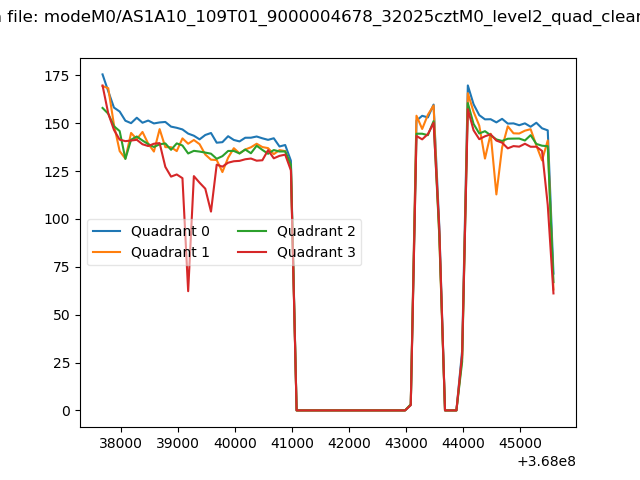 |
|
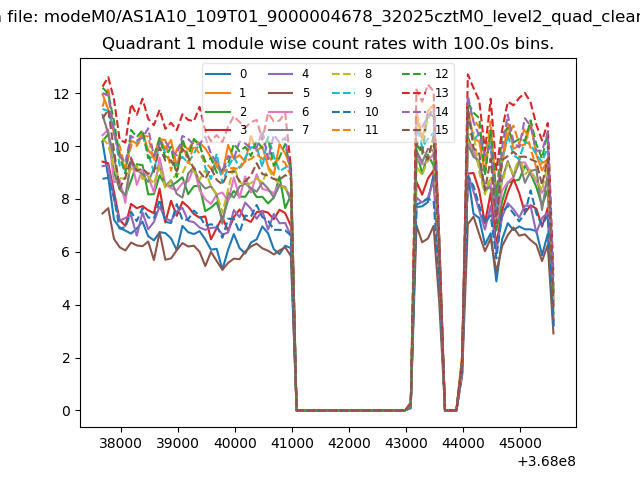
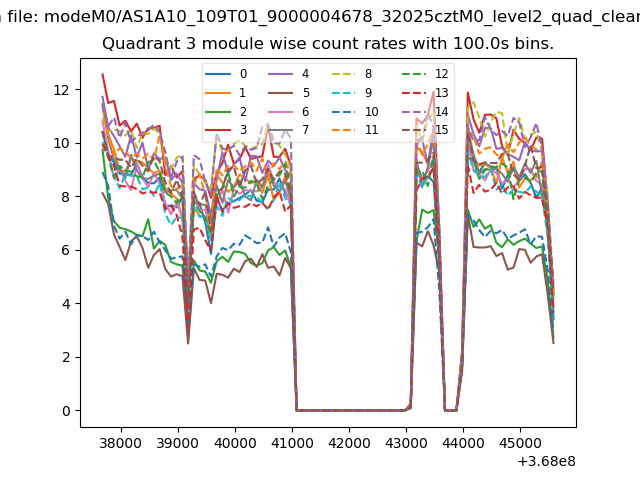
| Module-wise count rates for Quadrant A Data is divided into 100 sec bins |
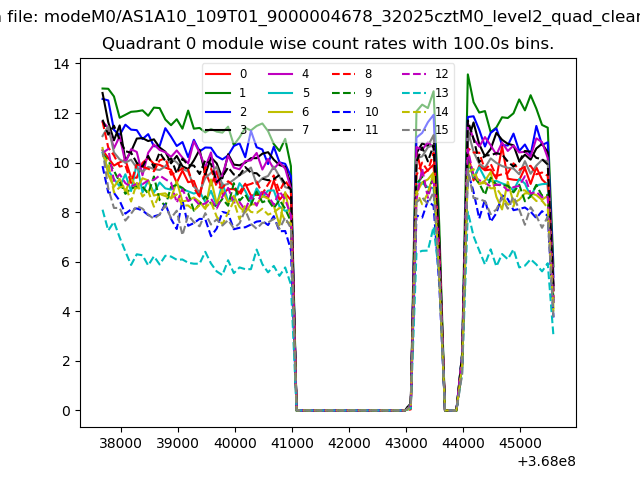 |
 |
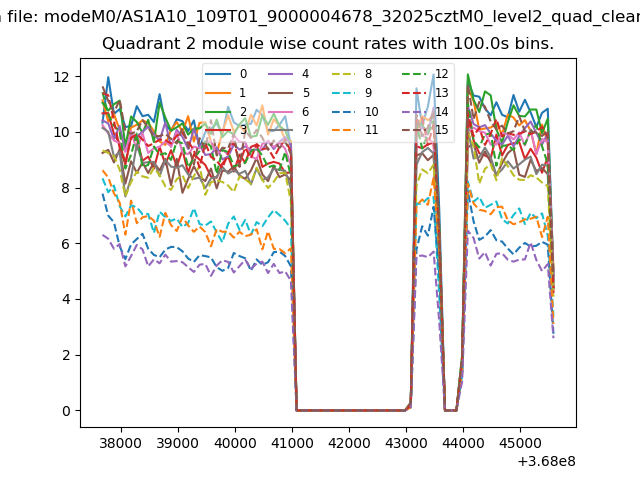
| Module-wise count rates for Quadrant B Data is divided into 100 sec bins |
 |
 |
| Module-wise count rates for Quadrant C Data is divided into 100 sec bins |
 |
 |
| Module-wise count rates for Quadrant D Data is divided into 100 sec bins |
 |
 |
| Parameter | Plot |
|---|---|
| CZT HV Monitor | 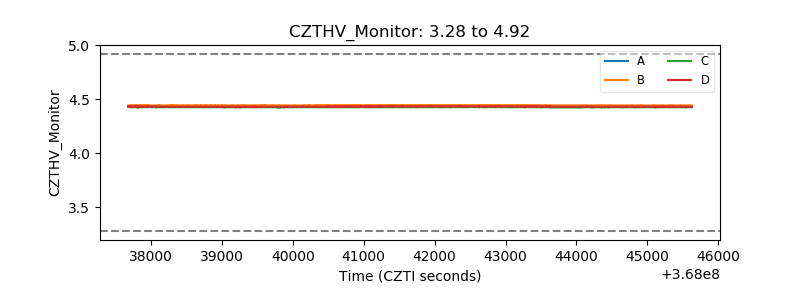 |
| D_VDD | 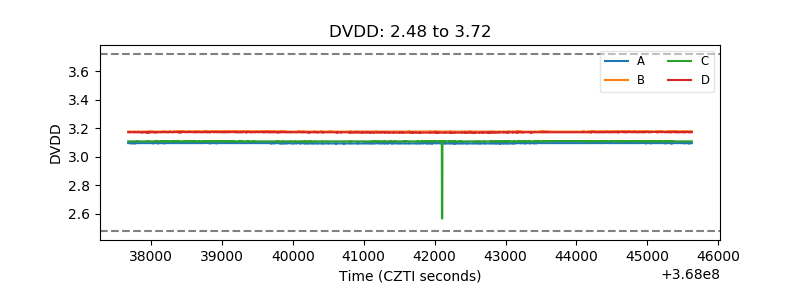 |
| Temperature 1 | 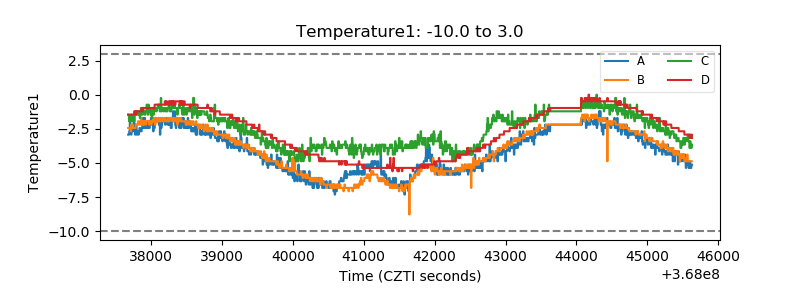 |
| Veto HV Monitor | 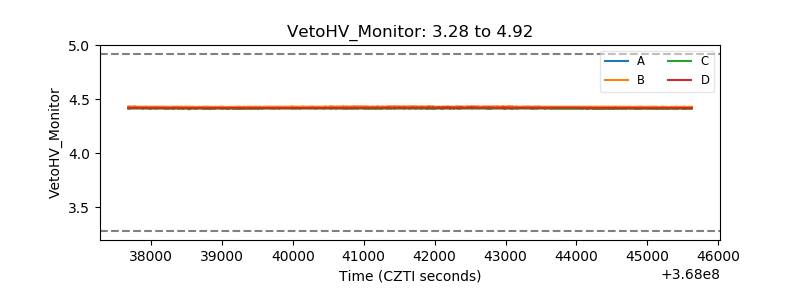 |
| Veto LLD |  |
| Alpha Counter | 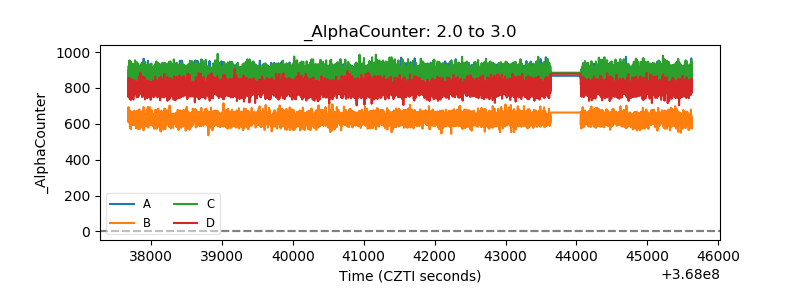 |
| _CPM_Rate | 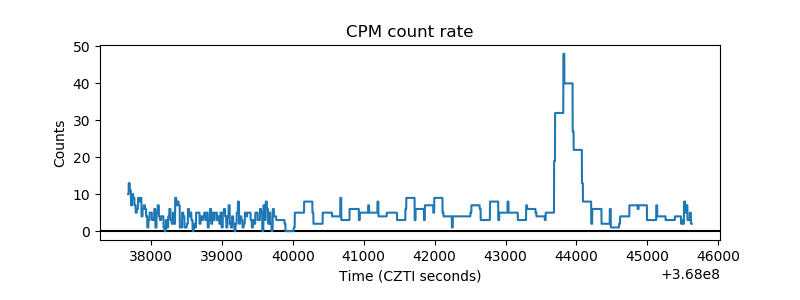 |
| CZT Counter | 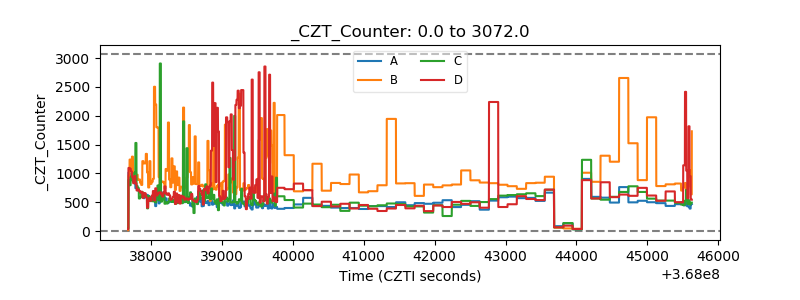 |
| +2.5 Volts monitor | 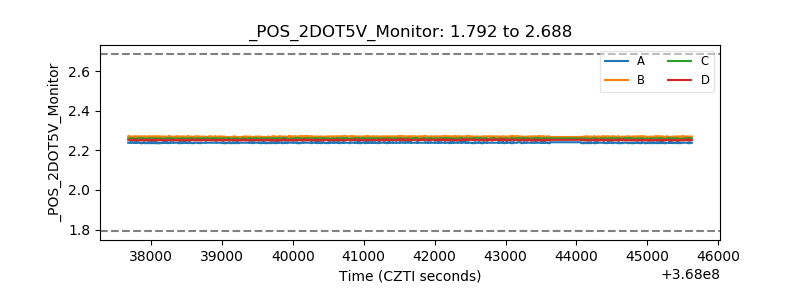 |
| +5 Volts monitor | 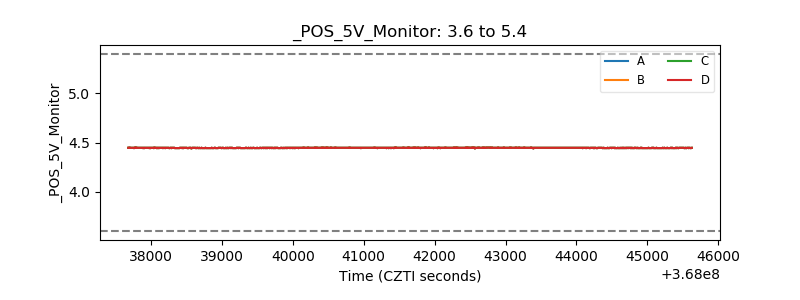 |
| _ROLL_ROT | 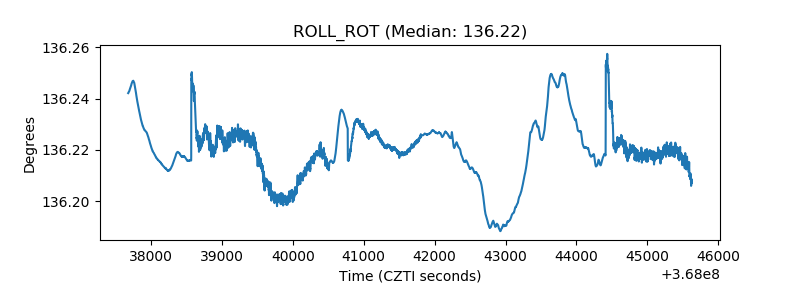 |
| _Roll_DEC | 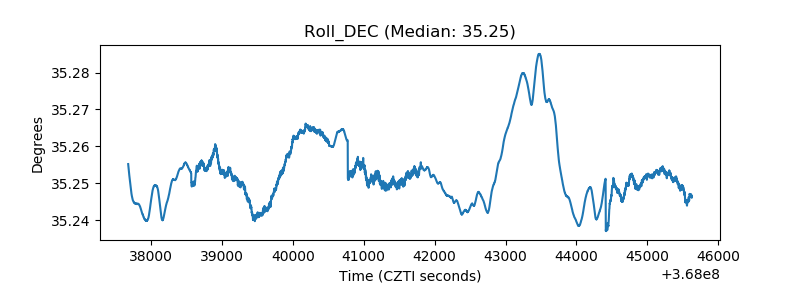 |
| _Roll_RA | 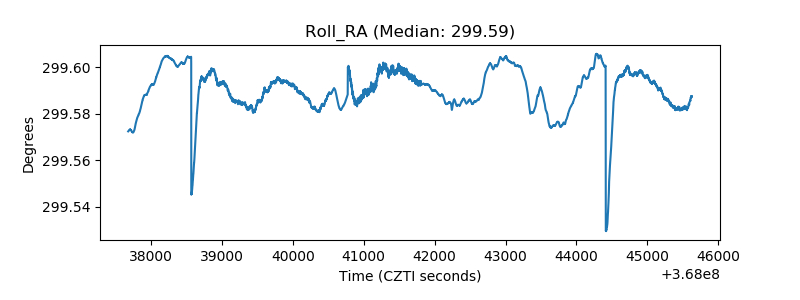 |
| Veto Counter | 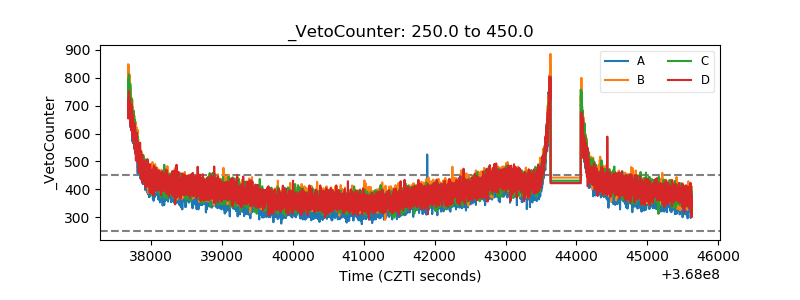 |