| Param | Original file | Final file |
|---|---|---|
| Filename | modeM0/AS1A10_109T01_9000004678_32027cztM0_level2.evt | modeM0/AS1A10_109T01_9000004678_32027cztM0_level2_quad_clean.evt |
| Size (bytes) | 1,070,706,240 | 183,041,280 |
| Size | 1021.1 MB | 174.6 MB |
| Events in quadrant A | 5,934,496 | 1,224,708 |
| Events in quadrant B | 10,858,289 | 1,172,462 |
| Events in quadrant C | 6,891,620 | 1,158,338 |
| Events in quadrant D | 7,904,859 | 1,130,117 |
| Mode M9 | |||
|---|---|---|---|
| Quadrant | BADHDUFLAG | Total packets | Discarded packets |
| A | 0 | 14 | 0 |
| B | 0 | 14 | 0 |
| C | 0 | 14 | 0 |
| D | 0 | 14 | 0 |
| Mode SS | |||
|---|---|---|---|
| Quadrant | BADHDUFLAG | Total packets | Discarded packets |
| A | 0 | 252 | 0 |
| B | 0 | 252 | 0 |
| C | 0 | 252 | 0 |
| D | 0 | 252 | 0 |
| Mode M0 | |||
|---|---|---|---|
| Quadrant | BADHDUFLAG | Total packets | Discarded packets |
| A | 0 | 25727 | 2 |
| B | 0 | 41341 | 2 |
| C | 0 | 28488 | 2 |
| D | 0 | 31916 | 4 |
| Quadrant | Total seconds | Saturated seconds | Saturation percentage |
|---|---|---|---|
| A | 12413 | 57 | 0.459196% |
| B | 12414 | 682 | 5.493797% |
| C | 12414 | 270 | 2.174964% |
| D | 12413 | 194 | 1.562878% |
Noise dominated data is calculated using 1-second bins in cleaned event files. If a bin has >2000 counts, and if more than 50% of those come from <1% of pixels, then it is considered to be noise-dominated and hence unusable.
| Quadrant | # 1 sec bins | Bins with >0 counts | Bins with >2000 counts | High rate bins dominated by noise | Noise dominated (total time) | Noise dominated (detector-on time) | Marked lightcurve |
|---|---|---|---|---|---|---|---|
| A | 13813 | 12413 | 0 | 0 | 0.00% | 0.00% | 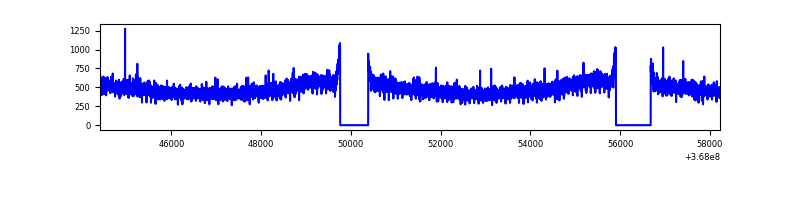 |
| B | 13814 | 12414 | 335 | 335 | 2.43% | 2.70% | 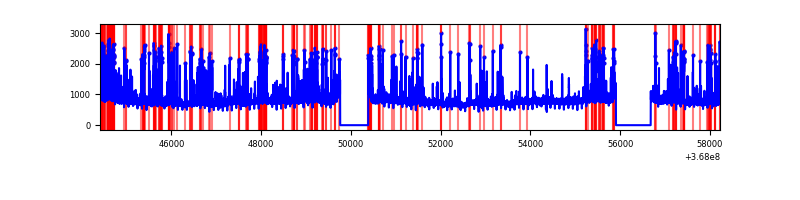 |
| C | 13814 | 12415 | 80 | 80 | 0.58% | 0.64% | 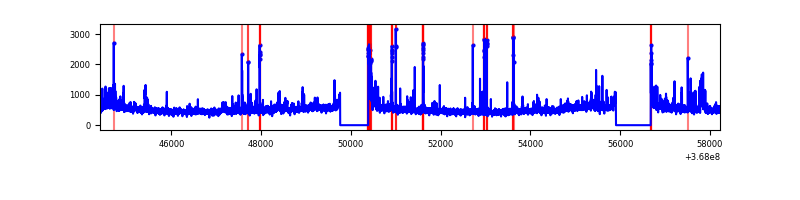 |
| D | 13813 | 12414 | 130 | 130 | 0.94% | 1.05% | 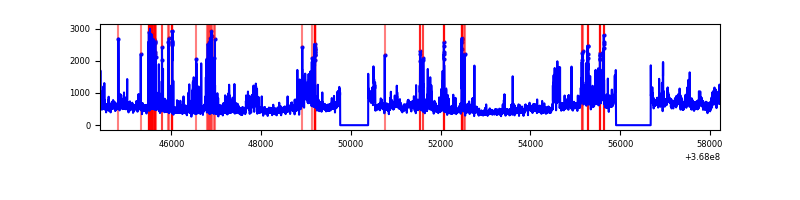 |
Top three noisy pixels from each quadrant. If the there are fewer than three noisy pixels in the level2.evt file, extra rows are filled as -1
| Pixel properties | Quadrant properties | ||||||
|---|---|---|---|---|---|---|---|
| Quadrant | DetID | PixID | Counts | Sigma | Mean | Median | Sigma |
| A | 13 | 6 | 26633 | 81.32 | 1529 | 1501 | 309.0 |
| A | 13 | 254 | 24041 | 72.94 | 1529 | 1501 | 309.0 |
| A | 3 | 137 | 15122 | 44.08 | 1529 | 1501 | 309.0 |
| B | 6 | 159 | 3333121 | 11826.91 | 1478 | 1442 | 281.7 |
| B | 12 | 18 | 1285538 | 4558.33 | 1478 | 1442 | 281.7 |
| B | 0 | 190 | 238884 | 842.88 | 1478 | 1442 | 281.7 |
| C | 0 | 10 | 467467 | 1362.04 | 1457 | 1472 | 342.1 |
| C | 3 | 233 | 426164 | 1241.32 | 1457 | 1472 | 342.1 |
| C | 14 | 238 | 238074 | 691.56 | 1457 | 1472 | 342.1 |
| D | 8 | 195 | 1246449 | 3512.06 | 1472 | 1435 | 354.5 |
| D | 12 | 218 | 381510 | 1072.15 | 1472 | 1435 | 354.5 |
| D | 2 | 250 | 352936 | 991.55 | 1472 | 1435 | 354.5 |
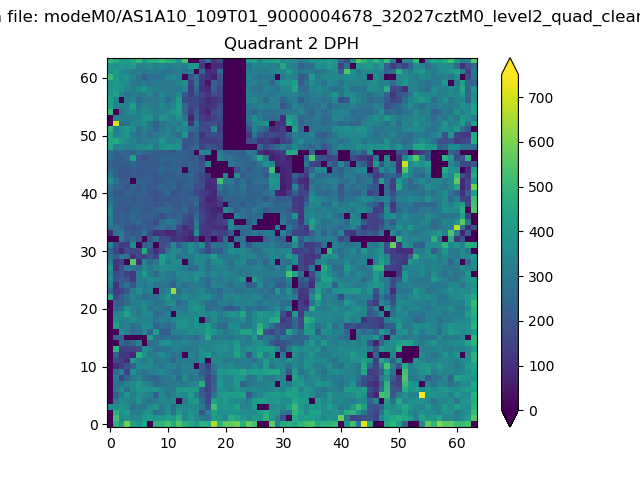
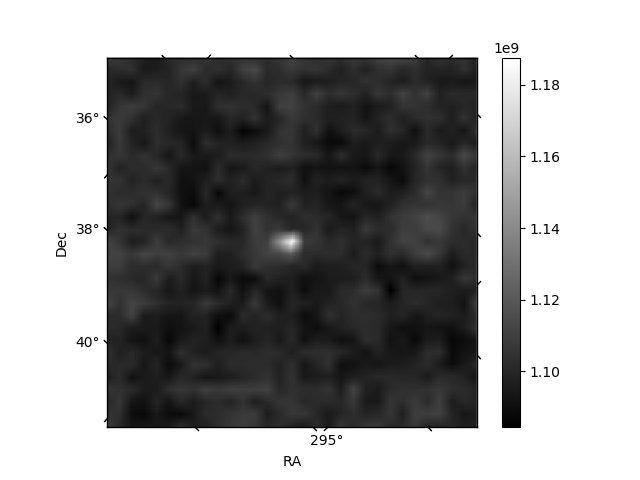
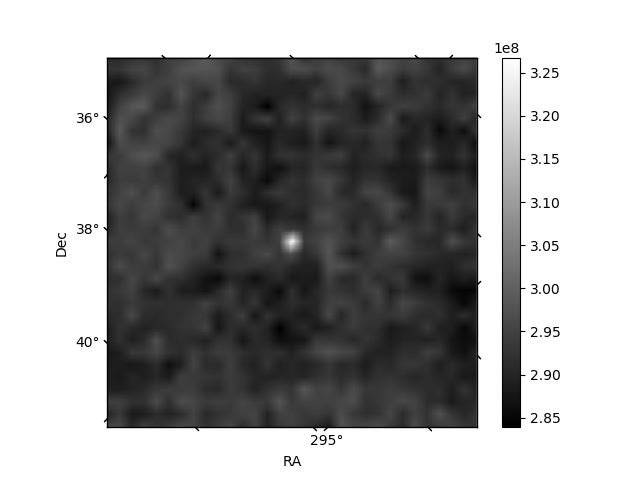
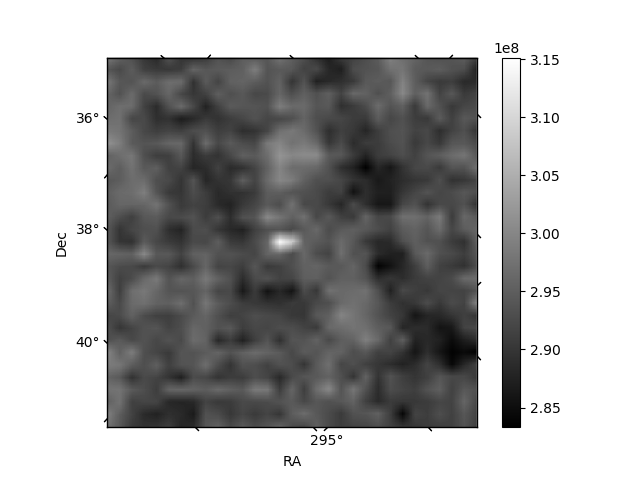
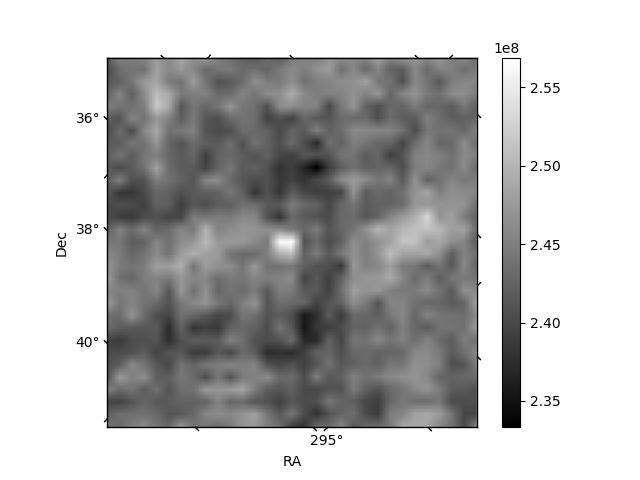
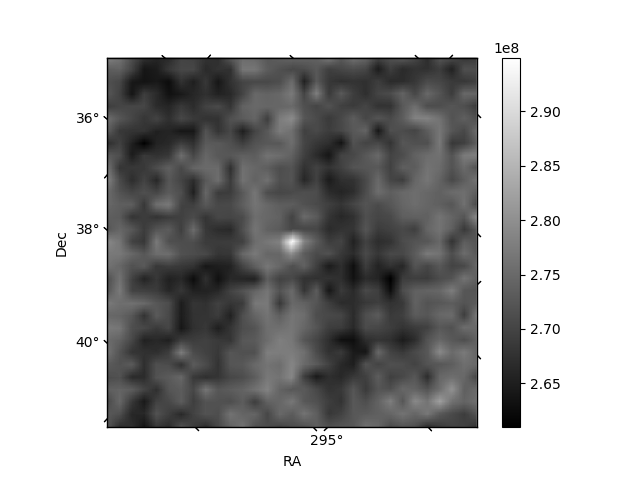
Histogram calculated using DETX and DETY for each event in the final _common_clean file
| Quadrant A | 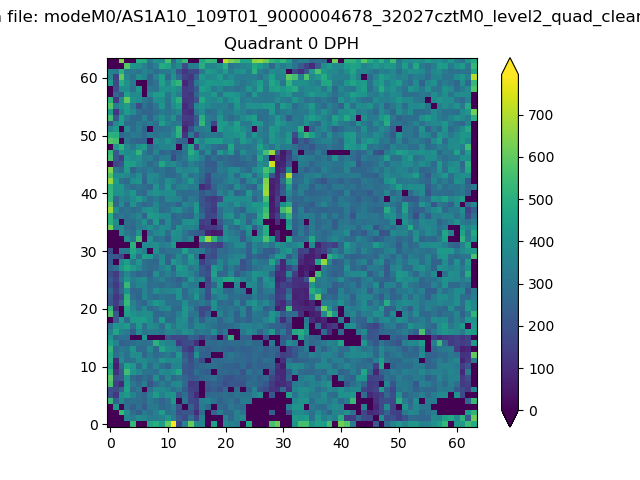 |
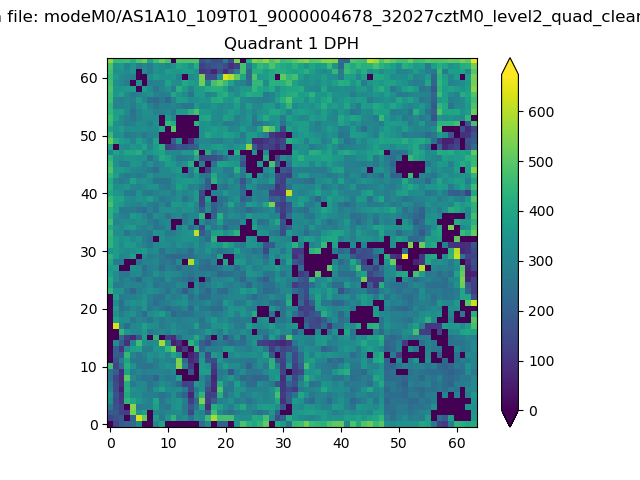 |
Quadrant B |
|---|---|---|---|
| Quadrant D | 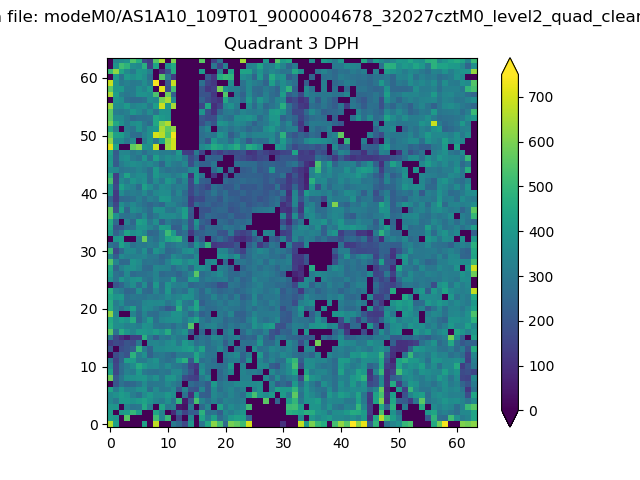 |
 |
Quadrant C |
| Plot type | Count rate plots | Images |
|---|---|---|
| Comparison with Poisson distribution Blue bars denote a histogram of data divided into 1 sec bins. Red curve is a Poisson curve with rate = median count rate of data. |
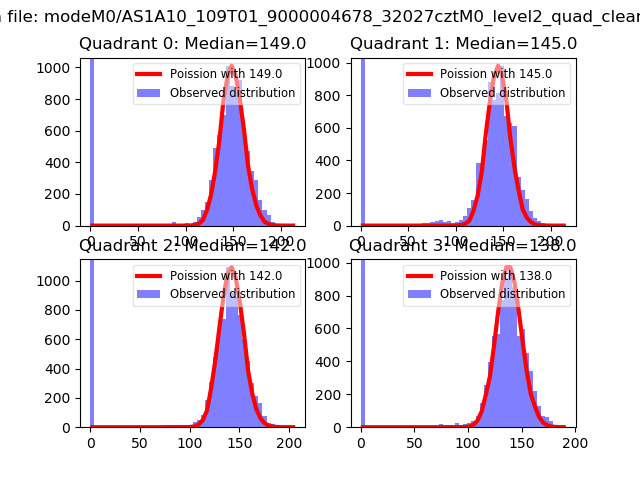 |
 |
| Quadrant-wise count rates Data is divided into 100 sec bins |
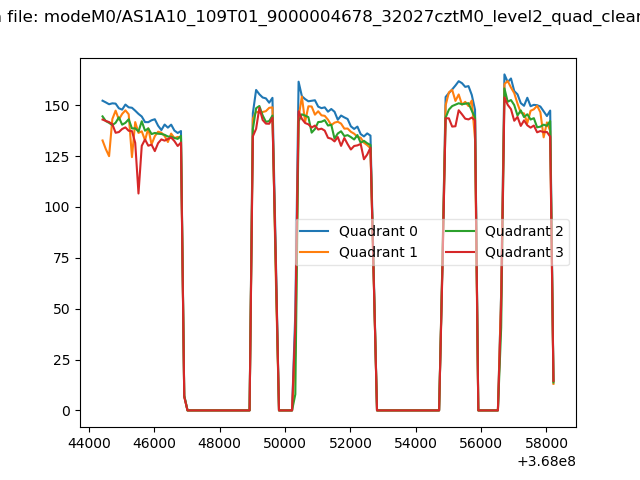 |
|
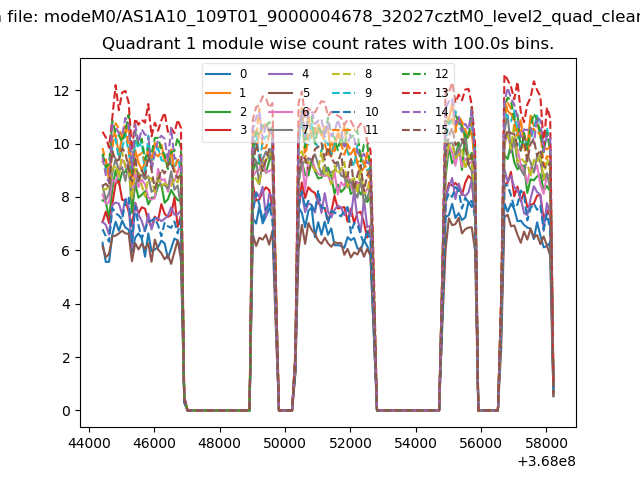
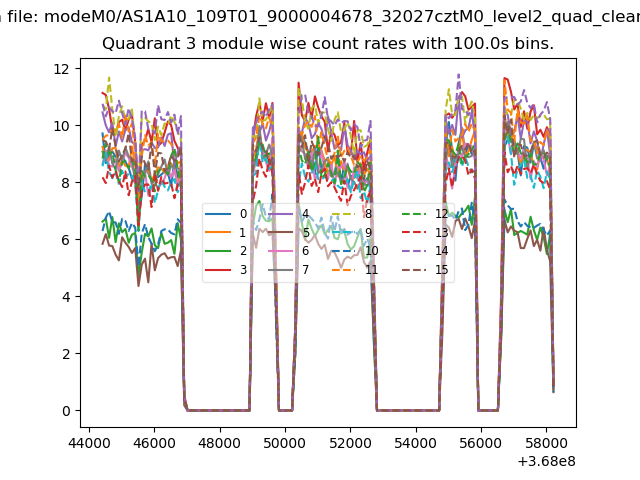
| Module-wise count rates for Quadrant A Data is divided into 100 sec bins |
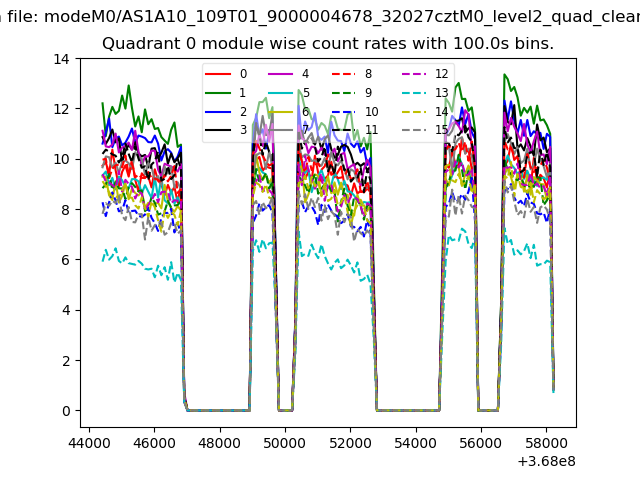 |
 |
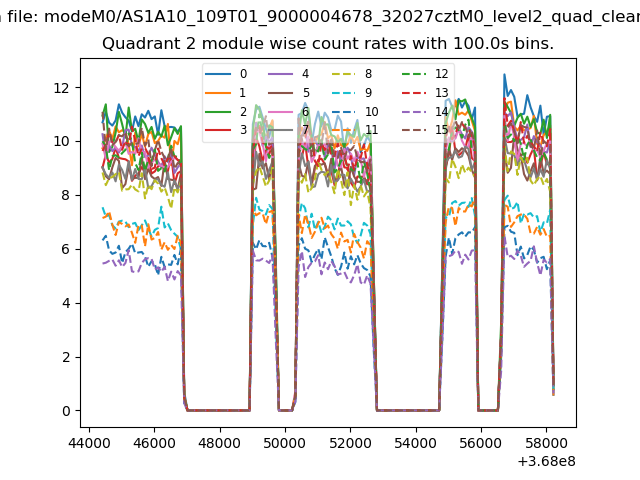
| Module-wise count rates for Quadrant B Data is divided into 100 sec bins |
 |
 |
| Module-wise count rates for Quadrant C Data is divided into 100 sec bins |
 |
 |
| Module-wise count rates for Quadrant D Data is divided into 100 sec bins |
 |
 |
| Parameter | Plot |
|---|---|
| CZT HV Monitor |  |
| D_VDD | 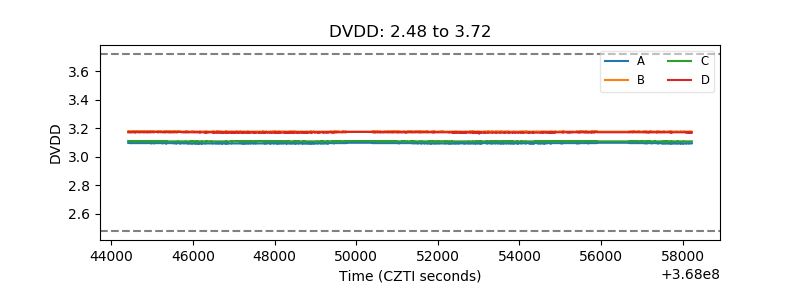 |
| Temperature 1 | 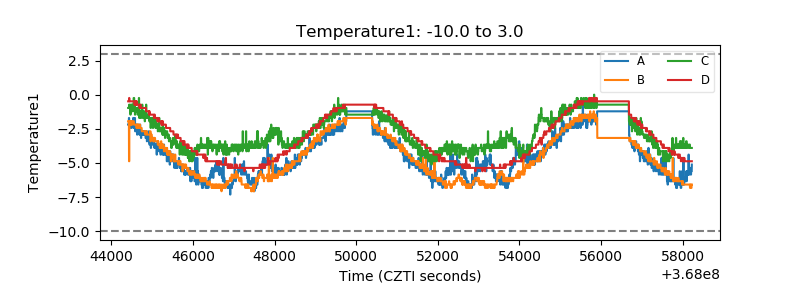 |
| Veto HV Monitor | 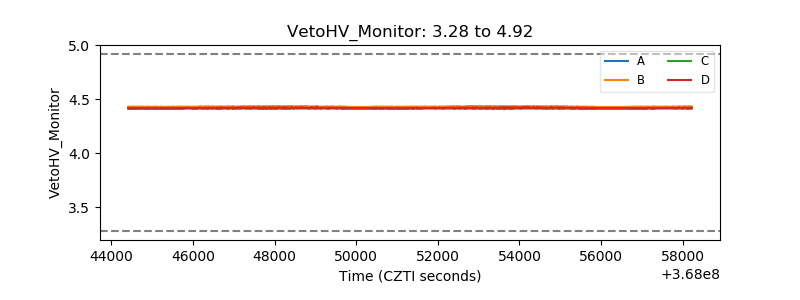 |
| Veto LLD | 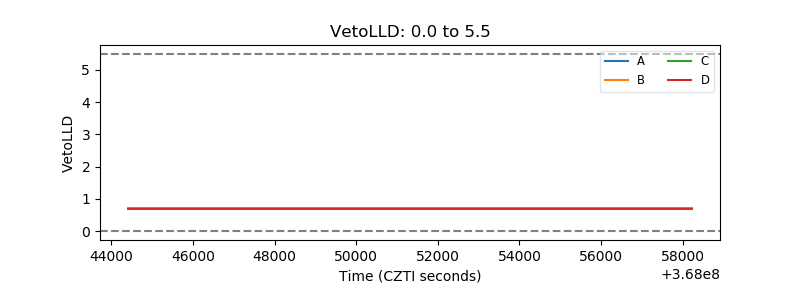 |
| Alpha Counter | 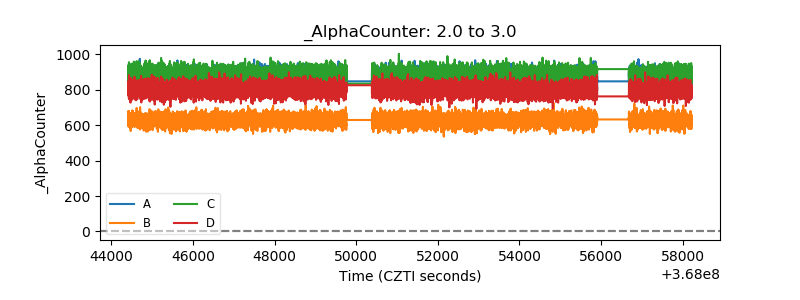 |
| _CPM_Rate | 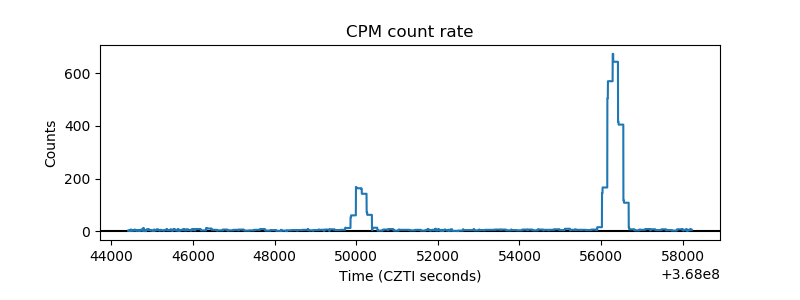 |
| CZT Counter | 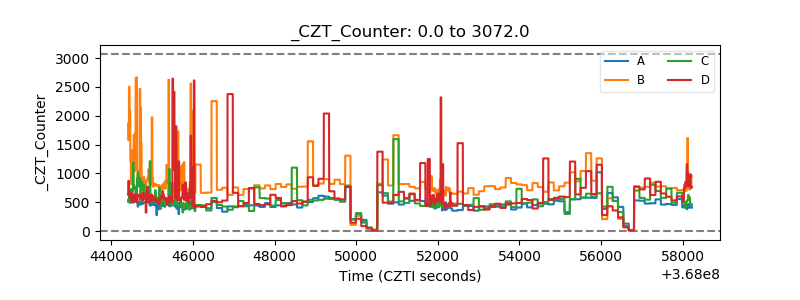 |
| +2.5 Volts monitor | 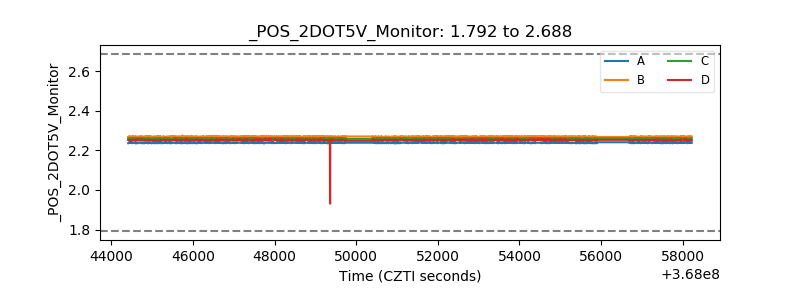 |
| +5 Volts monitor | 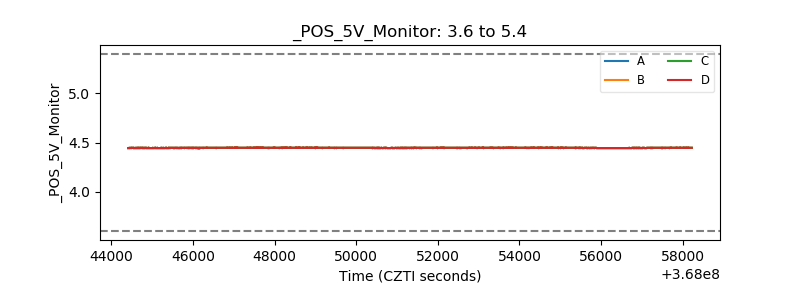 |
| _ROLL_ROT | 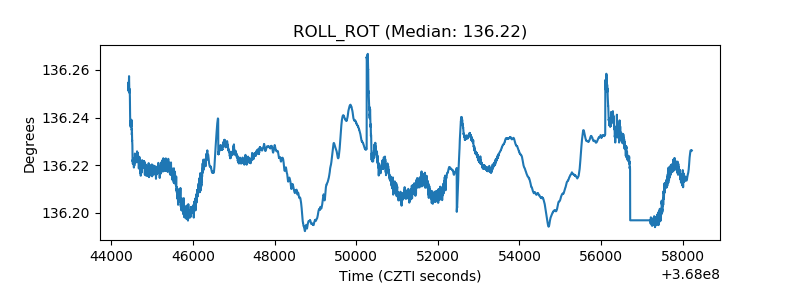 |
| _Roll_DEC | 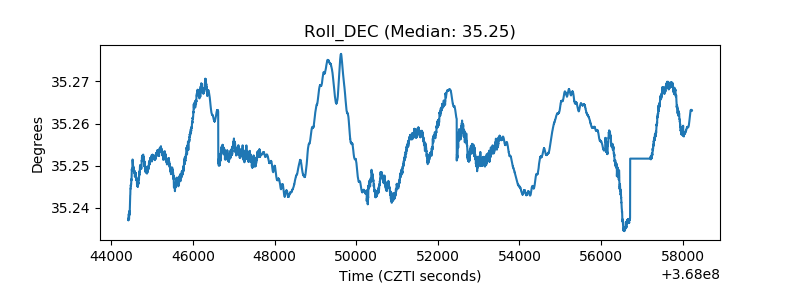 |
| _Roll_RA | 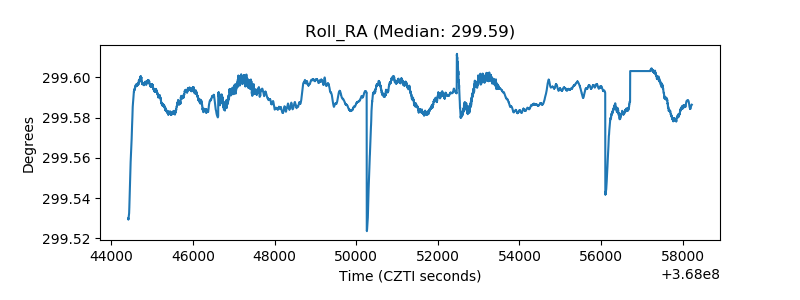 |
| Veto Counter | 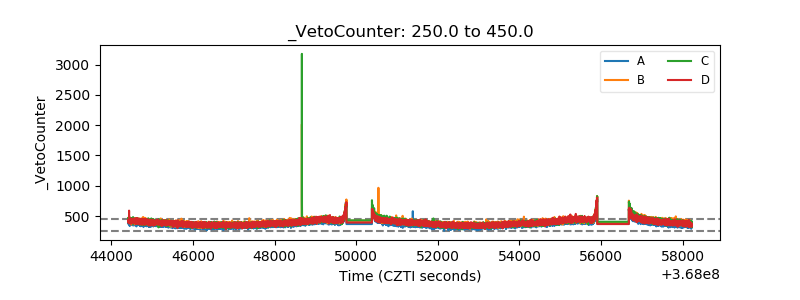 |