| Param | Original file | Final file |
|---|---|---|
| Filename | modeM0/AS1A10_109T01_9000004678_32056cztM0_level2.evt | modeM0/AS1A10_109T01_9000004678_32056cztM0_level2_quad_clean.evt |
| Size (bytes) | 1,019,574,720 | 129,790,080 |
| Size | 972.3 MB | 123.8 MB |
| Events in quadrant A | 5,673,337 | 808,578 |
| Events in quadrant B | 9,643,107 | 785,041 |
| Events in quadrant C | 6,266,482 | 765,950 |
| Events in quadrant D | 8,486,258 | 741,370 |
| Mode M9 | |||
|---|---|---|---|
| Quadrant | BADHDUFLAG | Total packets | Discarded packets |
| A | 0 | 14 | 0 |
| B | 0 | 14 | 0 |
| C | 0 | 14 | 0 |
| D | 0 | 14 | 0 |
| Mode SS | |||
|---|---|---|---|
| Quadrant | BADHDUFLAG | Total packets | Discarded packets |
| A | 0 | 242 | 0 |
| B | 0 | 242 | 0 |
| C | 0 | 242 | 0 |
| D | 0 | 242 | 0 |
| Mode M0 | |||
|---|---|---|---|
| Quadrant | BADHDUFLAG | Total packets | Discarded packets |
| A | 0 | 24806 | 2 |
| B | 0 | 37507 | 2 |
| C | 0 | 26359 | 2 |
| D | 0 | 33316 | 2 |
| Quadrant | Total seconds | Saturated seconds | Saturation percentage |
|---|---|---|---|
| A | 11993 | 52 | 0.433586% |
| B | 11993 | 277 | 2.309681% |
| C | 11992 | 226 | 1.884590% |
| D | 11993 | 218 | 1.817727% |
Noise dominated data is calculated using 1-second bins in cleaned event files. If a bin has >2000 counts, and if more than 50% of those come from <1% of pixels, then it is considered to be noise-dominated and hence unusable.
| Quadrant | # 1 sec bins | Bins with >0 counts | Bins with >2000 counts | High rate bins dominated by noise | Noise dominated (total time) | Noise dominated (detector-on time) | Marked lightcurve |
|---|---|---|---|---|---|---|---|
| A | 13424 | 11994 | 0 | 0 | 0.00% | 0.00% | 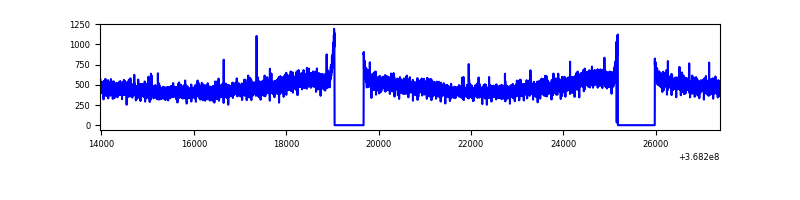 |
| B | 13424 | 11993 | 96 | 96 | 0.72% | 0.80% | 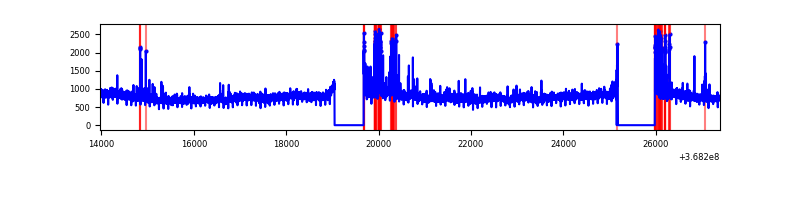 |
| C | 13423 | 11994 | 21 | 21 | 0.16% | 0.18% | 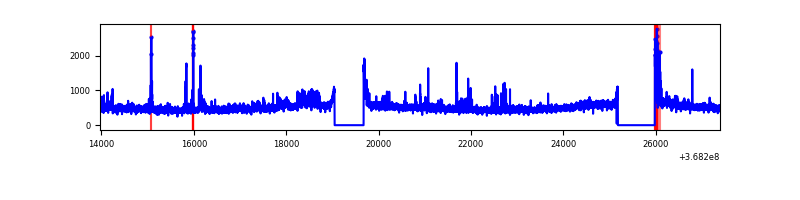 |
| D | 13424 | 11995 | 155 | 155 | 1.15% | 1.29% | 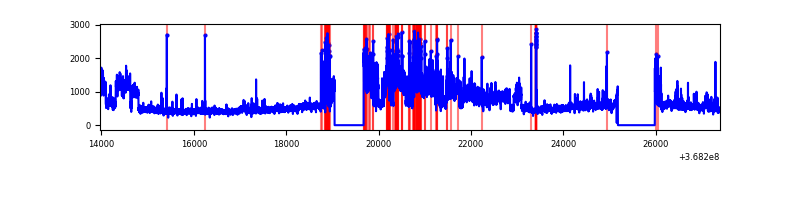 |
Top three noisy pixels from each quadrant. If the there are fewer than three noisy pixels in the level2.evt file, extra rows are filled as -1
| Pixel properties | Quadrant properties | ||||||
|---|---|---|---|---|---|---|---|
| Quadrant | DetID | PixID | Counts | Sigma | Mean | Median | Sigma |
| A | 13 | 254 | 23359 | 75.03 | 1463 | 1438 | 292.2 |
| A | 13 | 6 | 21940 | 70.17 | 1463 | 1438 | 292.2 |
| A | 3 | 137 | 14638 | 45.18 | 1463 | 1438 | 292.2 |
| B | 6 | 159 | 3313450 | 12062.48 | 1439 | 1398 | 274.6 |
| B | 5 | 172 | 382847 | 1389.24 | 1439 | 1398 | 274.6 |
| B | 10 | 245 | 156614 | 565.3 | 1439 | 1398 | 274.6 |
| C | 0 | 10 | 258379 | 785.74 | 1395 | 1406 | 327.0 |
| C | 14 | 238 | 240592 | 731.35 | 1395 | 1406 | 327.0 |
| C | 3 | 233 | 122551 | 370.42 | 1395 | 1406 | 327.0 |
| D | 8 | 195 | 2410884 | 7218.37 | 1401 | 1364 | 333.8 |
| D | 12 | 233 | 648316 | 1938.12 | 1401 | 1364 | 333.8 |
| D | 2 | 250 | 96641 | 285.43 | 1401 | 1364 | 333.8 |
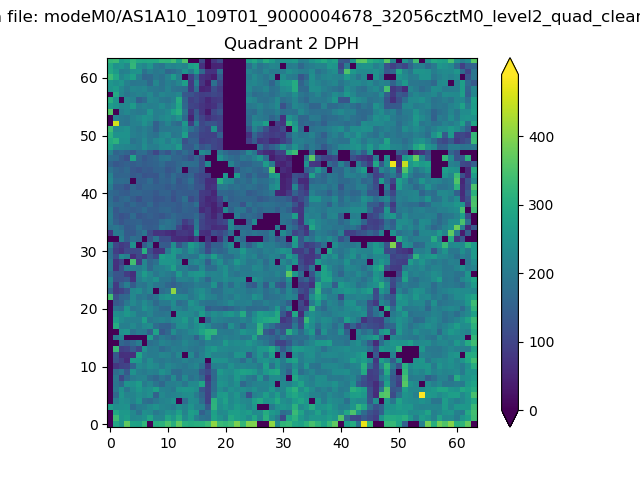
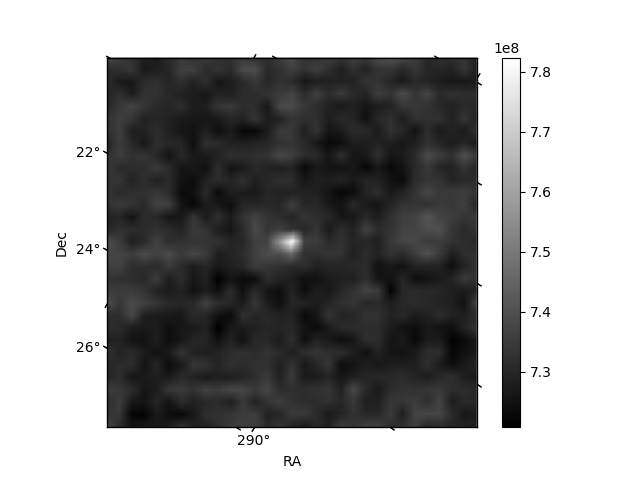
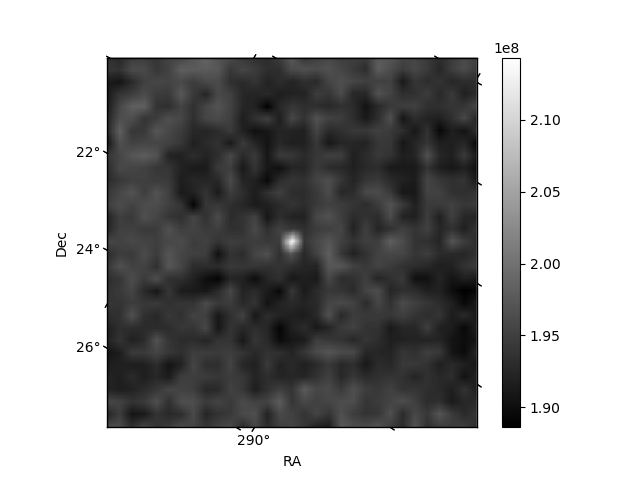
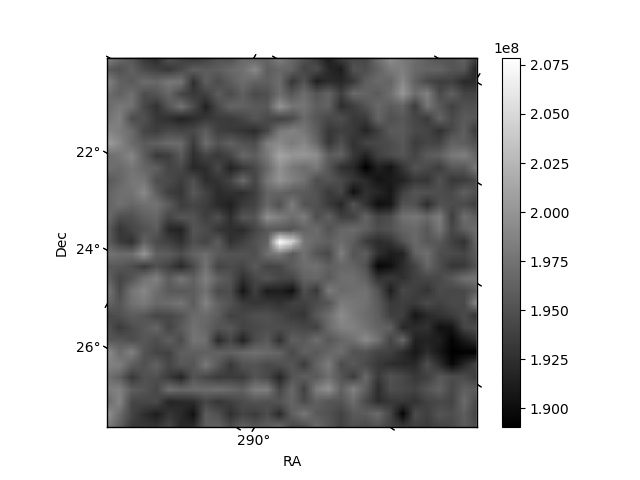
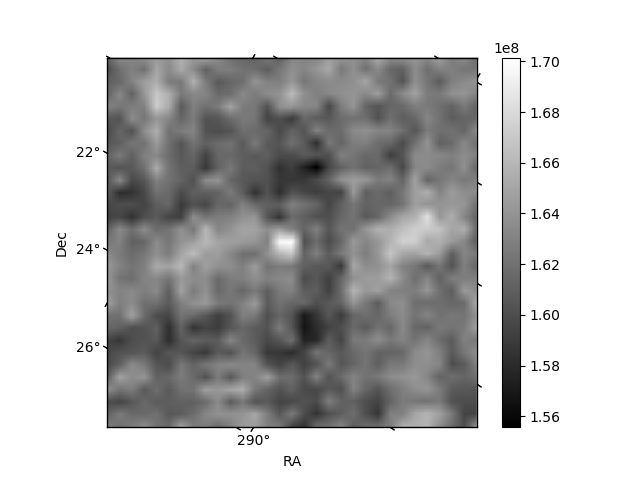
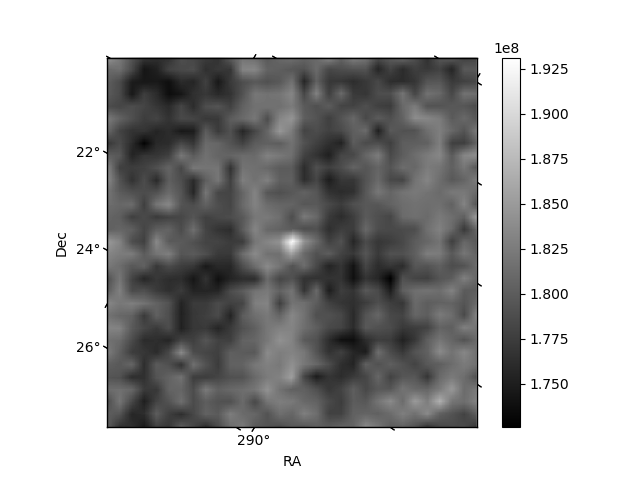
Histogram calculated using DETX and DETY for each event in the final _common_clean file
| Quadrant A | 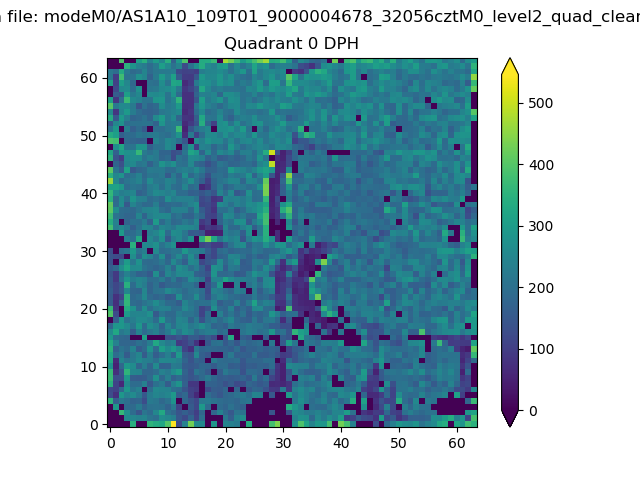 |
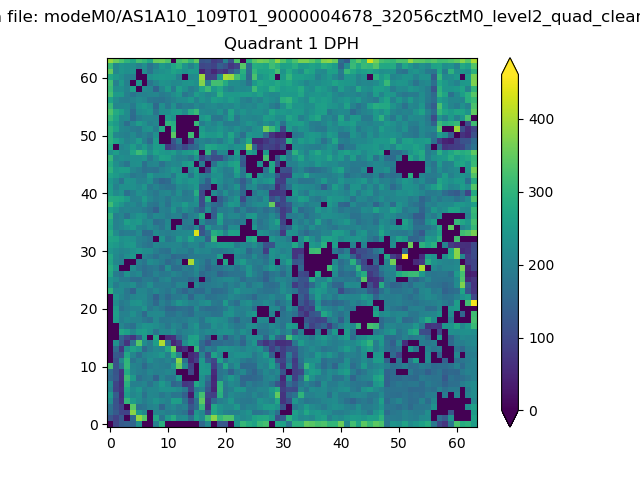 |
Quadrant B |
|---|---|---|---|
| Quadrant D | 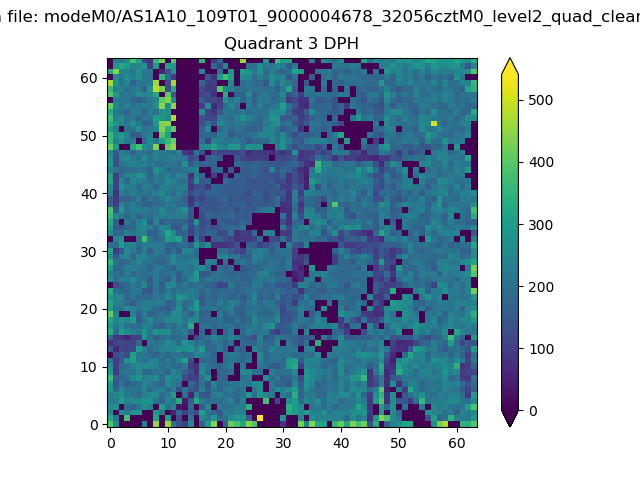 |
 |
Quadrant C |
| Plot type | Count rate plots | Images |
|---|---|---|
| Comparison with Poisson distribution Blue bars denote a histogram of data divided into 1 sec bins. Red curve is a Poisson curve with rate = median count rate of data. |
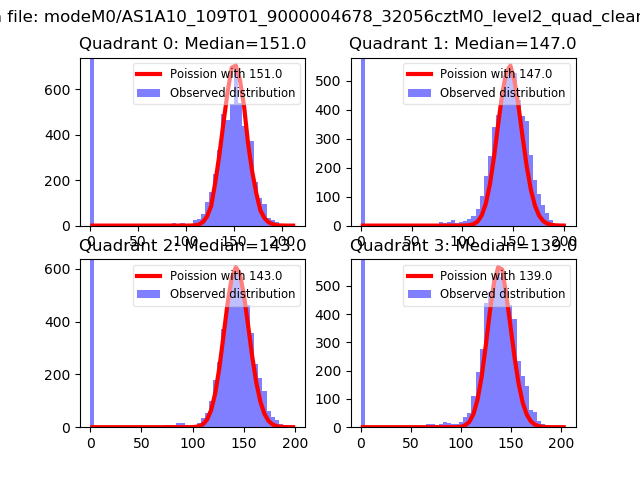 |
 |
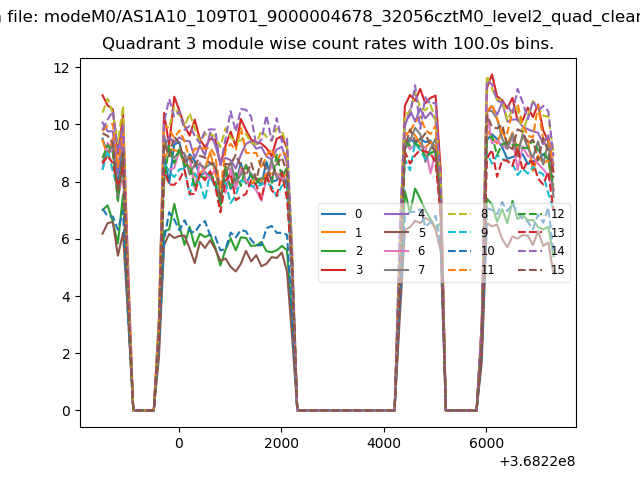
| Quadrant-wise count rates Data is divided into 100 sec bins |
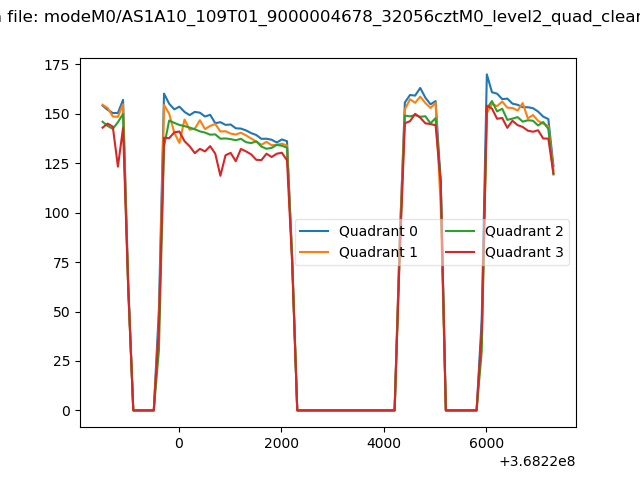 |
|
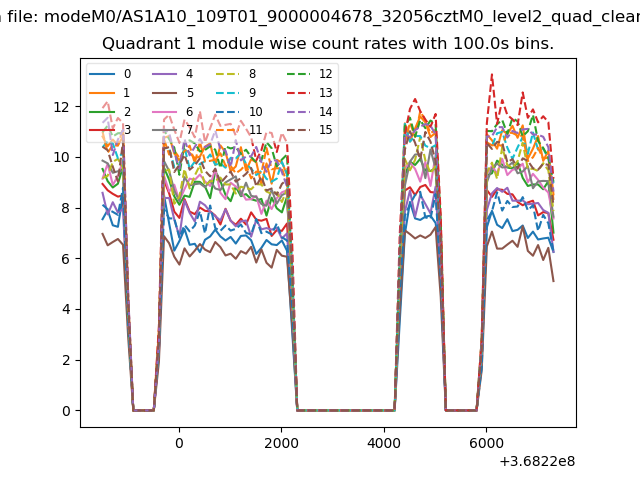
| Module-wise count rates for Quadrant A Data is divided into 100 sec bins |
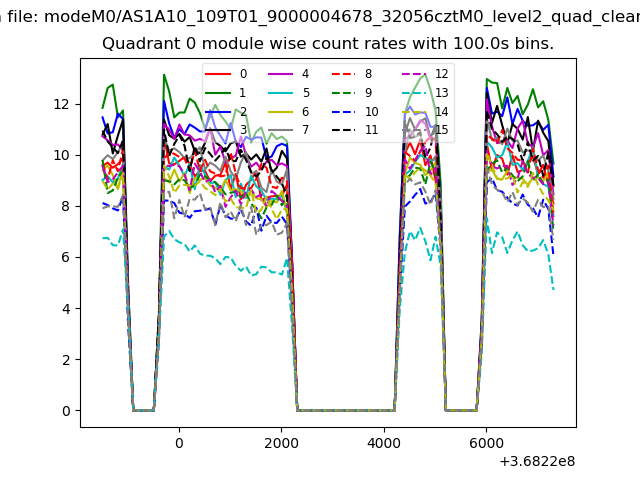 |
 |
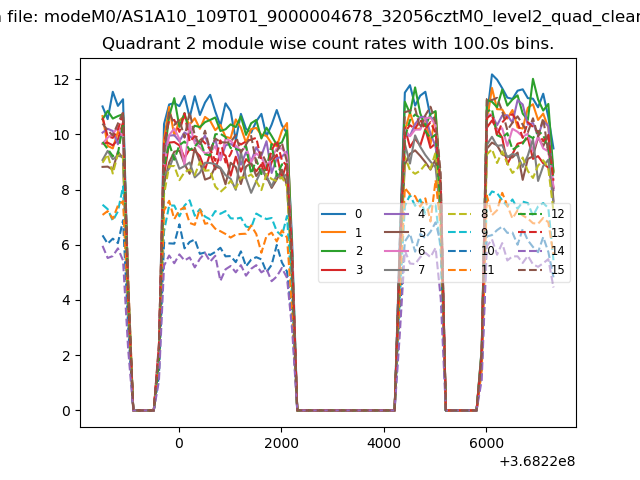
| Module-wise count rates for Quadrant B Data is divided into 100 sec bins |
 |
 |
| Module-wise count rates for Quadrant C Data is divided into 100 sec bins |
 |
 |
| Module-wise count rates for Quadrant D Data is divided into 100 sec bins |
 |
 |
| Parameter | Plot |
|---|---|
| CZT HV Monitor | 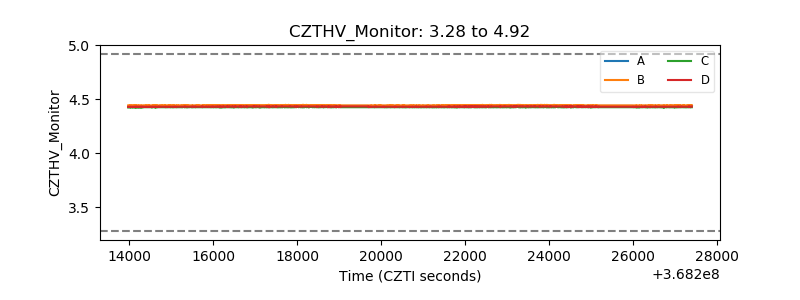 |
| D_VDD | 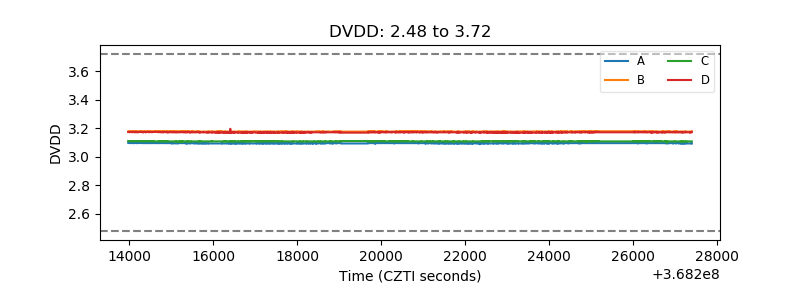 |
| Temperature 1 | 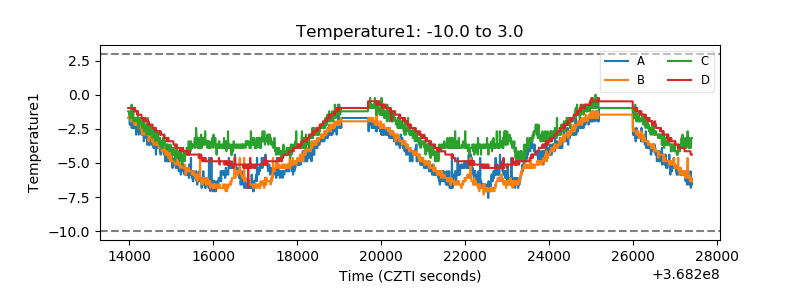 |
| Veto HV Monitor | 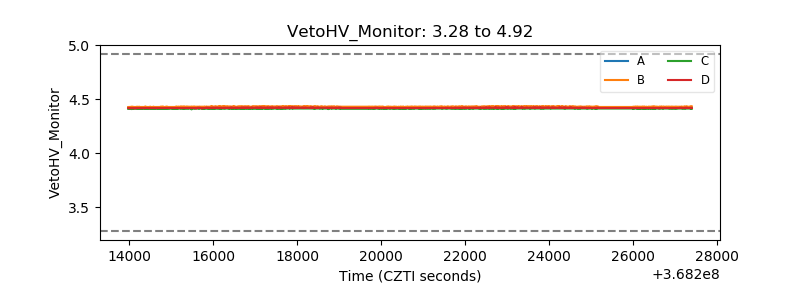 |
| Veto LLD | 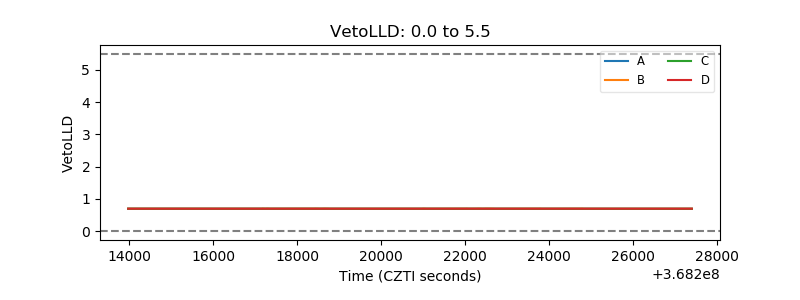 |
| Alpha Counter | 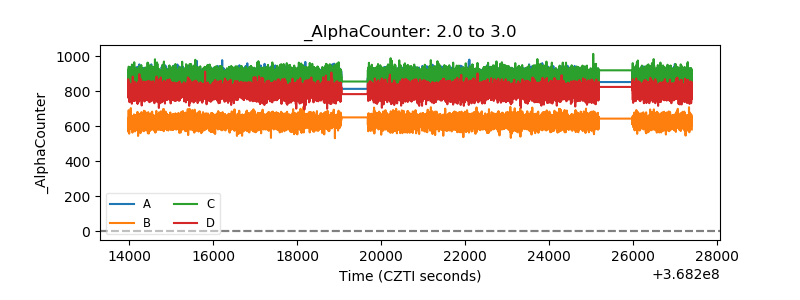 |
| _CPM_Rate | 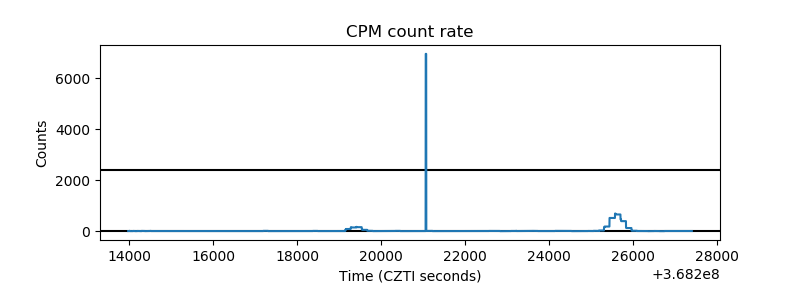 |
| CZT Counter | 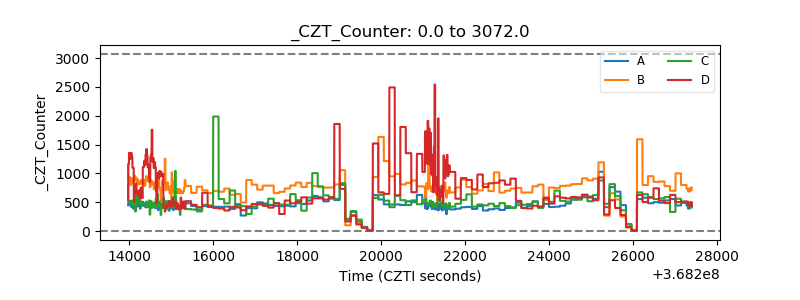 |
| +2.5 Volts monitor | 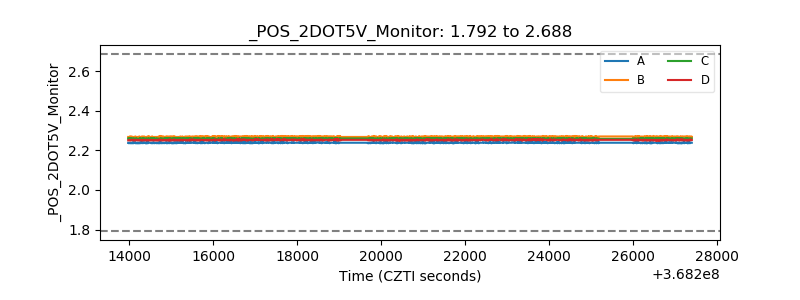 |
| +5 Volts monitor | 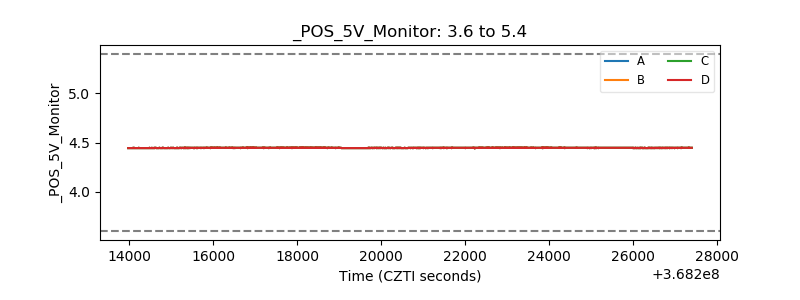 |
| _ROLL_ROT | 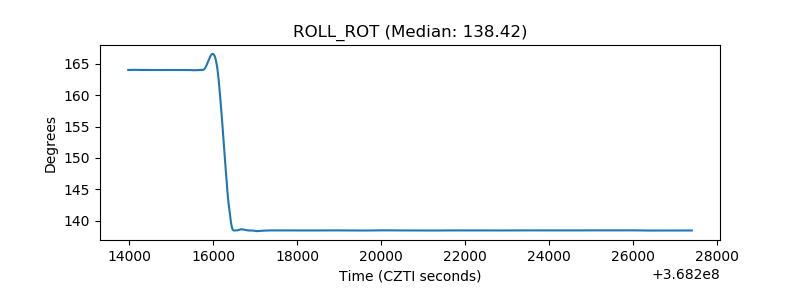 |
| _Roll_DEC | 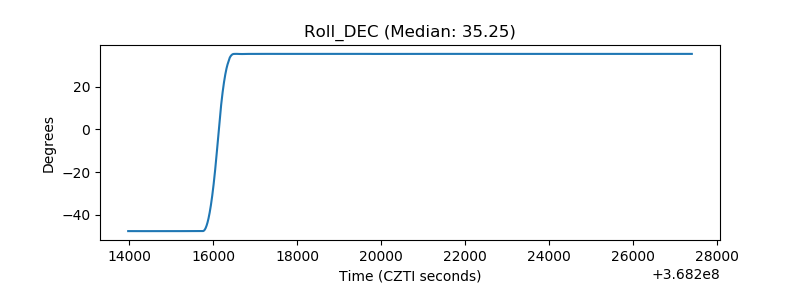 |
| _Roll_RA | 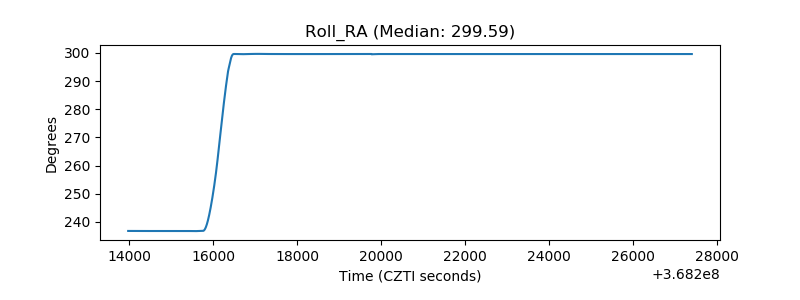 |
| Veto Counter | 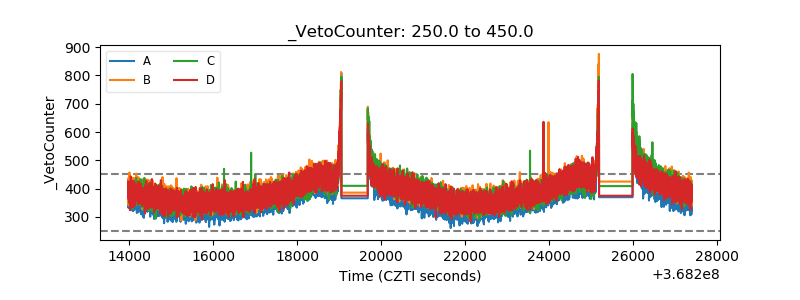 |