| Param | Original file | Final file |
|---|---|---|
| Filename | modeM0/AS1A10_109T01_9000004678_32058cztM0_level2.evt | modeM0/AS1A10_109T01_9000004678_32058cztM0_level2_quad_clean.evt |
| Size (bytes) | 547,390,080 | 104,402,880 |
| Size | 522.0 MB | 99.6 MB |
| Events in quadrant A | 3,204,655 | 703,157 |
| Events in quadrant B | 5,151,558 | 699,081 |
| Events in quadrant C | 3,843,512 | 662,134 |
| Events in quadrant D | 3,942,520 | 648,705 |
| Mode M9 | |||
|---|---|---|---|
| Quadrant | BADHDUFLAG | Total packets | Discarded packets |
| A | 0 | 15 | 0 |
| B | 0 | 16 | 0 |
| C | 0 | 16 | 0 |
| D | 0 | 16 | 0 |
| Mode SS | |||
|---|---|---|---|
| Quadrant | BADHDUFLAG | Total packets | Discarded packets |
| A | 0 | 128 | 0 |
| B | 0 | 128 | 0 |
| C | 0 | 128 | 0 |
| D | 0 | 128 | 0 |
| Mode M0 | |||
|---|---|---|---|
| Quadrant | BADHDUFLAG | Total packets | Discarded packets |
| A | 0 | 13508 | 1 |
| B | 0 | 19832 | 1 |
| C | 0 | 15547 | 1 |
| D | 0 | 16119 | 1 |
| Quadrant | Total seconds | Saturated seconds | Saturation percentage |
|---|---|---|---|
| A | 6434 | 25 | 0.388561% |
| B | 6434 | 92 | 1.429904% |
| C | 6434 | 184 | 2.859807% |
| D | 6433 | 41 | 0.637339% |
Noise dominated data is calculated using 1-second bins in cleaned event files. If a bin has >2000 counts, and if more than 50% of those come from <1% of pixels, then it is considered to be noise-dominated and hence unusable.
| Quadrant | # 1 sec bins | Bins with >0 counts | Bins with >2000 counts | High rate bins dominated by noise | Noise dominated (total time) | Noise dominated (detector-on time) | Marked lightcurve |
|---|---|---|---|---|---|---|---|
| A | 7534 | 6434 | 0 | 0 | 0.00% | 0.00% | 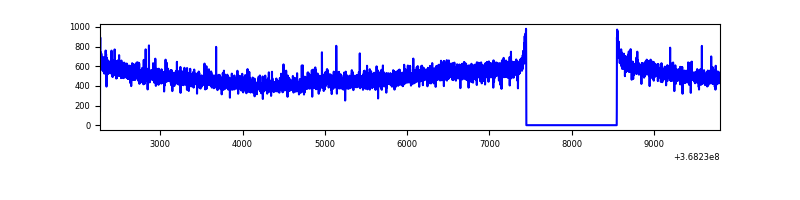 |
| B | 7534 | 6434 | 10 | 10 | 0.13% | 0.16% | 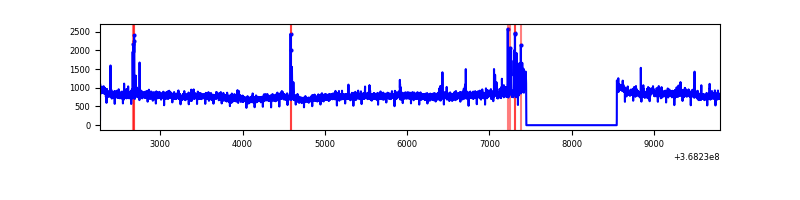 |
| C | 7534 | 6434 | 51 | 51 | 0.68% | 0.79% | 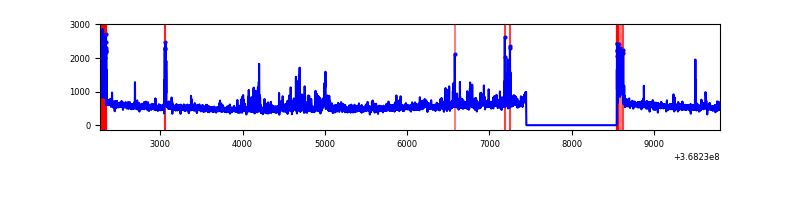 |
| D | 7533 | 6434 | 15 | 15 | 0.20% | 0.23% | 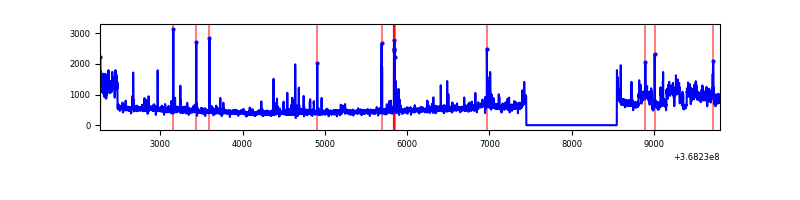 |
Top three noisy pixels from each quadrant. If the there are fewer than three noisy pixels in the level2.evt file, extra rows are filled as -1
| Pixel properties | Quadrant properties | ||||||
|---|---|---|---|---|---|---|---|
| Quadrant | DetID | PixID | Counts | Sigma | Mean | Median | Sigma |
| A | 12 | 16 | 13747 | 78.07 | 825 | 810 | 165.7 |
| A | 13 | 254 | 11458 | 64.25 | 825 | 810 | 165.7 |
| A | 12 | 194 | 8083 | 43.89 | 825 | 810 | 165.7 |
| B | 6 | 159 | 1783569 | 11504.07 | 817 | 799 | 155.0 |
| B | 5 | 172 | 63889 | 407.11 | 817 | 799 | 155.0 |
| B | 10 | 245 | 39295 | 248.41 | 817 | 799 | 155.0 |
| C | 0 | 10 | 390342 | 2119.86 | 786 | 793 | 183.8 |
| C | 3 | 233 | 141861 | 767.67 | 786 | 793 | 183.8 |
| C | 14 | 238 | 127342 | 688.66 | 786 | 793 | 183.8 |
| D | 8 | 195 | 790780 | 4127.09 | 793 | 774 | 191.4 |
| D | 2 | 250 | 66088 | 341.21 | 793 | 774 | 191.4 |
| D | 12 | 233 | 55240 | 284.54 | 793 | 774 | 191.4 |
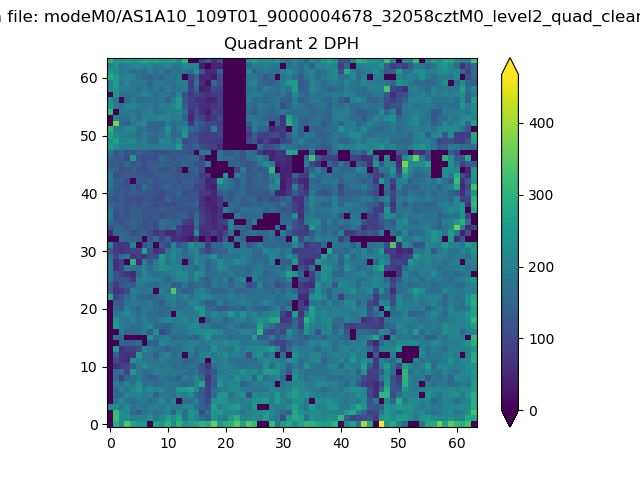
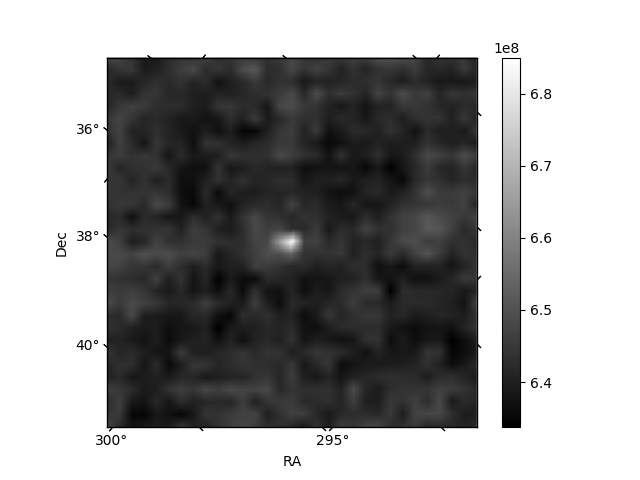
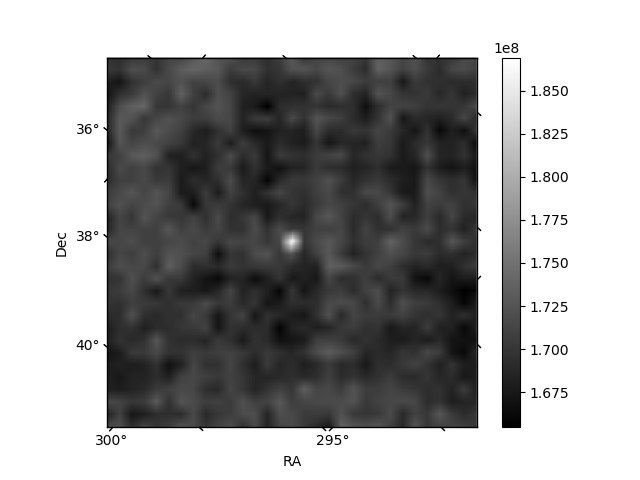
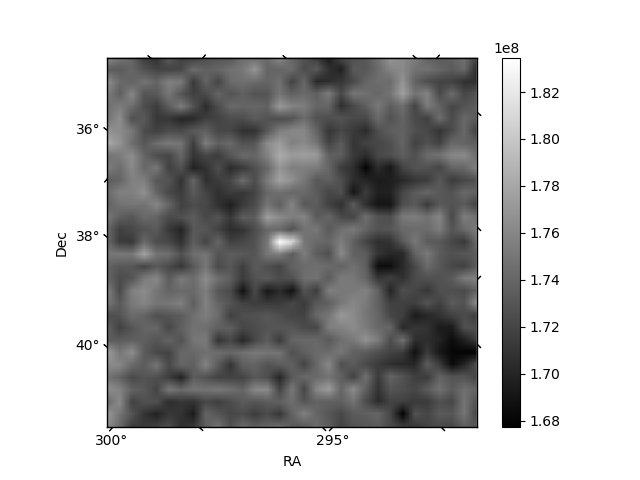
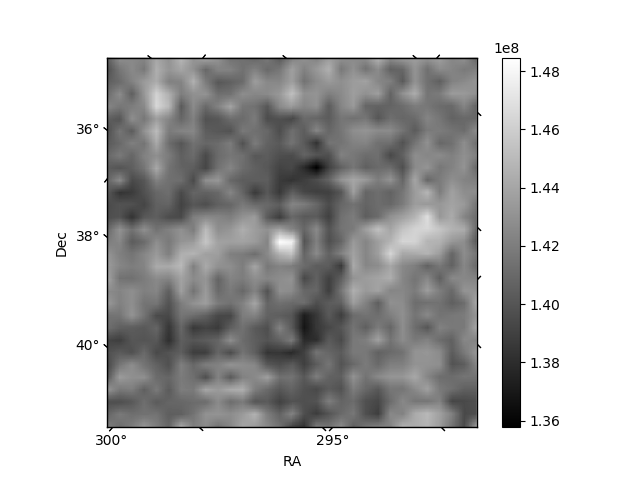
Histogram calculated using DETX and DETY for each event in the final _common_clean file
| Quadrant A | 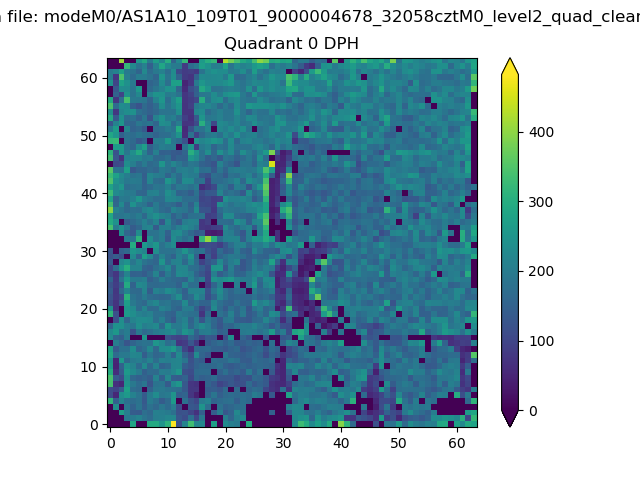 |
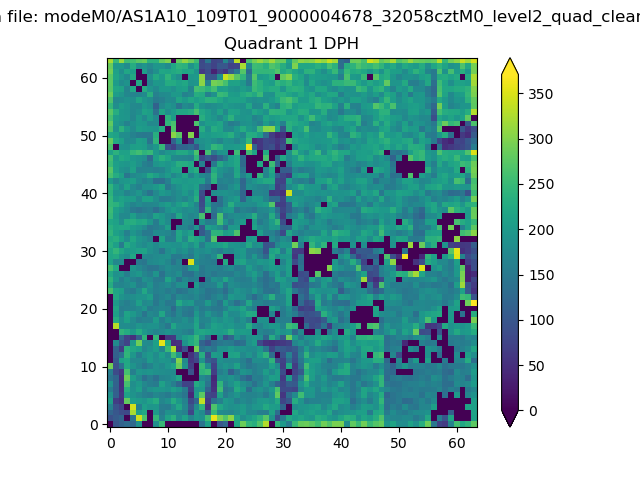 |
Quadrant B |
|---|---|---|---|
| Quadrant D | 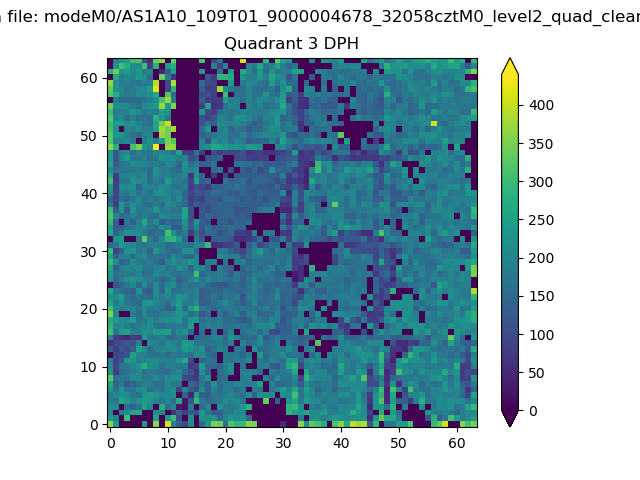 |
 |
Quadrant C |
| Plot type | Count rate plots | Images |
|---|---|---|
| Comparison with Poisson distribution Blue bars denote a histogram of data divided into 1 sec bins. Red curve is a Poisson curve with rate = median count rate of data. |
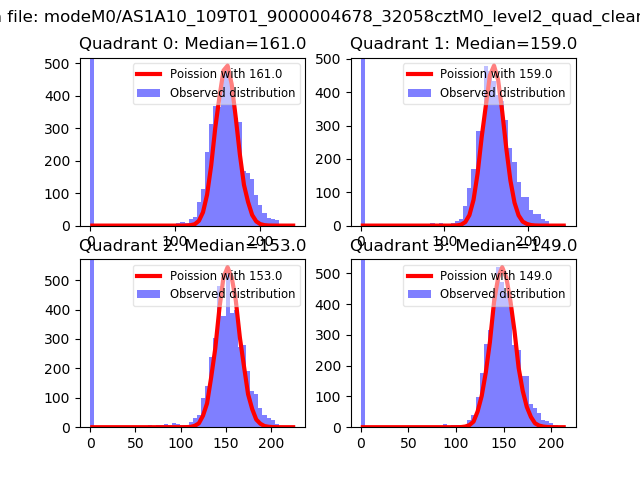 |
 |
| Quadrant-wise count rates Data is divided into 100 sec bins |
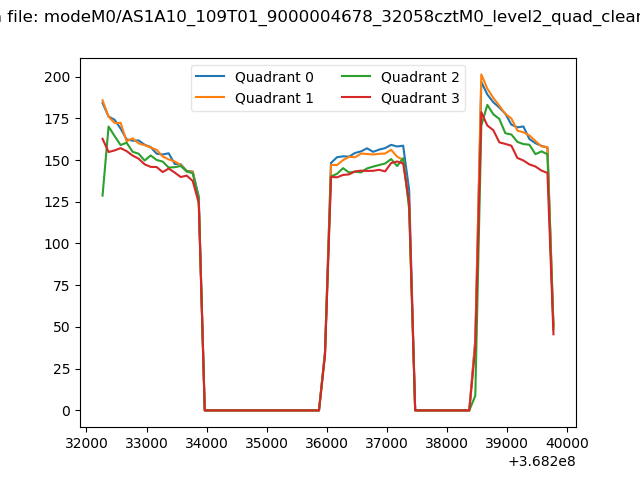 |
|
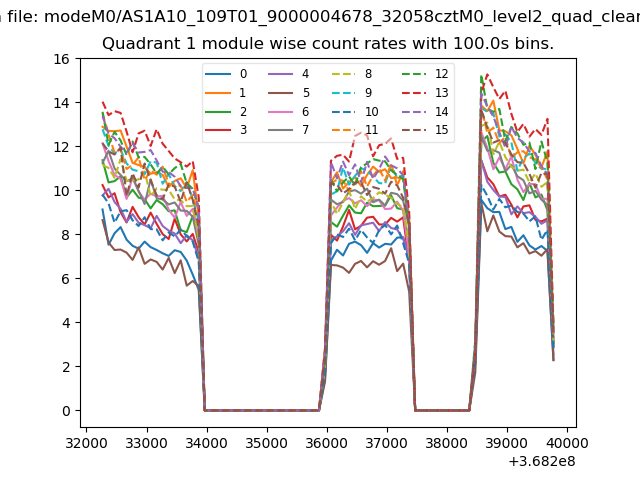
| Module-wise count rates for Quadrant A Data is divided into 100 sec bins |
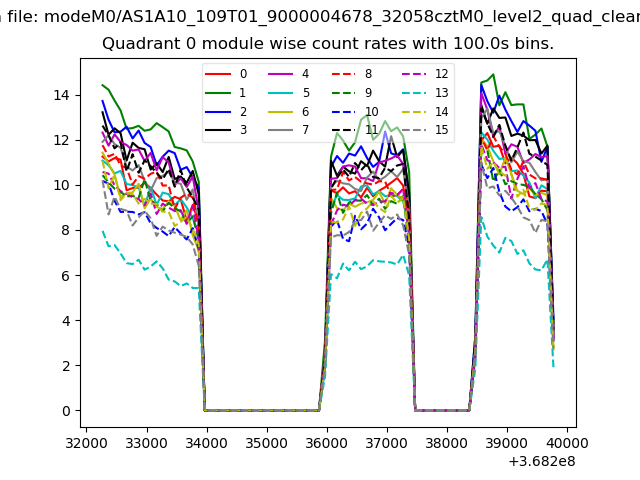 |
 |
| Module-wise count rates for Quadrant B Data is divided into 100 sec bins |
 |
 |
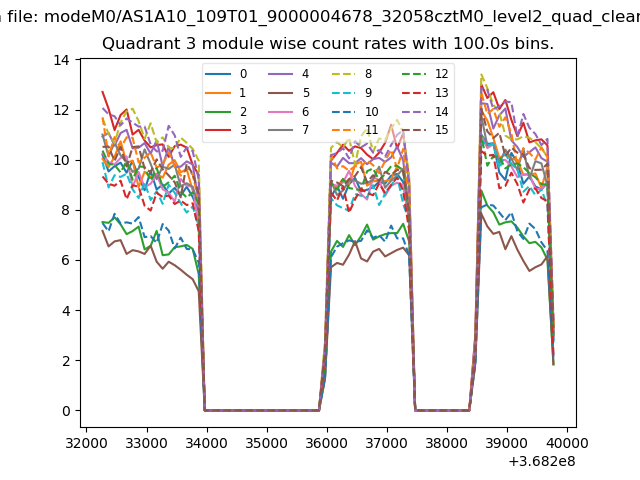
| Module-wise count rates for Quadrant C Data is divided into 100 sec bins |
 |
 |
| Module-wise count rates for Quadrant D Data is divided into 100 sec bins |
 |
 |
| Parameter | Plot |
|---|---|
| CZT HV Monitor |  |
| D_VDD | 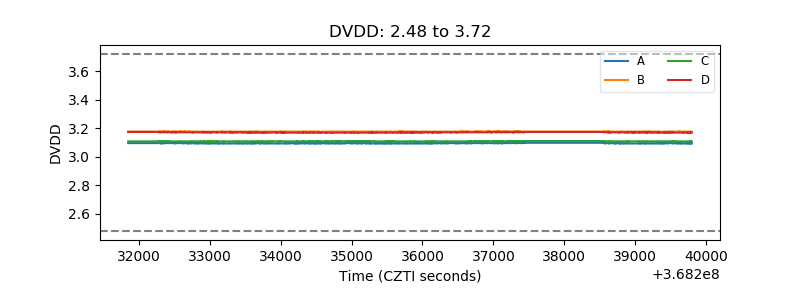 |
| Temperature 1 | 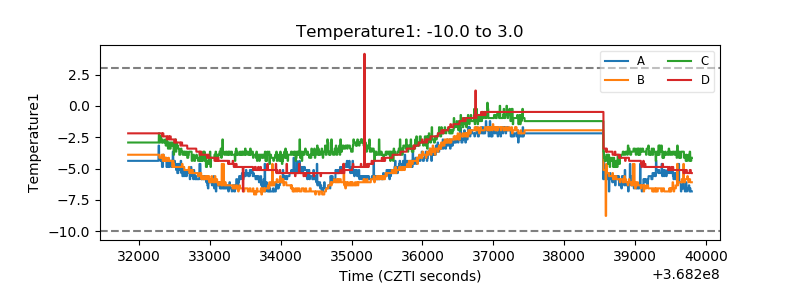 |
| Veto HV Monitor | 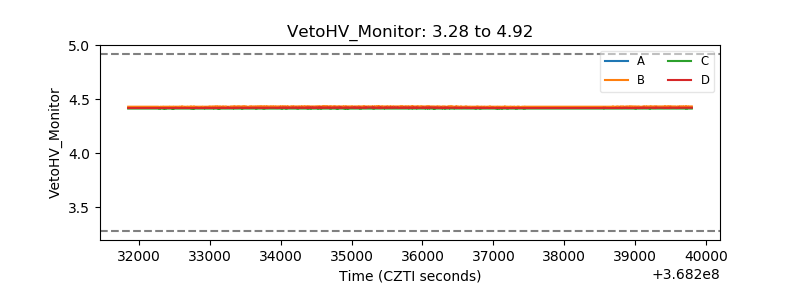 |
| Veto LLD | 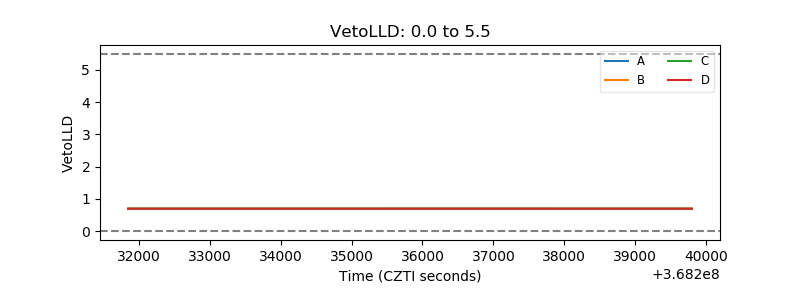 |
| Alpha Counter | 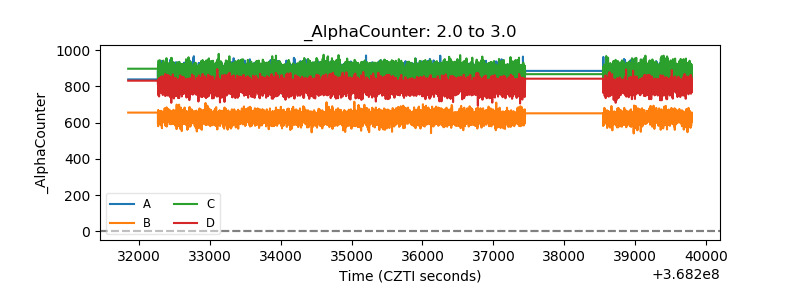 |
| _CPM_Rate | 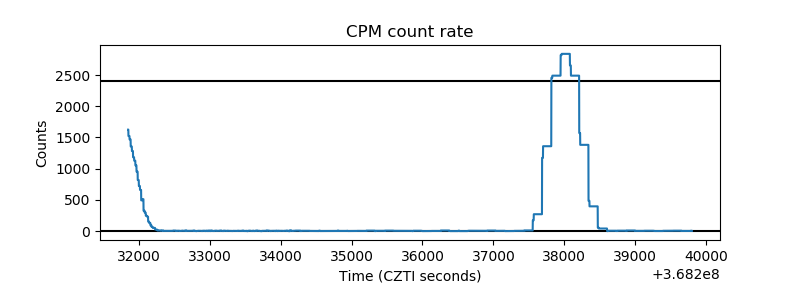 |
| CZT Counter | 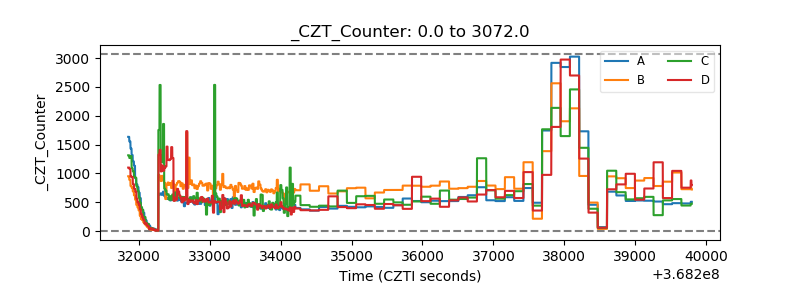 |
| +2.5 Volts monitor |  |
| +5 Volts monitor |  |
| _ROLL_ROT | 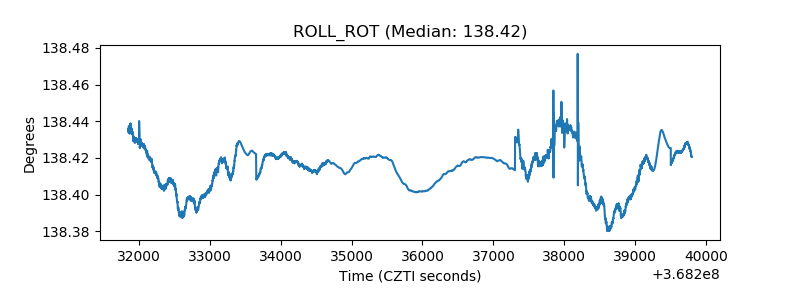 |
| _Roll_DEC | 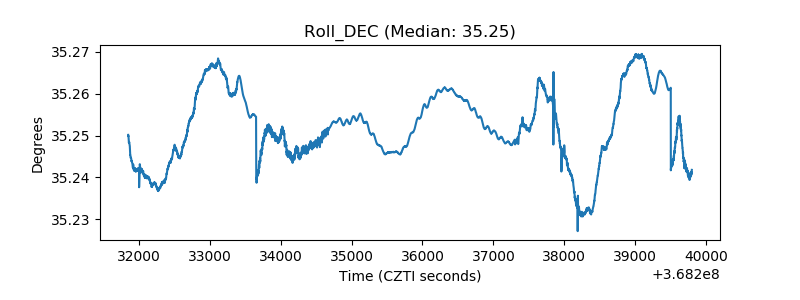 |
| _Roll_RA | 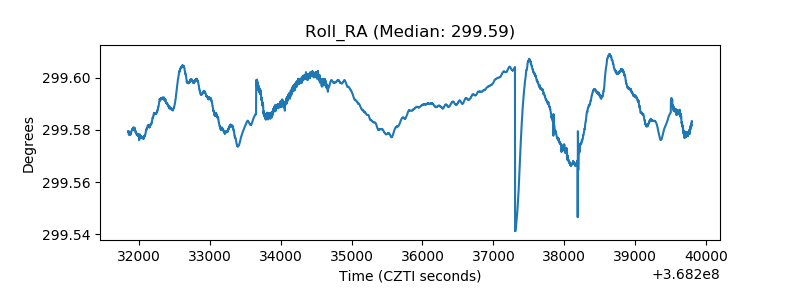 |
| Veto Counter | 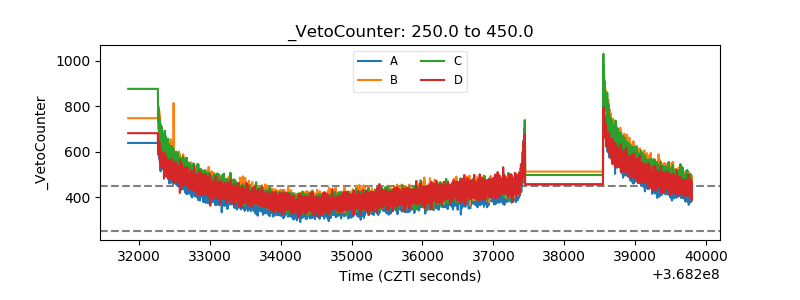 |